From One Seasonal Extreme to Another

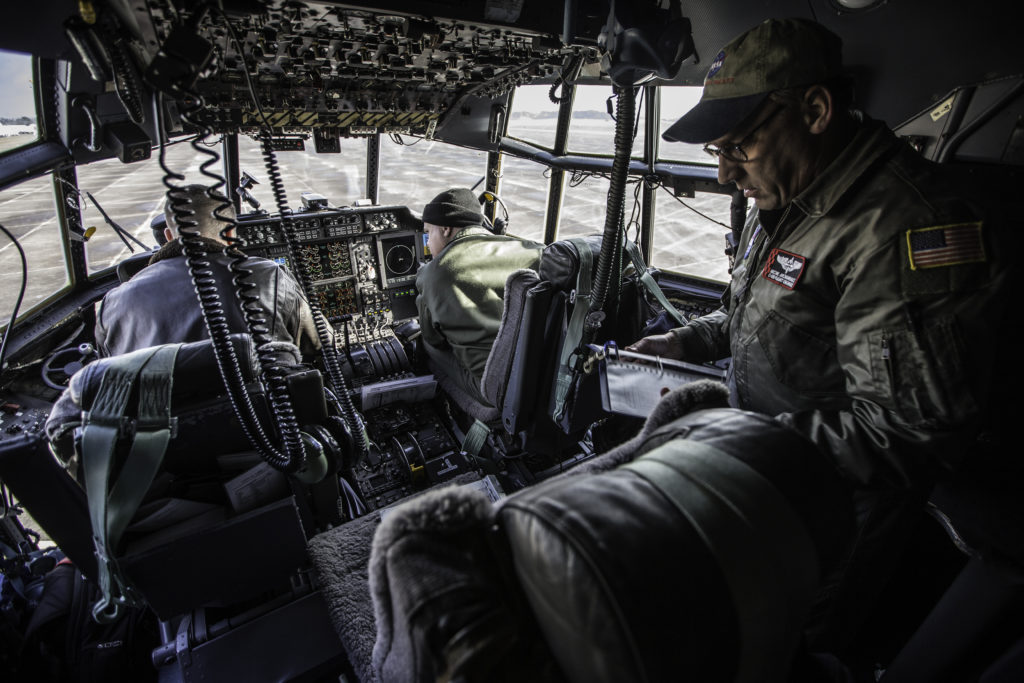
The crew of the C-130, including flight engineer Archie Archambault, foreground, prepare to depart Wallops for Shreveport, Louisiana — the first stop for ACT-America’s winter field campaign. Credit: NASA/Patrick Black

by Joe Atkinson / HAMPTON, VIRGINIA /

Last year, the first in a series of five flight campaigns for Atmospheric Carbon and Transport-America, or ACT-America, sent researchers into the field at the blazing peak of summer.

The flights were investigating how weather systems and other atmospheric phenomena affect the movement of carbon dioxide and methane in the atmosphere around the eastern half of the United States.

This year, those same researchers are doing it all again. And this time, they’re heading out during the deepest, coldest part of winter. Flights out of Shreveport, Louisiana, begin February 1. In coming weeks, ACT-America’s base of operations will move twice — once to Lincoln, Nebraska, and then to coastal Virginia.
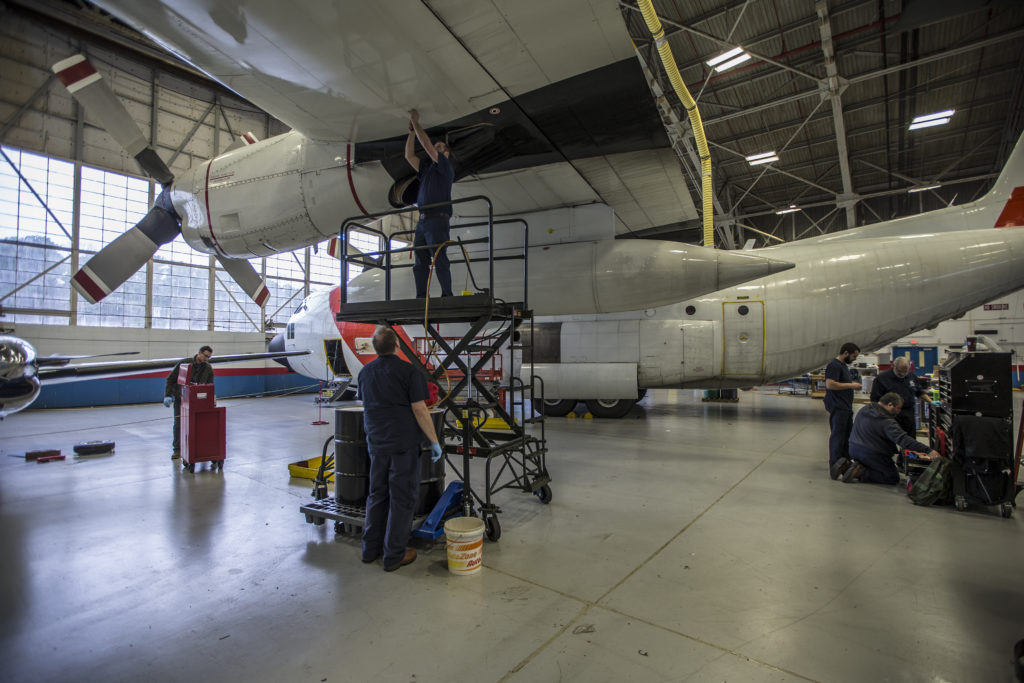
A crew makes final preparations to NASA’s C-130H at Wallops Flight Facility on Virginia’s Eastern Shore ahead of ACT-America’s winter field campaign. Credit: NASA/Patrick Black

So why trade one seasonal extreme for another?

“Because the carbon budget, especially when it comes to carbon dioxide, is highly seasonal,” said Ken Davis, ACT-America prinicpal investigator from Penn State University.

From summer to winter, the exchange of carbon dioxide between the biosphere on land and the atmosphere goes through some big changes.

“The biosphere is growing vigorously in the summer, taking carbon dioxide out of the atmosphere,” said Davis from his office at Penn State. “In the winter, it’s slowly breathing out — not a lot, because it’s cold. But it is slowly exhaling all winter long.”

The transport of greenhouse gases through the atmosphere can be quite different in winter as well. The jet stream plunges deeper south and tends to bring with it more intense storms. Those mid-latitude cyclones cause vigorous mixing of the gases in the atmosphere.

One thing that tends to stay relatively steady from season to season — human carbon emissions from the extraction and burning of fossil fuels.

What makes ACT-America unique is that it marks the first time aircraft outfitted to take advanced measurements of greenhouse gases have collected continuous data on how greenhouse gases are transported through the atmosphere by weather systems.

Previous measurements studying greenhouse gases have mostly come from tower-based measurement stations and satellites (one of ACT-America’s goals is actually to verify data coming in from NASA’s Orbiting Carbon Observatory-2 satellite), or from aircraft flying in fair weather conditions when atmospheric transport is relatively simple.

The campaign will use instruments on a C-130H based out of NASA’s Wallops Flight Facility on Virginia’s Eastern Shore and a King Air B-200 based out of NASA’s Langley Research Center in Hampton, Virginia.
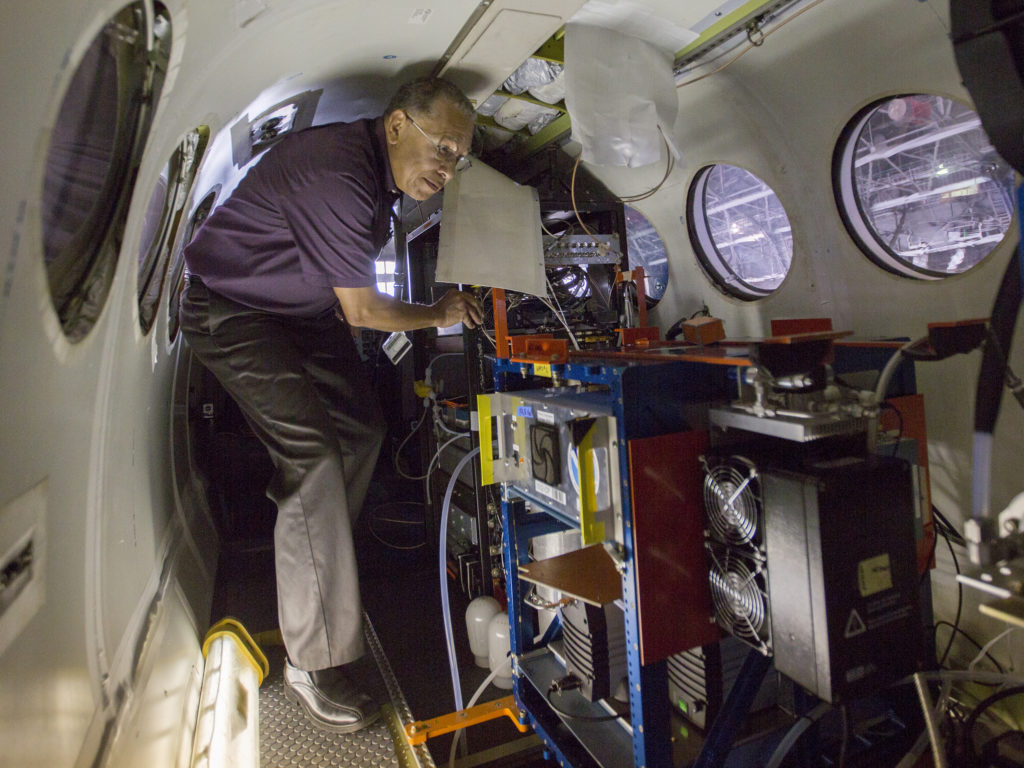
Charles Howell, electronics engineer, makes final adjustments to the electrical system of NASA’s King Air B-200 at Langley Research Center in Hampton, Virginia. Credit: NASA/David C. Bowman

Davis believes the data the ACT-America team is collecting could help paint a much more detailed picture of what’s happening with greenhouse gases in the U.S.

“It’s our vision to enable the research community to monitor over time and space carbon dioxide and methane fluxes,” he said. “For example, if forests in the eastern U.S. become stressed by droughts and begin to de-gas their carbon stocks into the atmosphere, we want be able to detect it from atmospheric data and know quickly that we have a problem. And if measures are taken to reduce methane emissions from agriculture, and oil and gas extraction, we want to be able to verify that they’re proving effective.”

Breaking up the Intensity
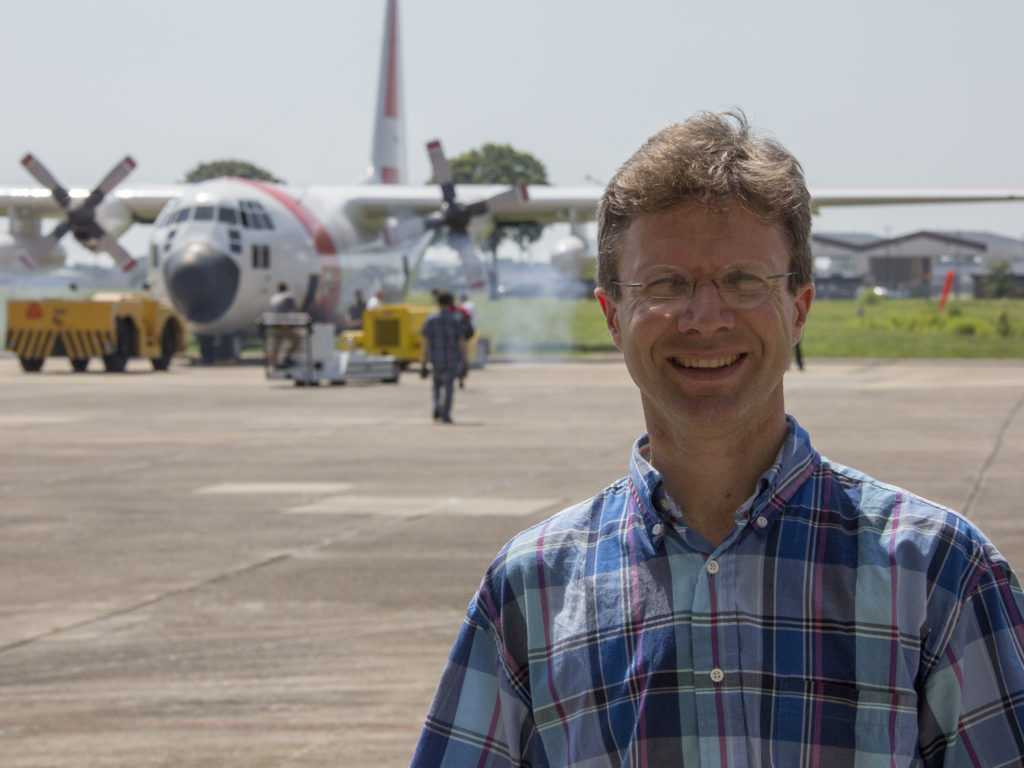
Amid the flurry of activity that comes with being in the field, Ken Davis, principal investigator for ACT-America from Penn State, finds moments of calm in running and exploring nature. Credit: NASA/David C. Bowman

That long-term vision motivates Davis as he faces what he refers to as “the intensity of the field deployment.”

To keep the intensity manageable, he finds little ways to decompress. The Penn State professor is an avid runner. Last summer, when he wasn’t on a flight or planning a flight or doing something related to the campaign, it wasn’t unusual to catch Davis in his unofficial uniform: a T-shirt, shorts and running shoes. That’s not likely to change for this flight campaign, regardless of the weather.

“That’s been my thing for a long time,” he said. “Get outside, go for a run.”

Davis also hopes to slow down and enjoy his surroundings — particularly in Virginia.

Last July wasn’t exactly the best time for that. From his temporary home base at Wallops, Davis ventured out to visit nearby Chincoteague National Wildlife Refuge and Assateague Island National Seashore. The area is known for its pristine beaches, herds of wild ponies and migratory bird populations.

Unfortunately, when it’s warm, the area is also known for its hungry mosquitoes.

So Davis hopes the winter season will not only bring changes to concentrations of greenhouse gases, but also to concentrations of blood-sucking insects.

“We went out there in the summer and were eaten alive,” he said. “But I like the place and it should be fun to see it in the winter when we won’t be eaten alive.”

Why Ocean Particles? Why NASA?

by Stephanie Schollaert Uz / NORTHERN PACIFIC OCEAN /

Rolling with the waves on the research vessel Falkor, we’re searching for particles—primarily microscopic marine plants called phytoplankton, which play an important role in supporting life on Earth. Ocean phytoplankton come in many sizes, colors and types. This diversity determines their roles in the marine food web and our ability to distinguish them from Earth-observing satellites.

With improved optical instrumentation, we hope to regularly monitor their unique spectral signatures, or colors, from space. The collection of high-quality measurements taken at sea is essential for achieving that goal. Among the international team of 14 scientists and an artist-at-sea aboard this ship, many are using new technology and methods for the first time.

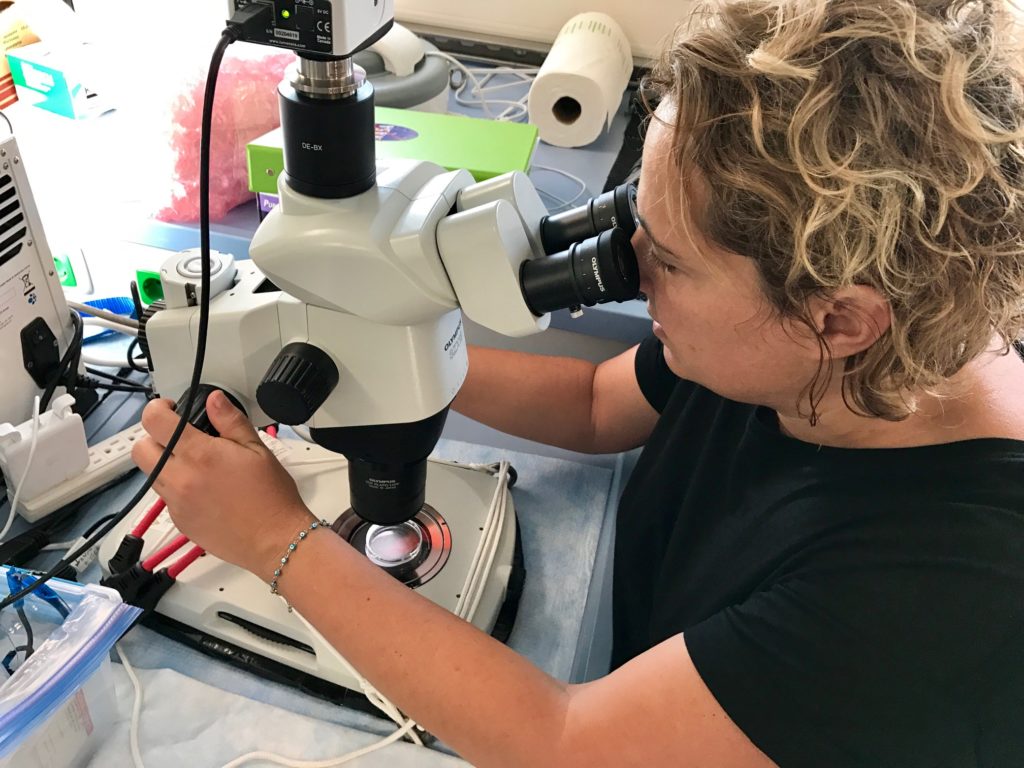
Zrinka Ljubesic, University of Zagreb, is observing phytoplankton and swimming zooplankton in sea water samples through the microscope. Credit: Stephanie Schollaert Uz/NASA
Zrinka Ljubesic, University of Zagreb, is observing phytoplankton and swimming zooplankton in sea water samples through a microscope. Credit: Stephanie Schollaert Uz/NASA

We sailed out of Honolulu on Thursday, January 26, and will end the expedition, called the Sea to Space Particle Investigation, in Portland, Oregon, next month. Our first stop to test instruments and collect samples was near the Marine Optical Buoy (MOBY) off Lanai, which has been measuring ocean color to calibrate NASA satellite data for 20 years.

Cloud-free skies at MOBY meant that I could take indirect measurements of atmospheric particles using a hand-held sun photometer. Knowing what’s in the sky is important for correcting satellite measurements of ocean color. About 90 percent of the signal satellites receive comes from the atmosphere. These sky measurements may also provide clues about the presence of mineral aerosols that fertilize phytoplankton blooms when they fall out of the air.

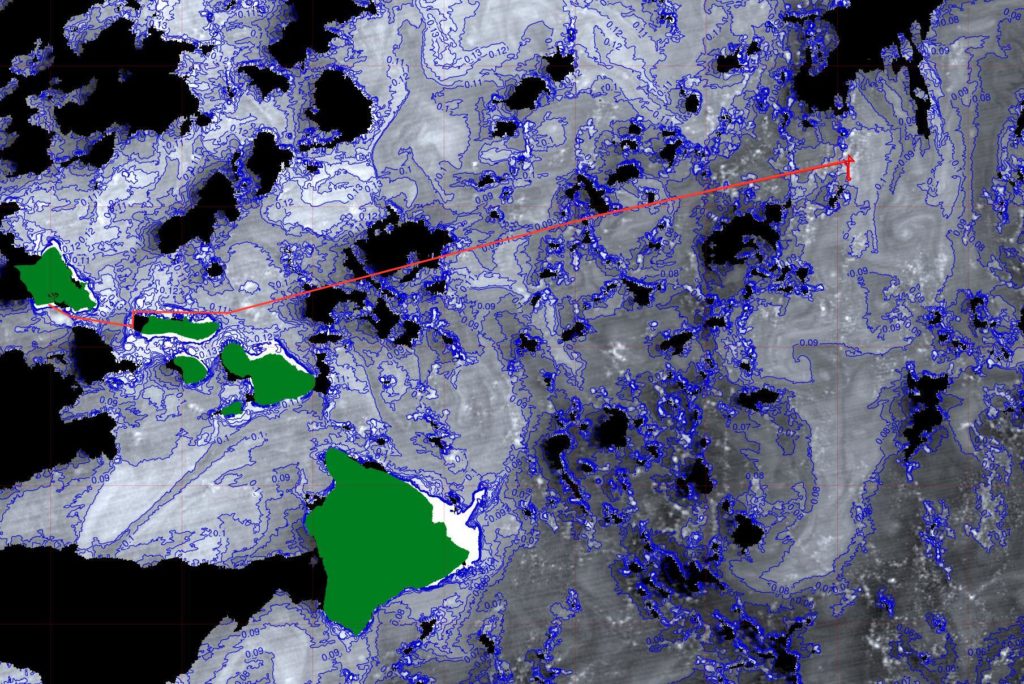
Hawaiian Islands in green with chlorophyll concentrations contoured at 0.1 mg m-3 intervals from the Suomi-NPP VIIRS at 22:54 UTC on Jan 27, 2017. The ship’s track is shown in the red line. Credit: Norman Kuring/NASA
The Hawaiian Islands are shaded green, and chlorophyll concentrations are contoured at intervals of 0.1 milligrams per cubic meter from the Suomi-NPP VIIRS at 22:54 UTC on Jan 27, 2017. The ship’s track is shown in the red line. Credit: Norman Kuring/NASA

Participating in this field campaign to improve the quality of ocean color satellite measurements are five of us from NASA Goddard’s Ocean Color group, including chief scientist Ivona Cetinic, plus NASA-funded scientists from other organizations. In addition to improving current satellite measurements, data collected here will assist in the development of algorithms for NASA’s first hyper spectral satellite called Plankton, Aerosol, Cloud, ocean Ecosystem, or PACE, scheduled to launch in 2022.

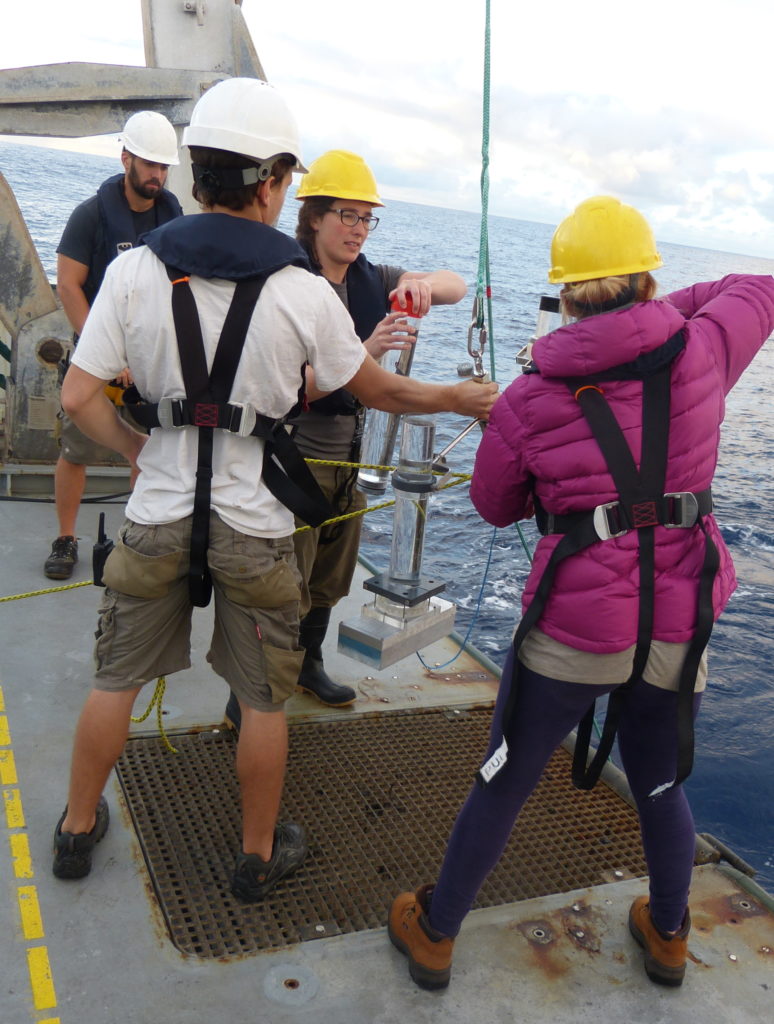
Scientists in yellow hard hats: Colleen Durkin (left) of Moss Landing Marine Lab and Melissa Omand of the University of Rhode Island (URI) ready sediment traps assisted by R/V Falkor crew members. The aluminum block below one trap includes an iPhone camera programmed for time lapse image collection by Omand and Noah Walcutt, both of URI, for use in holographic research by Ben Knorlein, Brown University. Credit: Zrinka Ljubesic, University of Zagreb
Scientists in yellow hard hats: Colleen Durkin (left) of Moss Landing Marine Lab and Melissa Omand of the University of Rhode Island (URI) ready sediment traps assisted by R/V Falkor crew members. The aluminum block below one trap includes an iPhone camera programmed for time lapse image collection by Omand and Noah Walcutt, also of URI, for use in holographic research by Ben Knorlein, Brown University. Credit: Zrinka Ljubesic, University of Zagreb

The expedition also includes scientists funded by the National Science Foundation who are conducting basic research into the variability of sinking particles, sometimes called marine snow. Two different types of sediment traps are being deployed to capture sinking particles, such as fecal pellets, aggregates and shells from certain phytoplankton, that will be identified under the microscope in the lab and through DNA sequencing.

A video clip of the Wirewalker being deployed from the RV/Falkor. Credit: Stephanie Schollaert Uz/NASA

Meg Estapa of Skidmore College uses sediment traps mounted to a neutrally buoyant float that drifts around 150 meters deep near the base of the wind-mixed surface layer. Melissa Omand of the University of Rhode Island (URI) has sediment traps that also drift at a depth of 150 meters but is tethered to a surface buoy. A Wirewalker cycles up and down between them every 10 minutes measuring physical and biological indicators such as temperature, oxygen and phytoplankton fluorescence.

The traps go with the flow for four days as we sample the ocean down to 500 meters deep in a 20-square-kilometer box around them. The crew is extremely helpful and supportive of our research—even when it involves such duties as collecting water samples in the dead of night.

R/V Falkor ship time is generously provided by the Schmidt Ocean Institute, a philanthropic organization led by Google CEO Eric Schmidt and his wife, Wendy Schmidt. Ironically, the main challenge is insufficient internet bandwidth. We’re all struggling to maintain minimal connection to the networked world. To distract us from our separation anxiety, however, is an incredible neverending menu of amazing food that one scientist compared to a wedding feast.

For #Sea2Space cruise track and updates: https://schmidtocean.org/cruise/sea-space-particle-investigation/

Ready to Go to Sea? Heck, Yes!

by Stephanie Schollaert Uz / GREENBELT, MARYLAND /

On January 20, as our nation’s capitol kicks into full inauguration frenzy, I’ll be catching a flight in the pre-dawn hours and heading west to the middle of the Pacific Ocean. I have never been more excited to head out to sea! Guilt about leaving my family for a month-long research cruise aside, I have been studying the ocean from a chair for too long and jumped at the chance to participate in this expedition.

Carlie Wiener of the Schmidt Ocean Institute with a Lego model of the research vessel Falkor, the platform for the ‘Sea to Space Particle Investigation’. Credit: Stephanie Schollaert Uz
Carlie Wiener of the Schmidt Ocean Institute with a Lego model of the research vessel Falkor, the platform for the Sea to Space Particle Investigation. Credit: Stephanie Schollaert Uz

I spent the early part of my career at sea plying the North and South Atlantic and the Mediterranean Sea: first as a Naval meteorology and oceanography officer and then as an oceanography researcher. More recently, my research has involved the nearly continuous view that satellites afford. Satellites are great because they view the entire ocean, nearly every day! But they only see the surface of the ocean, and sometimes we need to know what’s happening underneath, in the interior of the ocean, or how small-scale dynamics in the ocean are related to the surface signatures that we can detect from satellites. That is why NASA needs measurements collected at sea, and I’m looking forward to getting a close look at all the new in situ instruments in action.

The main goals of this expedition are to observe and characterize ocean phytoplankton (kinds, size, function) and sinking carbon. Measurements we collect about particles in the ocean and atmosphere will be used to tune, or ‘ground-truth,’ ocean color satellite observations. There is a lot of diversity among microscopic phytoplankton, and NASA is designing a satellite to distinguish major kinds. Data from this cruise will contribute toward that effort.

FlowCam microscopic images of diatoms (left), dinoflagellates (center & right). Credit: Harry Nelson/Fluid Imaging Technologies, Inc.
FlowCam microscopic images of diatoms (left), and dinoflagellates (center & right). Credit: Harry Nelson/Fluid Imaging Technologies, Inc.

How have I been preparing for this field campaign? Personally, I began preparing months ago by re-reading “The Never-ending Story” by Michael Ende with my ten-year-old, as the ship is named for the luckdragon Falkor. I visited my dentist and doctor to avoid any distraction in the middle of the ocean by a minor illness, such as a toothache, or a major emergency that could cost the expedition precious days at sea. More recently I have been collecting proper gear for the weather and conditions we expect between the tropics and North Pacific: water-proof overalls and jacket, steel-toed boots. Friends who’ve been to sea more recently also advised packing other details I’d forgotten, like shower shoes. With all the wintertime weather we could get, I’m packing motion-sickness medicine in case of high seas.

My sea bag - no space to store suitcases at sea – packed for the tropics and the foul weather anticipated in the North Pacific. Credit: Stephanie Schollaert Uz/NASA
My sea bag – no space to store suitcases at sea – packed for the tropics and the foul weather anticipated in the North Pacific. Credit: Stephanie Schollaert Uz/NASA

Professional preparations also started months ago. My scientific contribution to the campaign will include monitoring physical variables (temperatures, currents, sea-surface heights) that indicate dynamical processes bringing nutrients from the depths toward the surface ocean to fertilize phytoplankton blooms. I’ve been talking to colleagues at NASA Goddard, JPL and NOAA who provide continuous near-real-time satellite and computer model information for this region that we can access during the cruise.

When we have cloud-free skies, I will take measurements of atmospheric particles using a hand-held sun photometer loaned to me by the Maritime Aerosol Network group at NASA Goddard. Knowing what’s in the sky is important for correcting satellite measurements of the ocean’s surface – about 90% of the signal satellites receive comes from the atmosphere. These sky measurements may also provide clues about the presence of mineral aerosols that fertilize phytoplankton blooms when they fall out of the air.

Current sea-surface temperatures with the approximate track of the R/V Falkor from Hawaii to the Pacific Northwest. Credit: PO.DAAC/NASA

I’m also helping the field campaign with science communication through my role as communications coordinator for the Plankton, Aerosol, Cloud, ocean Ecosystem (PACE) Project – NASA’s first hyperspectral ocean color satellite. In conjunction with our hosts at the Schmidt Ocean Institute, we’re planning news stories, blogs and events on social media such as a Facebook Live event on @NASAEarth, February 6, at 2pm EST. Data collected during this field campaign and several others (e.g. CORAL, NAAMES, KORUS-OC) will be used to improve products derived from satellite measurements.

How am I feeling? Ready for this adventure and extremely grateful to the Schmidt Ocean Institute for sponsoring this research, to the scientists who wrote the proposal that was selected for this expedition, especially Ivona Cetinic, the chief scientist, who invited me to participate, and to my family for enabling me to take this month-long trip. Mostly though, I’m grateful to live in a society that values scientific inquiry and exploration. The more we know about Earth and the dynamic processes that support life, the better we can predict and prepare.