December 21, 2018 – Satellite Sees Tropical Cyclone Cilida North of Mauritius
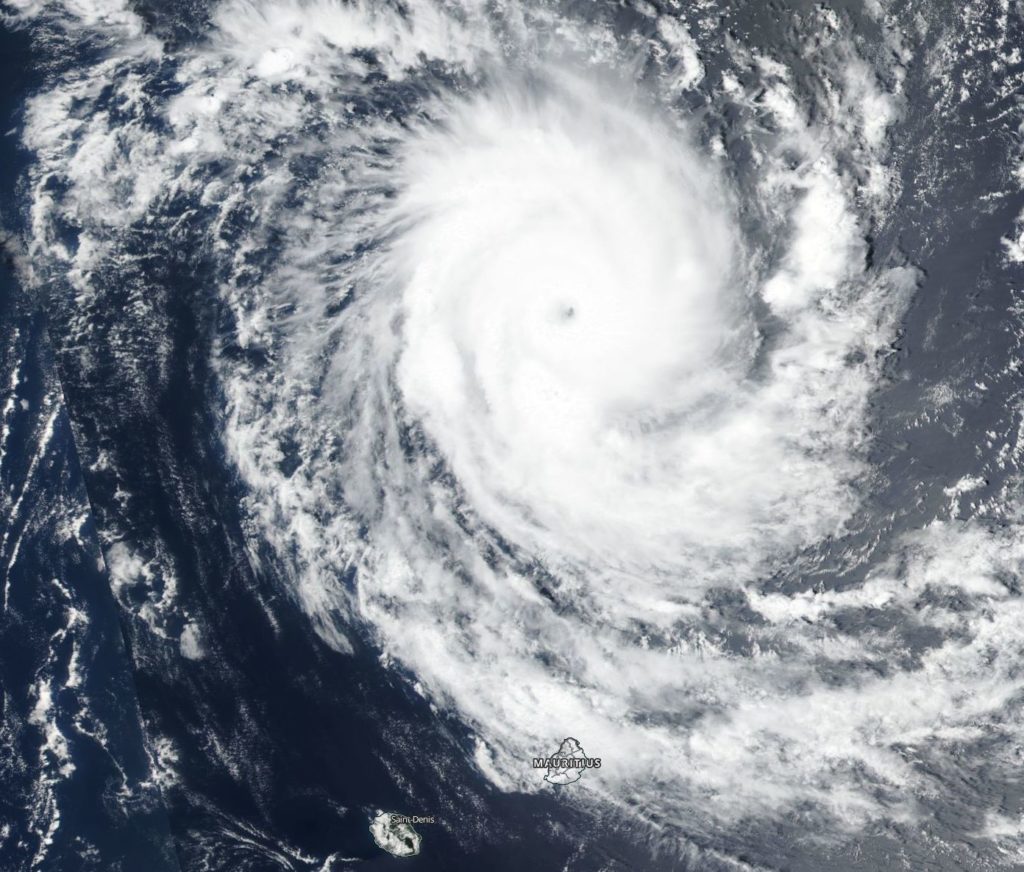
Tropical Cyclone Cilida appeared as a large and powerful hurricane on imagery from NASA-NOAA’s Suomi NPP satellite on Dec. 21. Cilida is located north of the island of Mauritius in the Southern Indian Ocean.
NASA-NOAA’s Suomi NPP satellite passed over the Southern Indian Ocean on Dec. 21 and captured a visible image of Tropical Cyclone Cilida north of the island of Mauritius. Credit: NASA Worldview, Earth Observing System Data and Information System (EOSDIS)
Mauritius has posted warnings for the approaching storm. A tropical cyclone warning Class 2 is in force in Mauritius, and a class 1 warning in Rodrigues.
Suomi NPP passed over Cilida on Dec. 21 and the VIIRS instrument provided a visible image. The VIIRS image showed Cilida continued to intensify rapidly. The VIIRS image showed an eye surrounded by powerful storms. The Joint Typhoon Warning Center or JTWC noted, satellite imagery shows the system continued to rapidly intensify as it maintained a 10 nautical mile wide eye and rain bands that wrapped tightly into the center.
At 10 a.m. EDT (1500 UTC) Tropical Cyclone Cilida was located near 15.1 degrees south latitude and 57.7 degrees east longitude. That’s about 301 nautical miles north of Port Louis, Mauritius. Cilida is moving to the south-southwest and has maximum sustained winds near 135 knots (155 mph/250 kph). Cilida is a Category 4 hurricane on the Saffir-Simpson Hurricane Wind Scale.
JTWC forecasters expect Cilida will move south, later southeast as it strengthens to 140 knots after today. Peak intensity will occur as the storm passes between Mauritius and Rodrigues Island. In four days, the storm should transition into an extra-tropical cyclone and rapidly weaken.
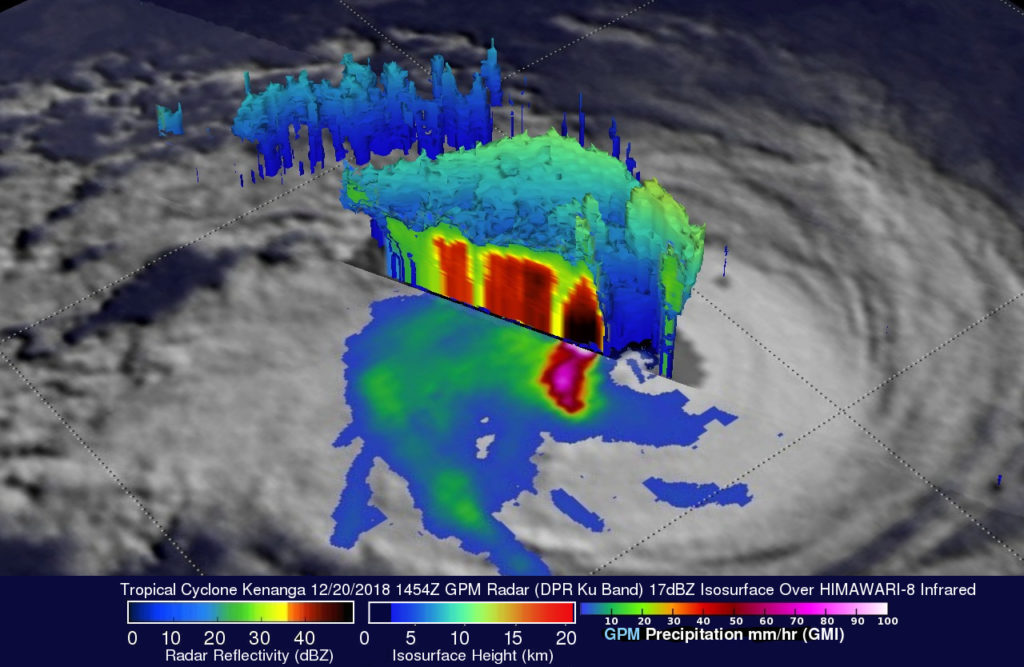
Tropical Cyclone Kenanga is now on a weakening trend and NASA’s GPM core satellite provided a look at the rainfall and cloud heights within the storm.
GPM observed powerful storms south of Kenanga’s center on Dec. 20, still producing very heavy rainfall at the rate of 214 mm (8.4 inches) per hour in that area. The rainfall in the northern half of the storm had decreased significantly. The storm tops of the eyewall which had remained intact on the western side of the cyclone were reaching heights of 12.7 km (7.9 miles). Credit: NASA/JAXA, Hal Pierce
On December 20, 2018, NASA’s Global Precipitation Measurement mission or GPM core observatory satellite passed over the Tropical Cyclone Kenanga and captured the storm beginning to weaken as predicted. The GPM satellite had an excellent view of the Kenanga when the tropical cyclone’s maximum sustained winds were at 90 knots (103.5 mph). GPM’s pass showed the eye of the storm, visible the day before, had since filled in.
GPM’s instruments including the Microwave Imager (GMI) and the Dual-Frequency Precipitation Radar (DPR) revealed that the powerful storms south of Kenanga’s center are still producing very heavy rainfall at the rate of 214 mm (8.4 inches) per hour in that area. The rainfall in the northern half of the storm had decreased significantly. This GPM 3-D view of Kenanga is looking southwest and was derived by the DPR Ku Band of the radar on the satellite. It showed extremely powerful storms south of Kenanga’s deteriorating eye were returning very strong reflectivity values which help to map the severity of the storm and the rainfall totals. The storm tops of the eyewall which had remained intact on the western side of the cyclone were reaching heights of 12.7 km (7.9 miles).
GPM is a joint mission between NASA and the Japan Aerospace Exploration Agency, JAXA.
On Dec. 21 at 10 a.m. EST (1500 UTC) Tropical Cyclone Kenanga was located approximately 672 nautical miles southeast of Diego Garcia and has tracked westward. Maximum sustained winds dropped to 60 knots (69 mpg/111 kph), so it is now a tropical storm.
The Joint Typhoon Warning Center predicts that Kenanga will continue to weaken rapidly as the dry air within the storm gets colder and heavier causing downdrafts. It is the dry air higher aloft that contributes to stronger convective wind gusts and therefore stronger storms. Kenanga is forecast to dissipate in the next 72 hours as it tracks within the northeast periphery of Tropical Cyclone Cilida.
December 20, 2018 – Seeing Double: Tropical Cyclone Kenanga Same Strength as Other Storm
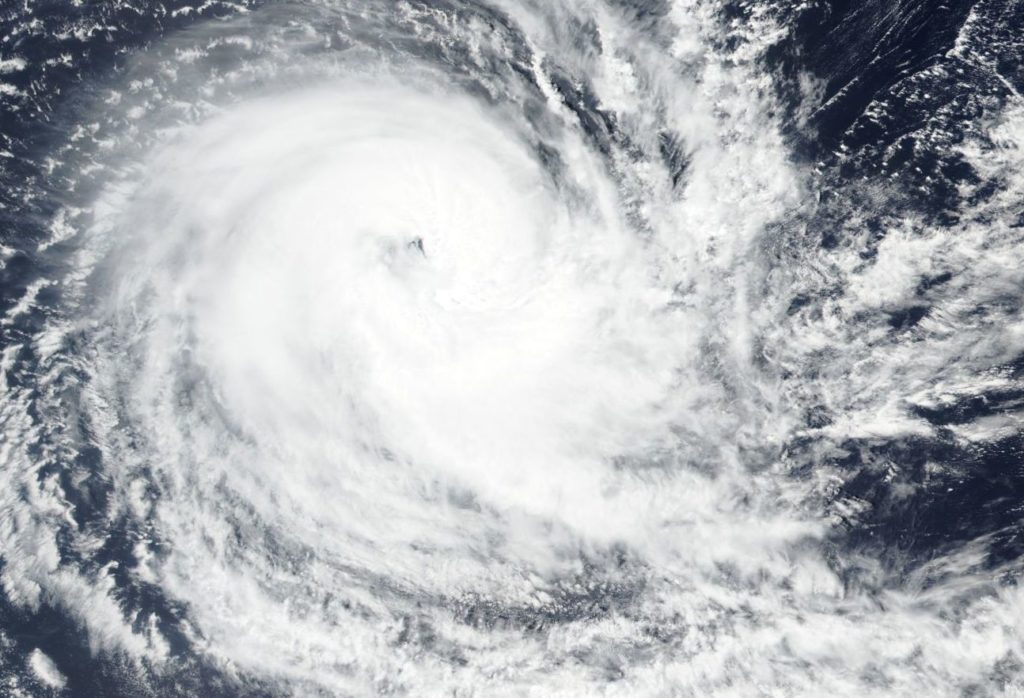
The Southern Indian Ocean is seeing double. Tropical Cyclone Kenanga was one of two storms at Category 2 hurricane strength in the Southern Indian Ocean on Dec. 20. Kenanga was sporting an eye on visible imagery from NASA-NOAA’s Suomi NPP satellite, and so was Tropical Cyclone Cilida, located west of Kenanga.
On Dec. 20, the VIIRS instrument aboard NASA-NOAA’s Suomi NPP satellite captured a visible image of Tropical Cyclone Kenanga in the Southern Indian Ocean. Kenaga is located east of Tropical Cyclone Cilida. Credit: NASA Worldview, Earth Observing System Data and Information System (EOSDIS)
On Dec. 20, 2018 the Visible Infrared Imaging Radiometer Suite (VIIRS) instrument aboard NASA-NOAA’s Suomi NPP satellite showed a powerful thunderstorms circling Kenanga’s eye.
The Joint Typhoon Warning Center or JTWC noted that after the Suomi NPP image was taken, infrared imagery showed the loss of the eye and the erosion of the eyewall (powerful thunderstorms circling the open center).
Kenanga and Cilida are both Category 2 hurricanes on the Saffir-Simpson Hurricane Wind Scale, and both have maximum sustained winds near 90 knots (103.6 mph/166.7 kph) on Dec. 20 at 10 a.m. EDT (1500 UTC). Strongest storms appeared northwest of the eye.
Kenanga was located near 16.6 degrees south latitude and 81.2 degrees east longitude, approximately 773 nautical miles southeast of Diego Garcia. Kenanga was moving west.
The JTWC forecast calls for Kenanga to steadily weaken, and that will continue under the ongoing influence of moderate to strong vertical wind shear and passage over cooler water. The storm is expected to dissipate below 35 knots (40 mph/74 kph) in 5 days.
December 20, 2018 – NASA-NOAA Satellite Catches the Eye of Rapidly Intensifying Tropical Cyclone Cilida
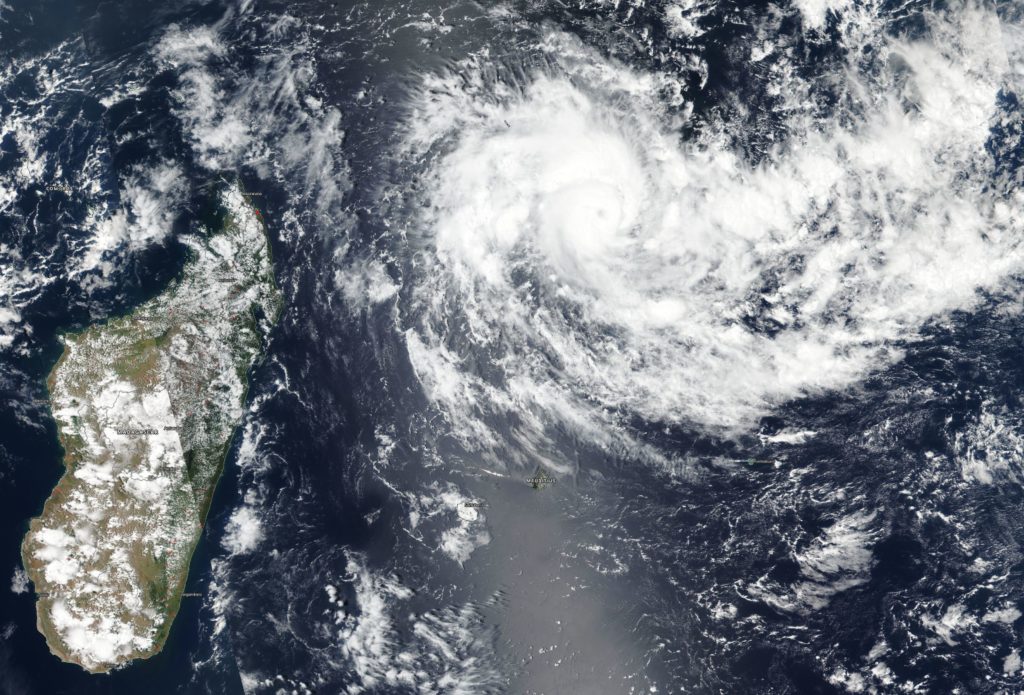
Tropical Cyclone Cilida appeared much more organized on satellite imagery as it moved across the southwestern Indian Ocean and continued to rapidly intensify. NASA-NOAA’s Suomi NPP satellite captured a visible image of Cilida that showed a cloud-covered eye.
On Dec. 20, the VIIRS instrument aboard NASA-NOAA’s Suomi NPP satellite captured a visible image of Tropical Cyclone Cilida in the Southwestern Indian Ocean, northeast of Madagascar (left in the image). Credit: NASA Worldview, Earth Observing System Data and Information System (EOSDIS)
On Dec. 20, 2018 the Visible Infrared Imaging Radiometer Suite (VIIRS) instrument aboard NASA-NOAA’s Suomi NPP satellite showed a powerful thunderstorms circling Cilida’s 18 nautical mile wide eye and extending in bands northwest and southeast of the center. The VIIRS imagery revealed a cloud-covered eye as the storm reached hurricane-strength.
The Joint Typhoon Warning Center noted that Cilida had intensified rapidly, by 55 knots (63 mph/102 kph) in 24 hours. Rapid intensification is expected to continue in the near term as warm sea surface temperatures and light outside winds remain. However, Cilida is expected to run into increasing vertical wind shear (which can weaken a storm) ahead of a developing mid-latitude trough or elongated area of low pressure.
On Dec. 20 at 10 a.m. EDT (1500 UTC) Cilida’s maximum sustained winds had reached 90 knots (103.6 mph/166.7 kph). Cilida is currently a Category 2 hurricane on the Saffir-Simpson Hurricane Wind Scale. It was located near 13.4 degrees south latitude and 58.9 degrees east longitude, approximately 427 nautical miles north-northeast of Port Louis, Mauritius. Cilida was moving southwestward and was undergoing rapid intensification.
Cilida is expected to pass to the east of Mauritius over Dec. 22 and 23 as it curves toward the southeast. In three to five days, Cilida is expected to undergo extratropical transition as it merges with the trough of low pressure.
December 19, 2018 – NASA Analyzes Newly Formed Tropical Cyclone Cilida
An infrared look by NASA’s Aqua satellite revealed where the strongest storms were located within recently formed Tropical Cyclone Cilida. Cilida formed in the Southern Indian Ocean on Dec. 18.
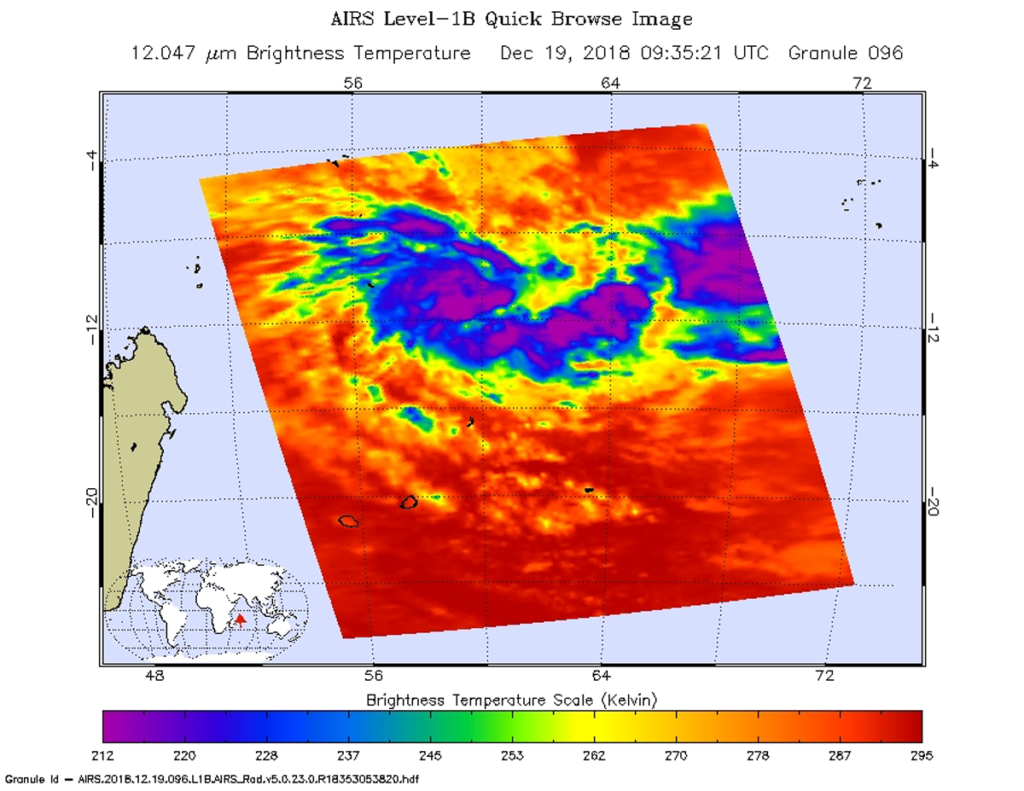
On Dec. 19 at 4:35 a.m. EDT (0935 UTC) the AIRS instrument aboard NASA’s Aqua satellite analyzed cloud top temperatures of Tropical Cyclone Cilida in infrared light. AIRS found cloud top temperatures of strongest thunderstorms were south of the center. Coldest temperatures were as cold as or colder than minus 63 degrees Fahrenheit (minus 53 degrees Celsius). Credit: NRL/NASA
On Dec. 19 at 4:35 a.m. EDT (0935 UTC) the Atmospheric Infrared Sounder or AIRS instrument aboard NASA’s Aqua satellite analyzed cloud top temperatures of Tropical Cyclone Cilida in infrared light. AIRS found cloud top temperatures of strongest thunderstorms were south of the center. Coldest temperatures were as cold as or colder than minus 63 degrees Fahrenheit (minus 53 degrees Celsius). Cloud top temperatures that cold indicate strong storms that have the capability to create heavy rain.
Satellite imagery shows a consolidating system with a weak and partially exposed low level circulation. The Joint Typhoon Warning Center noted that “fragmented formative rain bands are spiraling in mostly from the east.”
On Dec. 19 at 10 a.m. EST (1500 UTC), the center of Tropical Cyclone Cilida was located near latitude 11.6 degrees south and longitude 60.6 degrees east. That’s about 544 nautical miles north-northeast of Port Louis, Mauritius. Cilida is moving to the south-southwest. Maximum sustained winds were near 35 knots (40 mph/65 kph).
Threatened landmasses include St. Brandon, Mauritius, and Rodrigues Island as Cilida is forecast to move southwest, and later southeast as it strengthens to 95 knots (109 mph/175 kph) after 4 days. The Joint Typhoon Warning Center expects Cilida to pass to the east of Mauritius on Dec. 22.
December 19, 2018 – NASA Finds Extreme Rainfall in Tropical Cyclone Kenanga
NASA found very cold cloud top temperatures within the Southern Indian Ocean’s Tropical Cyclone Kenanga that indicate powerful thunderstorms reaching high into the troposphere. Those storms were generating very heavy rainfall as confirmed by the Global Precipitation Measurement mission or GPM core satellite.
On Dec. 18, the GPM satellite found extreme rainfall in Kenanga’s well-defined circular eyewall. Heaviest rainfall was found by GPM in the tropical cyclone’s southeastern quadrant, falling at a rate of over 161 mm (6.3 inches) per hour on that side of the tropical cyclone. Credit: NASA/JAXA, Hal Pierce
On December 18, 2018 at 10:04 a.m. EST (1504 UTC) the GPM core observatory satellite flew above powerful Tropical Cyclone Kenanga in the southwestern Indian Ocean. Tropical Cyclone Kenanga’s most distinctive feature was its large eye. At the time of the GPM pass Kenanga’s maximum sustained wind speeds were about 90 knots (104 mph).
At NASA’s Goddard Space Flight Center in Greenbelt, Maryland, an analysis of the tropical cyclone’s rainfall was derived from data collected by GPM’s Microwave Imager (GMI) and GPM’s Dual-Frequency Precipitation Radar (DPR) instruments. GPM clearly showed the extreme rainfall in Kenanga’s well-defined circular eyewall. The heaviest rainfall was found by GPM in the tropical cyclone’s southeastern quadrant. GPM’s radar (DPR Ku Band) measured precipitation there falling at a rate of over 161 mm (6.3 inches) per hour on that side of the tropical cyclone.
On Dec. 19 at 2:53 a.m. EST (0753 UTC) the AIRS instrument aboard NASA’s Aqua satellite captured temperature data from Tropical Cyclone Kenanga, using infrared light. The most powerful storms, with coldest cloud top temperatures appeared in purple around the eye. Credit: NASA/JPL, Heidar Thrastarson
A 3-D view of the storm was created at Goddard that showed the estimated relative heights of storms within tropical cyclone Kenanga. Those heights are based on measurements by the GPM satellite’s radar (DPR Ku Band) blended with estimates from Japan’s HIMAWARI-8 satellite’s infrared temperatures. GPM’s radar probes of Kenanga’s eastern side indicated that storm tops in that part of the tropical cyclone were reaching heights above 12.2 km (7.6 miles). GPM is a joint mission between NASA and the Japan Aerospace Exploration Agency, JAXA.
On Dec. 19 at 2:53 a.m. EST (0753 UTC) the Atmospheric Infrared Sounder or AIRS instrument aboard NASA’s Aqua satellite captured temperature data from Tropical Cyclone Kenanga, using infrared light. The most powerful storms, with coldest cloud top temperatures appeared around the eye and were colder than minus 63 degrees Fahrenheit (minus 53 degrees Celsius). Satellite data showed that the eye is about 25 nautical miles in diameter and that the southern side of the storm appeared to be elongating, a sign of weakening.
On Dec. 18, the GPM satellite found extreme rainfall in Kenanga’s well-defined circular eyewall. Heaviest rainfall was found by GPM in the tropical cyclone’s southeastern quadrant, falling at a rate of over 161 mm (6.3 inches) per hour on that side of the tropical cyclone. GPM’s radar probes of Kenanga’s eastern side indicated that storm tops in that part of the tropical cyclone were reaching heights above 12.2 km (7.6 miles). Credit: NASA/JAXA, Hal Pierce
On Dec. 19 at 10 a.m. EST (1500 UTC), Kenanga’s wind speeds peaked at about 115 knots (132 mph/213 kph). It was centered near 16.6 degrees south latitude and 82.1 degrees east longitude. That’s approximately 805 nautical miles southeast of Diego Garcia. Kenanga has tracked southwestward.
Kenanga is now expected to gradually weaken as the tropical cyclone moves toward the southwest over progressively cooler sea surface temperature.
December 18, 2018 – NASA-NOAA Satellite Tracking Tropical Cyclone Kenanga
Tropical Cyclone Kenanga was at hurricane-force when NASA-NOAA’s Suomi NPP satellite grabbed a visible image of the storm in the Southern Indian Ocean on Dec. 18.
On Dec. 18 the VIIRS instrument aboard NASA-NOAA’s Suomi NPP satellite captured a visible image of Tropical Cyclone Kenanga moving through the Southern Indian Ocean. Credit: NASA Worldview, Earth Observing System Data and Information System (EOSDIS)
On Dec. 18, the Visible Infrared Imaging Radiometer Suite (VIIRS) instrument aboard NASA-NOAA’s Suomi NPP satellite captured visible image of Tropical Cyclone Kenanga in the Southern Indian Ocean. The image showed the eye was covered by high clouds and was surrounded by bands of powerful thunderstorms. The image appeared like a backwards comma, with a large, thick band of thunderstorms extending from the southern quadrant to the east.
The VIIRS image was created at NASA’s Goddard Space Flight Center in Greenbelt, Maryland, using NASA’s Earth Observing System Data and Information System (EOSDIS) Worldview. The Worldview application provides the capability to interactively browse over 700 global, full-resolution satellite imagery layers and then download the underlying data. Many of the available imagery layers are updated within three hours of observation, essentially showing the entire Earth as it looks “right now.”
At 10 a.m. EST (1500 UTC) the eye of Tropical Cyclone Kenanga was located near latitude 14.8 degrees south and longitude 83.7 degrees east. That’s about 805 miles southeast of Diego Garcia. Kenanga was moving southwest. Maximum sustained winds were near 90 knots (103.6 mph/166.7 kph) and Kenanga is expected to strengthen slightly before embarking on a weakening trend on Dec. 20.
December 17, 2018 – NASA’s Aqua and GPM Satellites Examine Tropical Cyclone Kenanga
On December 16 and 17, NASA’s GPM core observatory satellite and NASA’s Aqua satellite, respectively, passed over the Southern Indian Ocean and captured rainfall and temperature data on Tropical Cyclone Kenanga.
The GPM core satellite found that a powerful storm northeast of Kenanga’s center of circulation was dropping rain at a rate of over 119 mm (4.7 inches) per hour. Credit: NASA /JAXA, Hal Pierce
Kenanga formed on Dec. 15 about 1,116 miles east of Diego Garcia, and strengthened into a tropical storm.
When the Global Precipitation Measurement mission or GPM core satellite passed overhead, the rainfall rates it gathered were derived from the satellite’s Microwave Imager (GMI) instrument. GPM provided a close-up analysis of rainfall around tropical cyclone Kenanga. Data from GPM’s microwave Imager (GMI) and Dual-Frequency Precipitation Radar (DPR) were used in this analysis. DPR found that a powerful storm northeast of Kenanga’s center of circulation was dropping rain at a rate of over 119 mm (4.7 inches) per hour.
At NASA’s Goddard Space Flight Center in Greenbelt, Maryland, imagery and animations were created using GPM data. A 3-D animation used GPM’s radar to show the structure of precipitation within tropical Cyclone Kenanga. The simulated flyby around Kenanga showed storm tops that were reaching heights above 13.5 km (8.4 miles). GPM is a joint mission between NASA and the Japanese space agency JAXA.
On Dec. 17 at 3:05 a.m. EST (0805 UTC), NASA’s Aqua satellite provided an infrared look at Tropical Cyclone Kenanga. Coldest cloud top temperatures (in purple) indicated where strongest storms appeared. Credit: NASA JPL/Heidar Thrastarson
On Dec. 17 at 3:05 a.m. EST (0805 UTC), the AIRS or Atmospheric Infrared Sounder instrument aboard NASA’s Aqua satellite provided an infrared look at Tropical Cyclone Kenanga. Coldest cloud top temperatures were near 63 degrees Fahrenheit (53 degrees Celsius) and indicated where strongest storms appeared. The Joint Typhoon Warning Center or JTWC noted “animated enhanced infrared satellite imagery depicts a central dense overcast feature with a formative eye. Another image shows a compact system with curved banding wrapping into an oblong microwave eye feature.”
On Dec. 17 at 10 a.m. EST (1500 UTC), maximum sustained winds were near 60 knots. Kenanga was centered near 12.8 degrees south latitude and 86.0 degrees east longitude, approximately 885 nautical miles east-southeast of Diego Garcia. Kenanga has tracked west-southwestward.
A 3-D animation used GPM’s radar to show the structure of precipitation within tropical cyclone Kenanga. This simulated flyby around Kenanga shows storm tops that were reaching heights above 13.5 km (8.4 miles). The GPM core satellite found that a powerful storm northeast of Kenanga’s center of circulation was dropping rain at a rate of over 119 mm (4.7 inches) per hour. Credit: NASA /JAXA, Hal Pierce
JTWC forecasters expect Kenanga to continue strengthening for the next two days and then conditions will deteriorate. After three days the storm is forecast to begin weakening as it interacts with cooler, drier air.
December 17, 2018 – NASA Catches India Landfall of Tropical Depression Phethai
NASA’s Aqua satellite passed over the Northwestern Indian Ocean and captured a visible image of Tropical Depression Phethai after it made landfall in southeastern India.
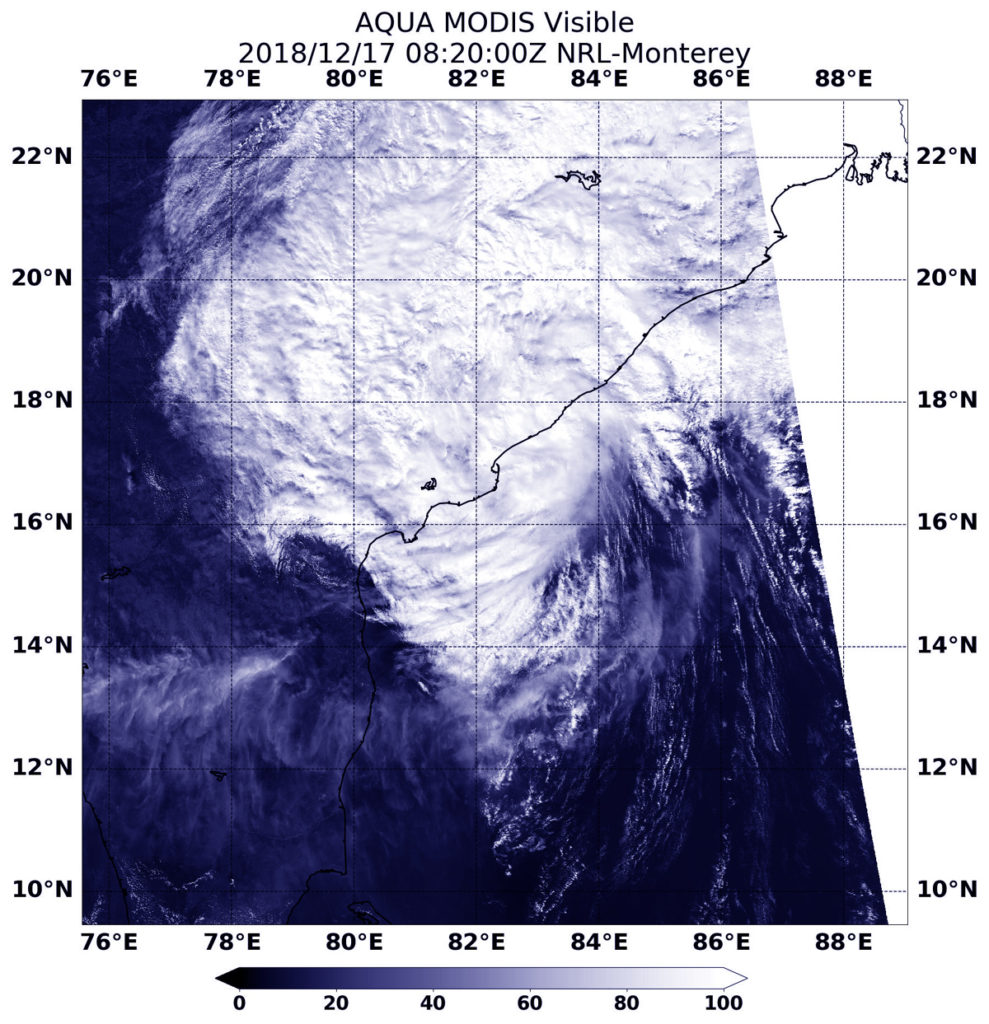
On Dec. 17 at 3:20 a.m. EST (0820 UTC) the MODIS instrument aboard NASA’s Aqua satellite looked at Tropical Depression Phethai after it made landfall south of Visakhapatnam in southeastern India. Credit: NASA/NRL
Phethai developed on Dec. 15 as tropical cyclone 08B, about 450 miles south-southeast of Visakhapatnam, India. Phethai made landfall early on Dec. 17 south of the city of Visakhapatnam, in the Indian state of Andhra Pradesh, on the Bay of Bengal.
On Dec. 17 at 3:20 a.m. EST (0820 UTC) the MODIS instrument aboard NASA’s Aqua satellite looked at Tropical Depression Phethai after it made landfall south of Visakhapatnam. Satellite imagery showed that the bulk of clouds and showers were north and east of the center of circulation indicating that wind shear was affecting the storm.
In general, wind shear is a measure of how the speed and direction of winds change with altitude. Wind shear can tear a tropical cyclone apart or weaken it.
On Dec. 17 at 10 a.m. EST (1500 UTC) the Joint Typhoon Warning Center noted that Phethai had maximum sustained winds near 30 knots (34.5 mph/55.5 kph). It was centered near 17.7 degrees north latitude and 82.4 east longitude, about 65 nautical miles west-southwest of Visakhapatnam, India. Phethai has tracked northward.
Phethai is forecast to move on a north-northeasterly track over land and rapidly weaken.
December 17, 2018 – NASA Finds Tiny Remnants of Tropical Cyclone Owen
Tropical Cyclone Owen crossed over Queensland Australia’s Cape York Peninsula over the weekend of Dec. 15 and 16 and emerged into the Coral Sea off of Queensland’s southeastern coast. NASA’s Terra satellite provided an infrared image of the remnants and found two very small areas of strong thunderstorms.
NASA’s Terra satellite captured an infrared image of the remnants of Tropical Cyclone Owen on Dec. 17 at 7:35 a.m. EST (1235 UTC). The image revealed two very small patches of strong thunderstorms where cloud top temperatures were as cold as minus 63 degrees Fahrenheit (minus 53 Celsius). Credit: NASA/NRL
The Moderate Resolution Imaging Spectroradiometer or MODIS instrument aboard NASA’s Terra satellite captured an infrared image of the remnants of Tropical Cyclone Owen on Dec. 17 at 7:35 a.m. EST (1235 UTC). The image revealed a very small patch of strong thunderstorms where cloud top temperatures were as cold as minus 63 degrees Fahrenheit (minus 53 Celsius).
Infrared data provides temperature information. That small patch of strongest thunderstorms had cloud top temperatures as cold as minus 63 degrees Fahrenheit (minus 53 Celsius). NASA research has shown that cloud tops with temperatures that cold were high in the troposphere and have the ability to generate heavy rain.
Owen’s remnants are expected to dissipate within a day or two.