NASA Aids Disaster Response after Eta and Iota Hit Central America

Nov. 19, 2020 – NASA Aids Disaster Response after Eta and Iota Hit Central America

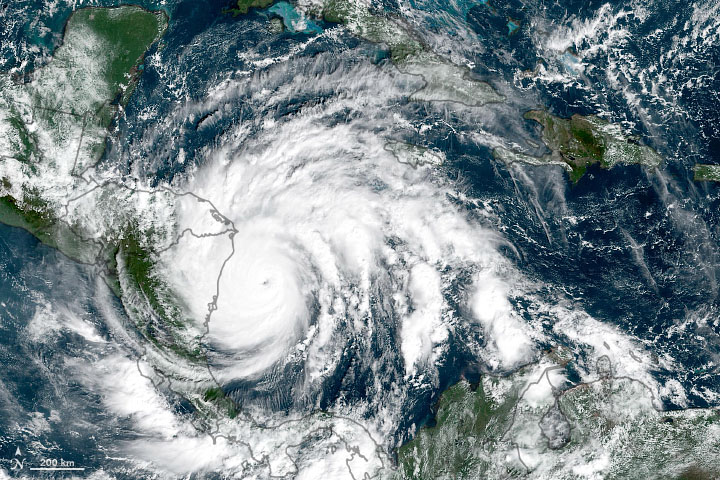
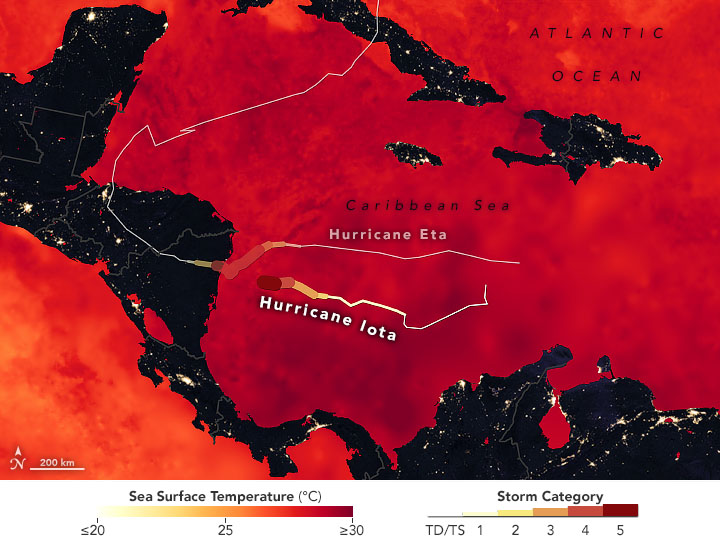
With up to 155-mph winds, Hurricane Iota smashed record books on Nov. 16 as the strongest hurricane ever recorded to make landfall in Nicaragua. Iota reached Category 5 strength before making landfall as a Category 4 storm near the town of Haulover, Nicaragua.

The onslaught of destructive winds and heavy rainfall was unfortunately familiar to a region that recently suffered another Category 4 landfalling storm – Hurricane Eta – just two weeks earlier. Eta was a Category 4 storm with 140-mph winds when it landed in Nicaragua on Nov. 3 before ripping a wide path of destruction through Honduras and Guatemala.

Heavy rainfall from these two storm systems brought widespread flooding to the region, triggered large and numerous landslides in Guatemala and Honduras, and was responsible for numerous casualties.

NASA’s Earth Applied Sciences Disasters Program supports disaster response and risk reduction efforts throughout the world — before, during, and after disasters strike – and is working to aid Central America with the impacts from these storms.

In the case of Eta and Iota, the Program is using imagery and data from Earth-observing satellites to provide scientific analysis to Guatemala’s National Coordinator for Disaster Reduction and is working with the Coordination Center for Disaster Prevention in Central America. The multi-agency collaboration is assisting local governments in Nicaragua, Honduras and Guatemala, El Salvador, Belize, Costa Rica, and Panama. The Program is also working with U.S. Southern Command to provide situational awareness for potential emergency humanitarian assistance.

Interactive map

Click to visit interactive map

The interactive map above shows some highlights of key data products the Disasters Program is using. Specifically, the Program is sharing products such as those (and others in the NASA Disasters Mapping Portal) in frequent coordination meetings to help quantify flood and landslide risk in the region.

One example is the landslide detection maps from the Semi-Automatic Landslide Detection (SALaD) project, which use machine learning to analyze data from commercial Planet Labs satellites and the European Space Agency (ESA) Copernicus Sentinel-2 satellite. ESA Sentinel-2 data was also used to detect likely flooded areas at Honduras’ San Pedro Sula airport.  The Program can take the landslide and flood detection data, then combine it with openly available population data and road maps, and deliver actionable guidance to local decision makers on where to best direct their response efforts.

Learn more about how NASA is aiding response efforts for Eta and Iota

By Jacob Reed
NASA Goddard Space Flight Center

Iota – Atlantic Ocean

Nov. 17, 2020 – Dangerous Hurricane Iota Sets Late-Season Records

Less than two weeks after being hit by category 4 Hurricane Eta, several Central American countries braced for the arrival of category 5 Hurricane Iota. NASA and NOAA covered the storm with an array of Earth-observing instruments.

GOES image of Iota
The National Oceanic and Atmospheric Administration (NOAA) GOES-16 satellite (one of many geostationary NOAA satellites developed and launched by NASA) captured a natural-color image on Nov. 16 at 10 a.m. local time when the storm was at its peak strength. Iota’s eye was visible and surrounded by powerful thunderstorms. Credit: NOAA/NESDIS, Joshua Stevens, NASA Earth Observatory

Iota is the strongest hurricane and 30th named storm of the 2020 Atlantic season, the most since modern record keeping began (breaking the previous record of 28 set in 2005.) It also marked the first time that two hurricanes have formed in the Atlantic in any November. Iota is the 13th storm to reach hurricane strength this year; the average hurricane year brings six hurricanes.

On November 16 at 1 p.m. EDT, NOAA’s National Hurricane Center (NHC) issued hurricane warnings for large portions of coastal Nicaragua and Honduras as the storm approached landfall. Iota had strengthened to a category 5 storm with sustained winds of 260 kilometers (160 miles) per hour.

Iota made landfall at 10:40 p.m. EDT as a Category 4 hurricane with maximum sustained winds near 155 mph (250 kph) along the northeastern coast of Nicaragua near the town of Haulover, about 30 miles (45 km) south of Puerto Cabezas. Hurricane Iota’s landfall location was approximately 15 miles (25 km) south of where Category 4 Hurricane Eta made landfall on November 3.

The National Oceanic and Atmospheric Administration (NOAA) GOES-16 satellite (one of many geostationary NOAA satellites developed and launched by NASA) captured a natural-color image on Nov. 16 at 10 a.m. local time when the storm was at its peak strength. Iota’s eye was visible and surrounded by powerful thunderstorms.

This map shows sea surface temperatures on Nov. 15,
This map shows sea surface temperatures on Nov. 15 near or above 27° Celsius/80.6 Fahrenheit (deep orange and red) in the Caribbean Sea and Gulf of Mexico. The warm water provided the fuel for both Hurricane Iota and Hurricane Eta (tracks overlaid on the map). Credit: NASA JPL MUR SST/Joshua Stevens, NASA’s Earth Observatory

Iota developed on Nov. 13 and strengthened to a hurricane two days later. Iota rapidly intensified in the warm waters of the Caribbean Sea. Within a day and a half, Iota’s wind speeds increased by 160 kilometers (100 miles) per hour.

Ocean temperatures must be near or above 27° Celsius (80.6 Fahrenheit) to sustain a tropical cyclone. Using data from NASA’s Multiscale Ultrahigh Resolution Sea Surface Temperature (MUR SST) project, NASA created a temperature map that showed sea surfaces in the Caribbean Sea and Gulf of Mexico at least that warm or warmer, which allowed for support and strengthening Hurricanes Iota and Eta. MUR incorporates temperature data from multiple NASA, NOAA, and international satellites, as well as ship and buoy observations.

By Michael Carlowicz, with scientific interpretation from Timothy Hall of the NASA Goddard Institute for Space Studies. For a more detailed version of this story, check out NASA’s Earth Observatory website.

Eta – Atlantic Ocean

NASA/JAXA GPM Satellite Eyes Eta Over Nicaragua


Hurricane Eta (a Category 1) over Nicaragua on 11/4/2020 at approximately 5:25Z. This visualization focuses on the high precipitation southwest of Eta’s eye. Credit: NASA’s Scientific Visualization Studio

The Global Precipitation Measurement (GPM) Core Observatory satellite flew over Hurricane Eta at 11:41 p.m. CT on Tuesday, Nov. 3 (0541 UTC Wednesday, Nov. 4). GPM observed the storm’s rainfall with its two unique science instruments: the GPM Microwave Imager (GMI) and Dual-frequency Precipitation Radar (DPR). As the visualization shows, the instruments observed a large swath of heavy precipitation extending to the north and east of the hurricane’s center, which matched earlier forecasts that called for particularly heavy rainfall across the storm’s path.
These two- and three-dimensional observations of precipitation structure are the hallmark of the GPM mission – managed jointly by NASA and the Japan Aerospace Exploration Agency (JAXA) — which aims improve our understanding of the water cycle and extreme weather events, and contributes to improved climate modeling and weather forecasting around the world.

These visualizations depict the GPM satellite pass about seven hours after Hurricane Eta made landfall on the coast of Nicaragua as a category 4 storm. Current NHC forecasts indicate Eta will move northwest over Central America then head northeast across the Caribbean Sea, threatening Cuba and Florida early next week.

Eta is the 28th named storm of 2020 which beats the 2005 record for the most named storms in a single hurricane season. (See 27 Storms: Arlene to Zeta for a summary of the 2005 hurricane season).

GPM data is archived at https://pps.gsfc.nasa.gov/


Hurricane Eta (a Category 1) on 11/4/2020 at approximately 5:25Z. This visualization focuses on the disperse outer bands northeast of the eye. Credit: NASA’s Scientific Visualization Studio

Color bar for frozen precipitation rates (ie, snow rates). Shades of cyan represent low amounts of frozen precipitation, whereas shades of purple represent high amounts of precipitation.
Color bar for liquid precipitation rates (ie, rain rates). Shades of green represent low amounts of liquid precipitation, whereas shades of red represent high amounts of precipitation.

By Alex Kekesi
NASA’s Goddard Space Flight Center