Alvin (Eastern Pacific Ocean)

June 28, 2019 – NASA Satellite Takes Tropical Storm Alvin’s Temperature    

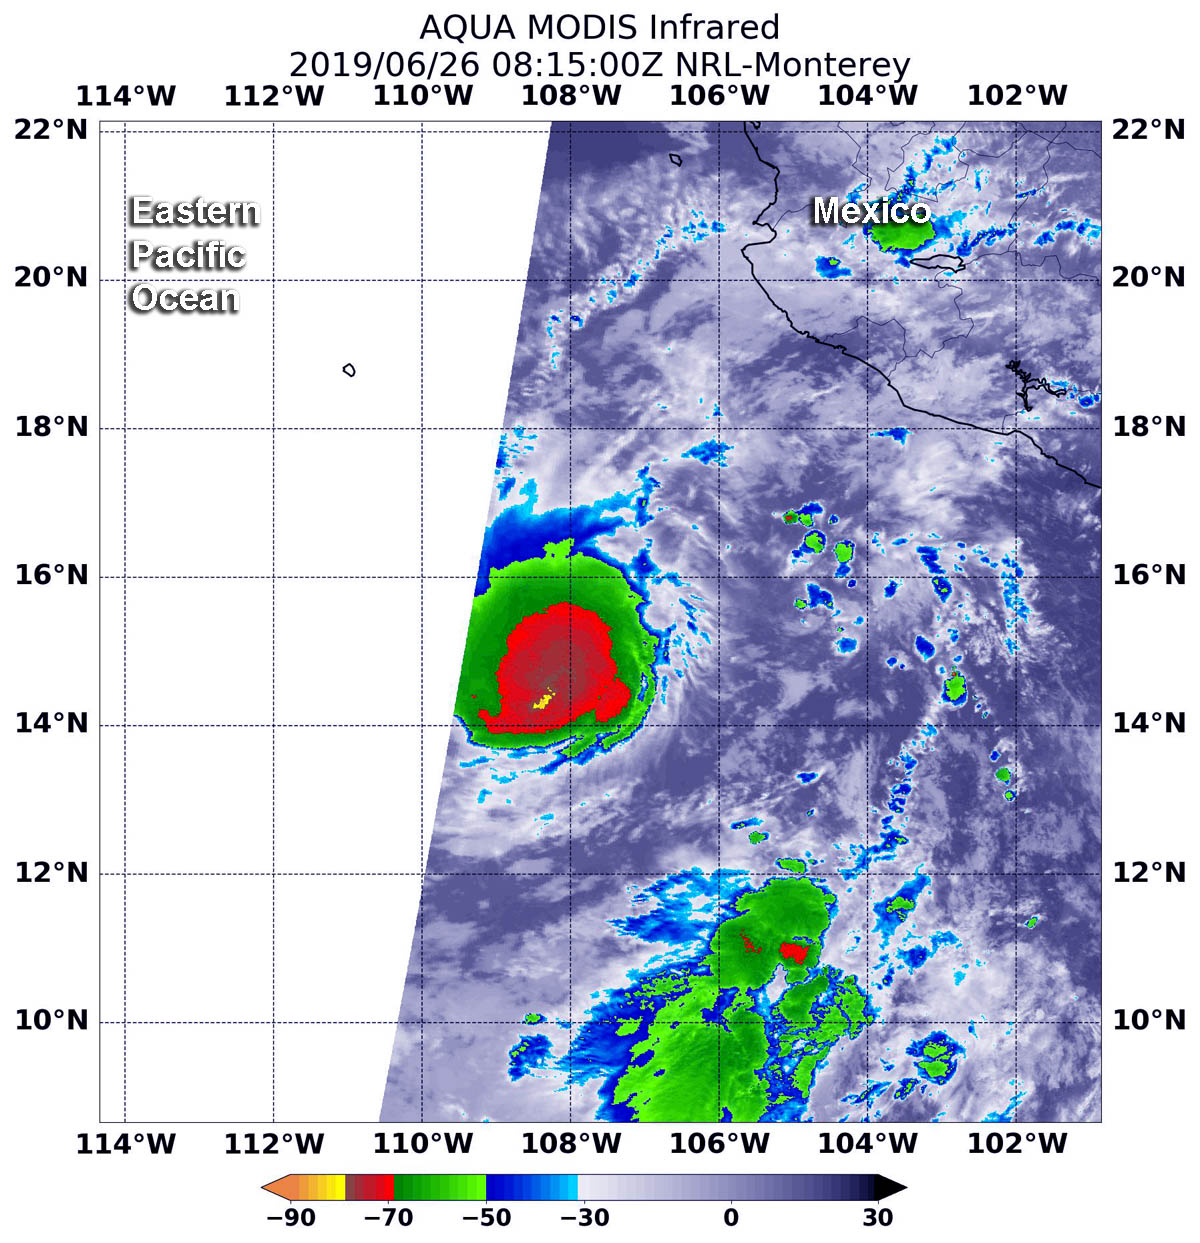
Cloud top temperatures are an indication of strength of tropical cyclones. The colder the cloud tops, the higher they extend in the troposphere, and colder temperatures typically indicate stronger storms. NASA’s Aqua satellite peered into Tropical Storm Alvin with infrared light to determine if the storm was intensifying.

NASA’s Aqua satellite provided an infrared picture of Tropical Storm Alvin’s cloud top temperatures on June 27 at 4:59 a.m. EDT (0859 UTC). Strongest storms with coldest cloud tops appear in purple and have temperatures as cold as or colder than minus 63 Fahrenheit (minus 53 Celsius). Credit: NASA JPL, Heidar Thrastarson

The Atmospheric Infrared Sounder or AIRS instrument aboard NASA’s Aqua satellite passed over Tropical Storm Alvin and analyzed the storm in infrared light. Infrared light provides scientists with temperature data and that is important when trying to understand the strength of the thunderstorms that make up a tropical cyclone. The higher the cloud tops, the colder and the stronger they are. So infrared light as that gathered by the AIRS instrument can identify the strongest sides of a tropical cyclone.

NASA’s Aqua satellite flew over Alvin on June 27 at 4:59 a.m. EDT (0859 UTC). AIRS detected strongest storms around the center with cloud top temperatures as cold as minus 63 degrees Fahrenheit (minus 53 degrees Celsius). Infrared data showed cloud top temperatures were getting colder, indicating stronger uplift of air, pushing those storms higher in the troposphere. Storms with cloud top temperatures that cold have the capability to produce heavy rainfall. The storm intensified over June 27 to early June 28 as winds increased from 60 to 70 mph (97 to 110 kph).

On June 28, NOAA’s National Hurricane Center forecaster Daniel Brown said, “Alvin’s satellite presentation has begun to degrade overnight with the overall cloud pattern becoming elongated from southwest to northeast. Southwesterly shear has caused the system to become less symmetric.”

Current Status of Alvin

At 5 a.m. EDT (0900 UTC) on Friday, June 28, 2019 the center of Tropical Storm Alvin was located near latitude 18.0 degrees north and longitude 116.3 degrees west. That puts the center of Alvin about 535 miles (860 km) southwest of the southern tip of Baja California, Mexico. Maximum sustained winds are near 70 mph (110 kph) with higher gusts.

Alvin is moving toward the northwest near 15 mph (24 kph), and a gradual turn toward the west-northwest with a decrease in forward speed is expected over the next couple of days. Alvin is expected to move into an area of cooler waters and where the southwesterly wind shear is forecast to increase. Those two factors are expected to cause rapid weakening during the next 24 to 36 hours.  Because Alvin is a small cyclone, it is likely to suffer from the effects of the hostile environment more quickly.

The National Hurricane Center expects Alvin to weaken over the next day or two, and Alvin is forecast to become a remnant low on Saturday and should dissipate soon thereafter.

For forecast updates on Tropical Storm Alvin, visit: www.nhc.noaa.gov

More information about AIRS can be found at: http://airs.jpl.nasa.gov

Rob Gutro
NASA’s Goddard Space Flight Center, Greenbelt, Md.

Alvin (Eastern Pacific Ocean)

June 27, 2019 – NASA’s Terra Satellite Eyes Tropical Storm Alvin

Visible imagery from NASA’s Terra satellite showed Tropical Storm Alvin had organized and strengthened into a strong tropical storm, just over 500 miles from Mexico’s Baja California peninsula.

On June 27, the Moderate Resolution Imaging Spectroradiometer or MODIS instrument aboard NASA’s Terra satellite provided a visible image of Alvin. Satellite imagery revealed that Alvin’s clouds appeared more organized than they did the previous day.

satellite image of Alvin
On June 27, 2019, the MODIS instrument aboard NASA’s Terra satellite provided a visible image of Tropical Cyclone Alvin, located over 500 miles west of Baja California, Mexico. Credit: NASA Worldview, Earth Observing System Data and Information System (EOSDIS)

Recent microwave imagery also showed that Alvin’s “convective structure,” or the development and organization of thunderstorms around the low-level center) has improved during the morning of June 27. AT 6:57 a.m. EDT (1057 UTC). The Special Sensor Microwave/Imager (SSM/I) instrument aboard Defense Meteorological Satellite Program satellite showed a closed ring of convection (clouds and storms) around the mid-level center of the small tropical storm. Infrared satellite imagery revealed that Alvin has not changed significantly.

NOAA’s National Hurricane Center (NHC) reported at 11 a.m. EDT (1500 UTC), the center of Tropical Storm Alvin was located near latitude 15.8 degrees north and longitude 113.1 degrees west. That’s about 535 miles (855 km) south-southwest of the southern tip of Baja California.

Maximum sustained winds are near 60 mph (95 kph) with higher gusts. Alvin is moving toward the west-northwest near 14 mph (22 kph), and this general motion is expected to continue for the next day or so. The estimated minimum central pressure is 999 millibars (29.50 inches).

Some strengthening is possible during the next 24 hours before Alvin reaches cooler waters.  Weakening is the expected to begin on Friday and the NHC said Alvin is forecast to become a remnant low on Saturday.

For updated forecasts, visit: www.nhc.noaa.gov

Rob Gutro
NASA’s Goddard Space Flight Center, Greenbelt, Md.

Alvin – Eastern Pacific Ocean

June 26, 2019 – NASA Analyzes Alvin, the First Eastern Pacific Tropical Storm

The Eastern Pacific Ocean has spawned its first tropical storm of the 2019 hurricane season, and NASA’s Aqua satellite measured the cloud top temperatures within to gauge its strength.

infrared image of Alvin
On June 26 at 4:15 a.m. EDT (0815 UTC), NASA’s Aqua satellite revealed cloud top temperatures in strongest storms were near Tropical Storm Alvin’s center of circulation. Those temperatures were as cold as or colder than minus 70 degrees (red) Fahrenheit (minus 56.6 degrees Celsius). Credit: NASA/NRL

Infrared satellite imagery provides temperature data, and when NASA’s Aqua satellite passed over the system it was still a depression, but showing powerful thunderstorm development. Cloud top temperatures determine strength of the thunderstorms that make up a tropical cyclone. The colder the cloud tops, the stronger the uplift in the storms that help thunderstorm development. Infrared data helps determine where the most powerful storms are within a tropical cyclone.

The Moderate Resolution Imaging Spectroradiometer or MODIS instrument aboard Aqua provided that infrared data on June 26 at 4:15 a.m. EDT (0815 UTC). The MODIS data showed the strongest thunderstorms were near the center of circulation. They were as cold as or colder than minus 70 degrees Fahrenheit (minus 56.6 degrees Celsius). NASA research indicates very cold cloud tops with the potential to generate very heavy rainfall.

Tropical Depression One-E strengthened into a tropical storm and named Alvin at 11 a.m. EDT (1500 UTC) on Wednesday, June 26, 2019. At that time, NOAA’s National Hurricane Center noted that the center of Tropical Storm Alvin was located near latitude 14.7 degrees north and longitude 109.4 degrees west. That puts Alvin far from land areas and about 450 miles (725 km) southwest of Manzanillo, Mexico. Alvin is also about 565 miles (915 km) south of the southern tip of Baja California. As a result, there are no coastal watches or warnings in effect.
Alvin is moving toward the west near 14 mph (22 kph) and the NHC expects a westward to west-northwestward motion with some decrease in forward speed over the next few days. Maximum sustained winds have increased to near 40 mph (65 kph) with higher gusts.

Some additional strengthening is forecast during the next day or so. Weakening is forecast to begin on Friday, and Alvin is expected to become a remnant low on Saturday.

For updated forecasts, visit: www.nhc.noaa.gov.

By Rob Gutro
NASA’s Goddard Space Flight Center, Greenbelt, Md.

Vayu (was 02A) – Northern Indian Ocean

June 17 Update – NASA-NOAA Satellite Finds Dry Air Affecting Tropical Cyclone Vayu

Tropical Cyclone Vayu was fading as it neared the coast of southwestern Pakistan and northwestern India. Dry air and wind shear were preventing development the development of thunderstorms, making the clouds on the storm’s western side appear wispy in an image from NASA-NOAA’s Suomi NPP satellite.

satellite image of Vayu
NASA-NOAA’s Suomi NPP satellite passed over the Arabian Sea on June 17 and saw the effects of dry air on Tropical Cyclone Vayu’s western quadrant where only wispy clouds were seen. Credit: NASA Worldview, Earth Observing System Data and Information System (EOSDIS).

The Visible Infrared Imaging Radiometer Suite (VIIRS) instrument aboard Suomi NPP provided a visible image of the storm on June 17, 2019. The VIIRS image showed that dry air that moved into the storm on the western side had prevented further development of the thunderstorms that make up a tropical cyclone. Clouds on that side of Vayu appeared wispy and were precipitation free. Thicker clouds were visible on Vayu’s eastern side where some had already spread over the coast of northwestern Indian near Naliya. Vayu is forecast to make landfall near Naliya later in the day.

On June 17 at 0300 UTC (June 16 at 11 p.m. EDT), the Joint Typhoon Warning Center issued the final warning on Vayu. At that time, Tropical Cyclone Vayu was located near 21.8 degrees north latitude and 66.8 degrees east longitude, approximately 180 nautical miles south of Karachi, Pakistan. Vayu was moving to the northeast and had maximum sustained winds near 35 knots (40 mph/65 kph) making it a minimal tropical storm.

In addition to dry air sapping the tropical cyclone’s ability to create more thunderstorms, wind shear is pushing the remaining storms to the east of the center.

In general, wind shear is a measure of how the speed and direction of winds change with altitude. Tropical cyclones are like rotating cylinders of winds. Each level needs to be stacked on top each other vertically in order for the storm to maintain strength or intensify. Wind shear occurs when winds at different levels of the atmosphere push against the rotating cylinder of winds, weakening the rotation by pushing it apart at different levels.

Vayu is forecast to dissipate later in the day on June 17.

By Rob Gutro
NASA’s Goddard Space Flight Center  

Vayu (was 02A) – Northern Indian Ocean

June 14, 2019 – Update #2 – NASA Finds Tropical Cyclone Vayu Getting Stretched

When NASA’s Aqua satellite passed over the Northern Indian Ocean, it captured an infrared image that revealed Tropical Cyclone Vayu was elongating. That’s never a good sign for a tropical cyclone, because they need a circular rotation to maintain strength.

AIRS image of Vayu
On June 14, at 0359 UTC (0859 UTC) the AIRS instrument aboard NASA’s Aqua satellite analyzed cloud top temperatures of Tropical Cyclone Vayu in infrared light. AIRS found coldest cloud top temperatures (purple) of strongest thunderstorms were as cold as or colder than minus 63 degrees Fahrenheit (minus 53 degrees Celsius). Credit: NASA JPL/Heidar Thrastarson

On June 14, warnings remained in effect for India’s Gujarat coast.

Infrared light enables NASA to take the temperatures of clouds and thunderstorms that make up tropical cyclones. The stronger the storms are indicate that they extend high into the troposphere and have cold cloud top temperatures.

An infrared look by NASA’s Aqua satellite on June 14, at 0359 UTC (0859 UTC) revealed strongest storms within Tropical Cyclone Vayu. The Atmospheric Infrared Sounder or AIRS instrument aboard NASA’s Aqua satellite analyzed cloud top temperatures and found cloud top temperatures of strongest thunderstorms as cold as or colder than minus 63 degrees Fahrenheit (minus 53 degrees Celsius) circling the center and in thunderstorms northwest of the center. Cloud top temperatures that cold indicate strong storms that have the capability to create heavy rain.

On June 14 at 11 a.m. EDT (1500 UTC), the center of Tropical Cyclone Vayu was located near latitude 20.8 degrees south and longitude 68.2 degrees east. Vayu was moving to the southwest and had weakened. Maximum sustained winds were near 75 knots (75 mph/120 kph) making the storm a category one hurricane on the Saffir-Simpson Hurricane Wind Scale. The AIRS imagery showed that the storm appeared more elongated, indicating that vertical wind shear was increasing and having an adverse effect on it, so Vayu was weakening.

The Joint Typhoon Warning Center expects Vayu to turn to the northeast in a day and a half and make landfall near the India/Pakistan border by June 17.

For updated forecasts from the India Meteorological Department, visit: http://www.imd.gov.in

By Rob Gutro
NASA’s Goddard Space Flight Center  

Vayu (was 02A) – Northern Indian Ocean

June 14, 2019 – NASA Finds Tropical Cyclone Vayu off India’s Gujarat Coast

NASA’s Terra satellite showed Tropical Cyclone Vayu still lingering near the northwestern coast of India, and its cloud-filled eye remained offshore.

Terra image of Vayu
On June 14, 2019, the MODIS instrument aboard NASA’s Terra satellite provided a visible image of Tropical Cyclone Vayu off India’s Gujarat coast, western India. Credit: NASA Worldview, Earth Observing System Data and Information System (EOSDIS)

On June 14, 2019, t the Moderate Resolution Imaging Spectroradiometer or MODIS instrument aboard NASA’s Terra satellite provided a visible image of Tropical Cyclone Vayu located off western India’s Gujarat coast. Animated enhanced infrared satellite imagery revealed a compact area of asymmetric central deep convection (building thunderstorms) with well-organized spiral banding wrapping into a cloud-filled ragged eye.

JTWC forecasters noted that there are several things happening with the storm that is affecting the strength and shape of it. Dry air continues to feed into the storm, which prevents the development of thunderstorms (that make up the tropical cyclone). However, that is offset by low vertical wind shear (outside winds blowing at different speeds at different levels of the atmosphere that if strong enough, can blow a storm apart). Vayu is also moving through very warm waters, as warm as 30 to 31 degrees Celsius (86 to 87.8 degrees Fahrenheit) that is keeping the storm together. Tropical cyclones require sea surface temperatures of at least 80 degrees Fahrenheit (26.6 degrees Celsius) to maintain them. Warmer sea surface temperatures help keep storms together or give them fuel to strengthen further.

At 5 a.m. EDT (0900 UTC), the Joint Typhoon Warning Center or JTWC reported that Tropical Cyclone Vayu was located near 20.8 degrees north latitude and 68/0 east longitude. That is 248 nautical miles south-southeast of Karachi, Pakistan. Vayu has turned to the west-southwest. Maximum sustained winds had dropped to 85 knots (98 mph/157 kph) and the storm is forecast to continue weakening.

The JTWC has forecast Vayu to curve back to the northeast and make landfall in four days along the northwestern India/Pakistan border on June 17.

By Rob Gutro
NASA’s Goddard Space Flight Center

Vayu (was 02A) Northern Indian Ocean

June 13, 2019 – Satellite Sees Tropical Cyclone Vayu Centered Off India Coastline

Tropical Cyclone Vayu’s eye was just off the western coast of India when the NOAA-20 satellite passed overhead and captured a visible image of the storm.

JPSS image of Vayu
NOAA’s JPSS satellite passed over the Northern Indian Ocean and the VIIRS instrument captured a visible image that showed the eye off the Gujurat coast of India. Credit: NOAA/NRL

The Visible Infrared Imaging Radiometer Suite (VIIRS) instrument aboard the NOAA-20 polar orbiting satellite provided a visible image of the storm. The VIIRS image revealed an eye surrounded by powerful thunderstorms. However, the majority of the strongest storms appeared to be displaced southwest of the eye.

The Joint Typhoon Warning Center or JTWC noted that dry air is wrapping into the system, which will limit its ability to intensify further.

At 11 a.m. EDT (1500 UTC) on June 13, 2019, Vayu had maximum sustained winds near 95 knots (109 mph/176 kph). Vayu’s eye was centered near 20.9 degrees north latitude and 68.8 degrees east longitude. It is approximately 264 nautical miles south-southeast of Karachi, Pakistan. Vayu has tracked north-northwestward.

JTWC forecasters noted that “the track is expected to shift westward in the near term as another subtropical ridge (elongated area of high pressure) located over Saudi Arabia builds in to the northwest. In one and a half days, increasing outside winds and more dry air moving into the system is expected to begin weakening it.

By Rob Gutro 
NASA’s Goddard Space Flight Center

Vayu (was 02A – Northern Indian Ocean)

June 12, 2019 – NASA Reveals Tropical Cyclone Vayu’s Compact Center

Visible imagery from NASA’s Aqua satellite showed Tropical Cyclone Vayu has a compact central dense overcast cloud cover. Vayu’s center was off-shore from India’s Gujarart coast.

Aqua image of Vayu
On June 12 at 4:05 a.m. EDT (0905 UTC), the MODIS instrument aboard NASA’s Aqua satellite provided a visible image of Tropical Cyclone Vayu and showed a compact center of circulation. Credit: NASA /NRL

On June 12 at 4:05 a.m. EDT (0905 UTC), the Moderate Resolution Imaging Spectroradiometer or MODIS instrument aboard NASA’s Aqua satellite provided a visible image of Vayu. Vayu’s center was off the western coast of India, in the Arabian Sea. Although hurricane-strength, the MODIS image showed a cloud-filled center of circulation and compact central dense overcast feature, approximately 90 to 100 nautical miles in diameter. The MODIS visible image also showed a thick band of thunderstorms wrapped into the low-level center from the western and southern quadrants. Meanwhile, satellite microwave imagery revealed a small eye beneath that overcast.

At 11 a.m. EDT (1500), the Joint Typhoon Warning Center reported that Tropical Cyclone Vayu was located near 19.4 degrees north latitude and 69.7 east longitude. That is 376 nautical miles south-southeast of Karachi, Pakistan. Vayu has tracked to the north-northwest. Maximum sustained winds were near 90 knots (104 mph/167 kph).

The Joint Typhoon Warning Center forecasts Vayu to strengthen slightly over the next day. Vayu is forecast to continue tracking north and turn to the northwest, with its center keeping off shore from India as it moves toward Pakistan. The latest forecast turns Vayu to the west, keeping it from a landfall through June 17.

By Rob Gutro
NASA’s Goddard Space Flight Center

Vayu (was 02A – Northern Indian Ocean)

June 11, 2019 – NASA Takes Tropical Cyclone‘s Vayu’s Temperature

NASA’s Aqua satellite passed over the Northern Indian Ocean and took the temperature of Tropical Cyclone Vayu as it moved northward in the Arabian Sea. NASA found the storm intensifying. Warnings are now in effect for India’s Gujarat coast.

AIRS Image of Vayu
On June 10, at 0511 UTC (0911 UTC) the AIRS instrument aboard NASA’s Aqua satellite analyzed cloud top temperatures of Tropical Cyclone Vayu in infrared light. AIRS found coldest cloud top temperatures (purple) of strongest thunderstorms were as cold as or colder than minus 63 degrees Fahrenheit (minus 53 degrees Celsius). Credit: NASA JPL/Heidar Thrastarson

Infrared light enables NASA to take the temperatures of clouds and thunderstorms that make up tropical cyclones. The stronger the storms are indicate that they extend high into the troposphere and have cold cloud top temperatures.

An infrared look by NASA’s Aqua satellite on June 10, at 0511 UTC (0911 UTC) revealed where the strongest storms were located within Tropical Cyclone Vayu, formerly known as Tropical Cyclone 02A. The Atmospheric Infrared Sounder or AIRS instrument aboard NASA’s Aqua satellite analyzed cloud top temperatures and found cloud top temperatures of strongest thunderstorms as cold as or colder than minus 63 degrees Fahrenheit (minus 53 degrees Celsius) circling the center and in thunderstorms northwest of the center. Cloud top temperatures that cold indicate strong storms that have the capability to create heavy rain.

On June 11, cloud top temperatures continued to cool, as Vayu intensified. The Joint Typhoon Warning Center stated, “multi-spectral satellite imagery showed “tightly-curved banding wrapping into a formative, small eye, which supports the initial position with good confidence.” Satellite imagery showed Vayu has a compact core, approximately 90 nautical miles in diameter with bands of thunderstorms wrapping around it from the western quadrant.

On June 11 at 5 a.m. EDT (0900 UTC), the center of Tropical Cyclone Vayu was located near latitude 16.4 degrees south and longitude 70/9 degrees east. Vayu was moving to the north and had maximum sustained winds were near 65 knots (75 mph/120 kph) making the storm a category one hurricane on the Saffir-Simpson Hurricane Wind Scale.

The Joint Typhoon Warning Center expects Vayu to intensify quickly, peaking at 95 knots (109 mph/176 kph) on June 12 before starting to weaken on June 13. That means hurricane-force winds, storm surge and heavy rain can be expected along the western coast of India is Vayu moves north over the next several days.

For updated forecasts from the India Meteorological Department, visit: http://www.imd.gov.in

By Rob Gutro
NASA’s Goddard Space Flight Center  

02A (Northern Indian Ocean)

June 10, 2019 – NASA Catches Development of Tropical Cyclone 02A

Visible imagery from NASA’s Terra satellite provided confirmation of the development of Tropical Cyclone 02A in the Arabian Sea, Northern Indian Ocean.

Terra image of 02A
On June 10, 2019, the MODIS instrument aboard NASA’s Terra satellite provided a visible image of Tropical Cyclone 02A in the Northern Indian Ocean, off the western coast of India. Credit: NASA Worldview, Earth Observing System Data and Information System (EOSDIS)

On June 10, the Moderate Resolution Imaging Spectroradiometer or MODIS instrument aboard NASA’s Terra satellite provided a visible image of 02A that showed thunderstorms circling the low-level center. MODIS imagery also showed some clouds and thunderstorms were offset to the northwest of the center. That’s a result of outside winds or vertical wind shear, blowing from the southeast and pushing some clouds to the northwest.

Satellite imagery revealed that the sea surface temperatures are warm enough to support further development of Tropical Cyclone 02A, and forecasters at the Joint Typhoon Warning Center expect some strengthening over the next couple of days.

At 11 a.m. EDT (1500 UTC) on Monday, June 10, 2019, Tropical Cyclone 02A was centered near 13.7 degrees north latitude and 70.8 east longitude. That puts the center about 350 nautical miles south-southwest of Mumbai, India. 02A was moving to the north-northwest at 8 knots (9 mph/15 kph). Maximum sustained winds were near 45 knots (52 mph/83 kph).

The Joint Typhoon Warning Center forecast noted that the storm is expected to peak on June 12 when maximum sustained winds reach 60 knots (69 mph/111 kph). ”The cyclone is expected to continue tracking generally northward along the western periphery of a subtropical ridge (elongated area of high pressure) anchored over India, making landfall near Jamnagar around 96 hours [June 14] and track inland.”

By Rob Gutro
NASA’s Goddard Space Flight Center