Joaninha (Southern Indian Ocean)

Mar. 29, 2019 – Satellite Finds Tropical Cyclone Joaninha Slammed by Wind Shear

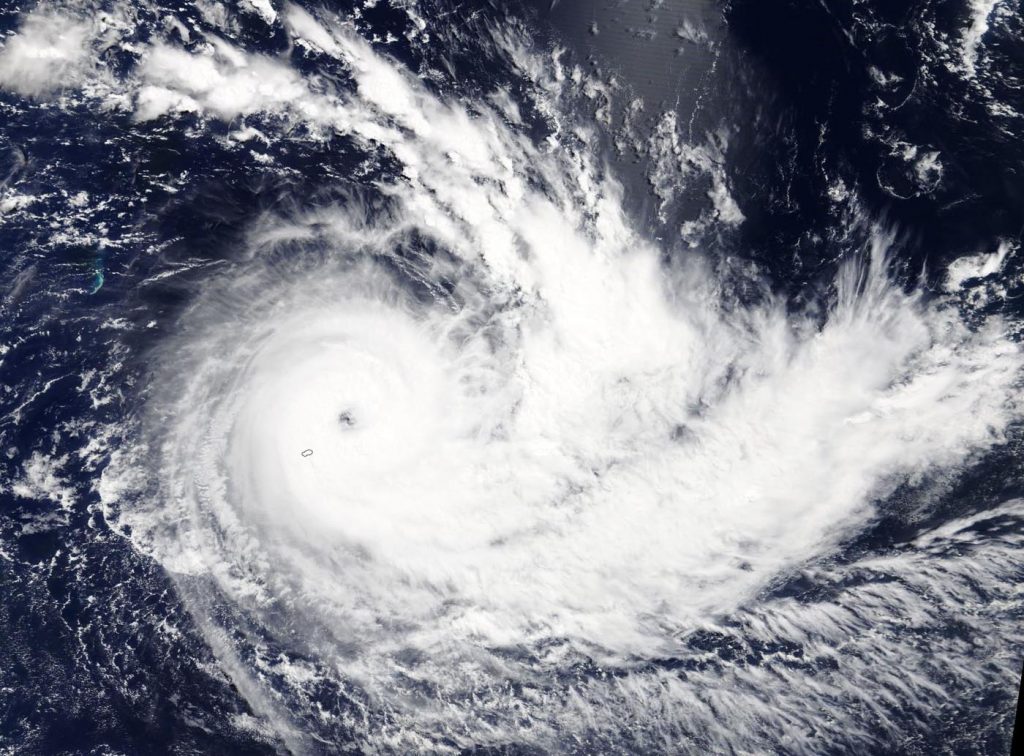
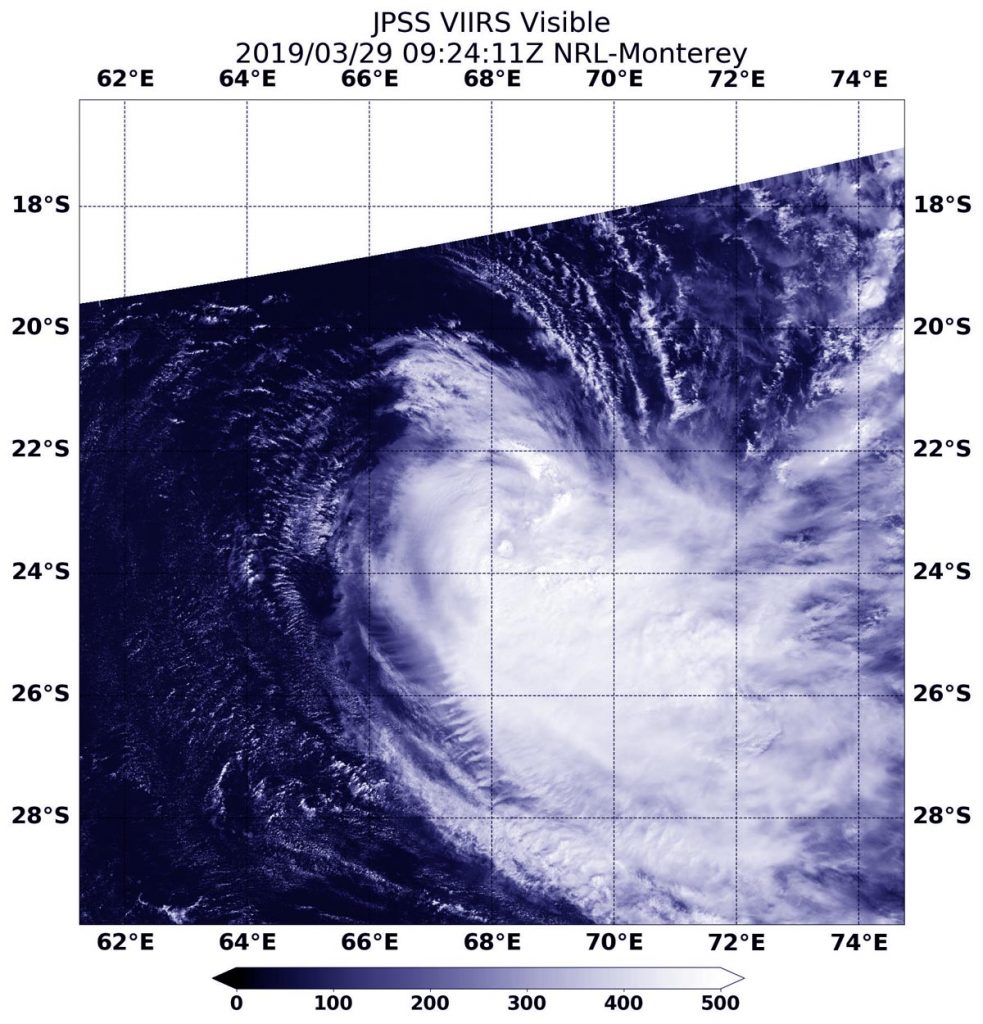
One day makes a big difference when you’re a tropical cyclone. On March 28, Tropical Cyclone Joaninha still maintained an eye, and on March 29, once outside winds ramped up, the storm weakened quickly. NOAA’s NOAA-20 satellite provided an image of the storm that showed a large area of thunderstorms were pushed away from the center.

NASA-20 image of Joaninha
NOAA’s NASA-20 satellite passed over Tropical Cyclone Joaninha on March 29 at 5:24 a.m. EDT (0924 UTC) and captured this image of the storm, starting to show effects of wind shear. Credit; NOAA/NRL

On March 29, 2019 at 11 a.m. EDT (1500 UTC), Joaninha’s maximum sustained winds dropped to 65 knots. It was centered near 23.6 degrees south latitude and 68.6 degrees east longitude. That’s approximately 655 nautical miles east-southeast of Port Louis, Mauritius. Joaninha was moving to the southeast.

When NOAA’s NASA-20 satellite passed over Tropical Cyclone Joaninha on March 29 at 5:24 a.m. EDT (0924 UTC) the VIIRS instrument aboard captured a visible image of the storm. Satellite imagery showed struggling central deep convection (rising air that condenses into clouds and thunderstorms that make up a tropical cyclone) being pushed away from the low level circulation center to the east.

In general, wind shear is a measure of how the speed and direction of winds change with altitude. Tropical cyclones are like rotating cylinders of winds. Each level needs to be stacked on top each other vertically in order for the storm to maintain strength or intensify. Wind shear occurs when winds at different levels of the atmosphere push against the rotating cylinder of winds, weakening the rotation by pushing it apart at different levels.

Increasing westerly vertical wind shear above 30 knots continues to affect the system’s structure, leading to rapid weakening. That wind shear is forecast to increase, according to the Joint Typhoon Warning Center or JTWC. In addition, Joaninha is expected to move into sea surface temperatures cooler than the 80 degree Fahrenheit (26.6 degree Celsius) threshold needed to maintain a storm. Between the increasing wind shear and cooler waters, Joaninha is expected to continue to weaken.

JTWC also noted that within three days, “the cyclone will begin to transition from a tropical to subtropical storm with expansive, asymmetric, gale force wind radii as it merges with a cutoff low pressure area.”

By Rob Gutro
NASA’s Goddard Space Flight Center

Joaninha (Southern Indian Ocean)

Mar. 28, 2019 – NASA Finds Tropical Cyclone Joaninha Maintaining an Eye

Tropical Cyclone Joaninha is not yet ready to close its eye and weaken. Visible imagery from NASA’s Terra satellite showed Tropical Cyclone Joaninha maintaining an eye thanks to low wind shear and warm sea surface temperatures.

Terra image of Joaninha
On March 28, 2019, the MODIS instrument aboard NASA’s Terra satellite provided a visible image of Tropical Cyclone Joaninha in the Southern Indian Ocean. Credit: NASA Worldview, Earth Observing System Data and Information System (EOSDIS)

On March 28 the Moderate Resolution Imaging Spectroradiometer or MODIS instrument aboard NASA’s Terra satellite provided a visible image of Joaninha. Joaninha had maintained its eye, although appearing more ragged looking than in satellite imagery the previous day. The ragged eye was surrounded by powerful thunderstorms in a thick eyewall.

Moving Through Warm Sea Surface Temperatures

The sea surface temperatures in the area of the tropical cyclone were still warm enough to support and maintain the tropical cyclone. Infrared satellite imagery provides sea surface temperature data. Tropical cyclones need sea surface temperatures of at least 26.6 degrees Celsius (80 degrees Fahrenheit) and Joaninha is moving through an area where the sea surface temperatures range between 26 and 28 degrees Celsius (78.8 and 82.4 degrees Fahrenheit).

At 5 a.m. EDT (0900 UTC) on Thursday, March 28, 2019, maximum sustained winds near Joaninha’s center were near 115 knots (132 mph/213 kph). Joaninha was centered near 21.2 degrees south latitude and 67.4 degrees east longitude. That’s about 570 nautical miles east of Port Louis, Mauritius.

Joaninha is expected to move into an area that is unfavorable for it to maintain strength. The Joint Typhoon Warning Center or JTWC noted “Increasing westerly vertical wind shear associated with a mid-latitude trough (elongated area of low pressure) approaching from the southwest will compete with flow into that trough to produce a gradual weakening trend” as Joaninha tracks southward and along the edge of an area of elongated high pressure, located to the east.

In four days, Joaninha is expected to merge with an area of low pressure and transition into a subtropical storm.

What is a Sub-tropical Storm?

 According to the National Oceanic and Atmospheric Administration, a sub-tropical storm is a low-pressure system that is not associated with a frontal system and has characteristics of both tropical and extratropical cyclones. Like tropical cyclones, they are non-frontal that originate over tropical or subtropical waters, and have a closed surface wind circulation about a well-defined center.

Unlike tropical cyclones, subtropical cyclones derive a significant proportion of their energy from baroclinic sources (atmospheric pressure), and are generally cold-core in the upper troposphere, often being associated with an upper-level low pressure area or an elongated area or trough of low pressure.

In comparison to tropical cyclones, these systems generally have a radius of maximum winds occurring relatively far from the center (usually greater than 60 nautical miles), and are generally less symmetric.

By Rob Gutro
NASA’s Goddard Space Flight Center

Idai (Southern Indian Ocean)

Mar. 28, 2019 – Darkness in the Wake of Idai
Suomi NPP image of Idai aftermath
The image on the left shows the extent of electric lighting across Beira on March 9, 2019, a typical night before the storm hit; the image on the right shows light on March 24, 2019, three days after Idai had passed. Nearly all electricity and internet went out, except near the airport where relief organizations had set up a server.

In March 2019, Tropical Cyclone Idai pummeled through southeastern Africa to become one of the deadliest storms ever recorded to hit the Southern Hemisphere. The storm caused catastrophic floodinglandslides, and large numbers of casualties across Mozambique, Malawi, and Zimbabwe. One of the most affected areas was Beira, Mozambique’s second-largest port city of 530,000 people, where the cyclone made landfall on March 14.

The storm “destroyed 90 percent” of Beira, according to an initial assessment by a team from the International Federation of Red Cross and Red Crescent Societies. As of March 20, an estimated 1 million people were without electricity.

The image on the left shows the extent of electric lighting across Beira on March 9, 2019, a typical night before the storm hit; the image on the right shows light on March 24, 2019, three days after Idai had passed. Nearly all electricity and internet went out, except near the airport where relief organizations had set up a server.

These images of Beira’s nighttime lights are based on data captured by the Suomi NPP satellite. The data was acquired by the Visible Infrared Imaging Radiometer Suite (VIIRS) “day-night band,”which detects light in a range of wavelengths from green to near-infrared, including reflected moonlight, light from fires and oil wells, lightning, and emissions from cities or other human activity. A team of scientists from NASA’s Goddard Space Flight Center and Marshall Space Flight Center processed and corrected the raw VIIRS data to filter out stray light from sources that are not electric lights as well as other atmospheric interference, such as dust, haze, and thin clouds. The base map makes use of data collected by the Landsat satellite.

The cyclone also knocked out transmission lines in Mozambique that carry power to South Africa. The major state-owned utility company in South Africa has been administering controlled blackouts for more than a week to conserve energy until power lines are fixed, which may take weeks to months.

Idai dissipated on March 21, but had already dumped heavy rains on approximately 23,000 square kilometers (900 square miles) of land—an area larger than New York City and Los Angeles combined. In Mozambique, the storm inundated more than 360,000 hectares (900,000 acres) of crops, damaged at least 17,000 houses, and dozens of health units.

IMERG data on rainfall after Idai
The map above shows rainfall accumulation from March 13 to March 20, 2019. Many areas received as much as 50 centimeters (20 inches) of rain. These data are remotely-sensed estimates that come from the Integrated Multi-Satellite Retrievals (IMERG), a product of the Global Precipitation Measurement (GPM) mission. Local rainfall amounts can be significantly higher when measured from the ground. Credit: NASA

NASA Earth Observatory images by Joshua Stevens, using Black Marble data courtesy of Ranjay Shrestha/NASA Goddard Space Flight Center, Landsat data from the U.S. Geological Survey, and IMERG data from the Global Precipitation Mission (GPM) at NASA/GSFC. Story by Kasha Patel.

Joaninha (Southern Indian Ocean)

Mar 27, 2019 – NASA’s Aqua Satellite Keeps an “Eye” on Tropical Cyclone Joaninha

Visible imagery from NASA’s Aqua satellite showed a visible eye remained in Tropical Cyclone Joaninha is it continued moving through the central Southern Indian Ocean.

Aqua image of Joaninha
On March 27, 2019, the MODIS instrument aboard NASA’s Aqua satellite provided a visible image of Tropical Cyclone Joaninha moving through the central Southern Indian Ocean. Joaninha maintained a 15 nautical-mile wide eye. Credit: NASA Worldview, Earth Observing System Data and Information System (EOSDIS)

On March 27, 2019 the Moderate Resolution Imaging Spectroradiometer or MODIS instrument aboard NASA’s Aqua satellite provided a visible image of Joaninha. Joaninha maintained its eye, and the eye was surrounded by powerful thunderstorms. Bands of thunderstorms spiraled into the center of circulation from the east.

The Joint Typhoon Warning Center or JTWC noted that animated multispectral satellite imagery showed that the ragged eye was 15 nautical miles in diameter.

At 11 a.m. EDT (1500 UTC) Tropical Cyclone Joaninha’s maximum sustained winds were near 110 knots (126 mph/204 kph). It was centered near 20.5 degrees south latitude and 67.0 degrees east longitude. That’s approximately 199 nautical miles (229 miles/369 km) east of Port Mathurin, Mauritius. Joaninha was moving to the east and is forecast to turn in a more southerly direction and begin weakening.

The Mauritius Meteorological Services (MMS) noted that there is still an active warning for Rodrigues. A High Wave warning remains in effect for Rodrigues until 10 a.m. local time on Friday, March 29. MMS’s warning noted “The intense Tropical Cyclone Joaninha is generating heavy swells of the order of 5 meters [16 feet] which are influencing the sea state around Rodrigues. Also storm surge will cause a rise in the sea water level of about 1.0 meters [3.2 feet] above the normal tides which will result in the inundation of low lying coastal areas particularly to the east, south and south-west.”

MMS strongly advised for fishermen, boaters and the public not to go out at sea and not to venture on the beaches until they are given the “all clear” from local authorities.

Joaninha is forecast to transition into a subtropical cyclone over the next several days.

For updated forecasts from the Mauritius Meteorological Services, visit: metservice.intnet.mu/

By Rob Gutro
NASA’s Goddard Space Flight Center

Joaninha (Southern Indian Ocean)

Mar. 26, 2019 – NASA Sees Tropical Cyclone Joaninha Affecting Mauritius

Visible imagery from NASA’s Terra satellite showed Tropical Cyclone Joaninha as it moved through the Southern Indian Ocean triggering warnings in the island nation of Mauritius.

Terra image of Joaninha
On March 26, 2019, the MODIS instrument aboard NASA’s Terra satellite provided a visible image of Tropical Cyclone Joaninha in the Southern Indian Ocean. Credit: NASA Worldview, Earth Observing System Data and Information System (EOSDIS)

Mauritius is an island nation, known for its beaches, lagoons and reefs. It is located to the northeast of Reunion Island.

The Mauritius Meteorological Services (MMS) issued several warnings on Joaninha. On March 26 a Strong wind and High Wave warning were in effect for Rodrigues valid until 10 a.m. local time on Wednesday, March 27, 2019.

MMS noted “The intense tropical cyclone Joaninha evolving to the east of Rodrigues is causing strong southerly winds to blow over the island. Gusts may reach 100 kph (62mph) in places. The cyclone is also generating heavy swells of the order of 5 to 7 meters (16 to 23 feet) which are influencing the sea state around Rodrigues. Also storm surge will cause a rise in the sea water level of about 1.5 meters (5 feet) above the normal tides which will result in the inundation of low lying coastal areas particularly to the east, south and south-west.”

On March 26, 2019, the Moderate Resolution Imaging Spectroradiometer or MODIS instrument aboard NASA’s Terra satellite provided a visible image of Joaninha. Joaninha had a 15 nautical-mile wide eye surrounded by powerful thunderstorms. Bands of thunderstorms spiraled into the center of circulation from the eastern quadrant.

On March 26 at 8 a.m. EDT (1200 UTC) Joaninha had maximum sustained winds near 115 knots (132 mph/213 kph). Joaninha was centered near 19.6 degrees south latitude and 65.2 degrees east longitude. That’s about 86 nautical miles (99 miles/ 159 km) east of Port Mathurin, Mauritius

Joaninha is moving through an area of warm waters, which will continue to fuel it. The Joint Typhoon Warning Center noted that the wind shear, outside winds that can affect a storm at different altitudes, was light, so it will not affect the storm on its track to the south for the next day or two.

For local updates from the MMS, visit: http://metservice.intnet.mu

By Rob Gutro
NASA’s Goddard Space Flight Center

Veronica (Southern Indian Ocean)

Mar. 26, 2019 – Satellite Finds Tropical Cyclone Veronica’s Stripped Center Along Australia Coast

Early on March 26, Tropical Cyclone Veronica continued to move along the coast of Western Australia and NASA-NOAA’s Suomi NPP satellite provided a visible image of the storm that showed the storm was stripped of strong thunderstorm development around the center.

Suomi NPP image of Veronica
NASA-NOAA’s Suomi NPP satellite passed over the Southern Indian Ocean and captured a visible image of a rapidly dissipating Tropical Cyclone Veronica on March 26, along the coast of Western Australia. Credit: NASA Worldview, Earth Observing System Data and Information System (EOSDIS).

Suomi NPP passed over Veronica on March 26 and the Visible Infrared Imaging Radiometer Suite (VIIRS) instrument provided a visible image of the storm. The VIIRS image revealed that the storm weakened and the center cleared of clouds from the previous day. The cause of the raid weakening was strong vertical wind shear. Winds blowing at different levels in the atmosphere at strong speeds tore the storm apart.

In the image, the eastern and southern quadrant of Veronica was over land, while the rest of the storm was over the Southern Indian Ocean. However due to the strong winds Veronica is rapidly deteriorating and is expected to dissipate by the end of the day on March 26.

The Australian Bureau of Meteorology or ABM said the marine warning has been canceled for

Pilbara Coast West and Ningaloo Coast. However, there are still warnings in effect on March 26: A Moderate Flood Warning is in effect for the De Grey River Catchment, a Flood Warning is in effect for the Pilbara Coastal Rivers and the Final Flood Watch has been posted for the Pilbara District Rivers.

The Joint Typhoon Warning Center issued their final advisory on Veronica at 11 p.m. EDT on March 25 (0300 UTC on March 26). At that time Veronica had maximum sustained winds near 35 knots (40 mph/65 kph). Veronica was located near 21.1 degrees South latitude and 115.4 degrees East longitude. That’s about 123 nautical miles northeast of Learmonth, Australia.

Veronica will continue to rapidly deteriorate and dissipate later in the day.

For updated local forecasts, visit: http://www.bom.gov.au

By Rob Gutro 
NASA’s Goddard Space Flight Center

Idai (Southern Indian Ocean)

Mar. 26, 2019 – Floods and Landslides in Chimanimani from Idai

Tropical Cyclone Idai barreled into southern Africa. in mid-March 2019, leaving a deadly path of destruction in Mozambique, Malawi, and Zimbabwe.

Difference between Jan. 11 and Mar. 25 in Mozambique
Flooding in Mozambique compares this image from Jan. 11, 2019 to the one below taken on Mar. 25, 2019. See the link below for another set of images provided by the Earth Observatory. Credit: Image Courtesy: NASA Worldview, Earth Observing System Data and Information System (EOSDIS). Caption:  Lynn Jenner
From March 25, 2019. Image Courtesy: NASA Worldview, Earth Observing System Data and Information System (EOSDIS).  Caption: Lynn Jenner

According to reports, the Chimanimani District in Zimbabwe was among the worst affected areas. Widespread changes in the landscape are visible in satellite images from before and after the storm, including the landslide seen below:

Before and after images of the flooding in Mozambique

For the entire story: https://earthobservatory.nasa.gov/images/144739/floods-and-landslides-in-chimanimani

By Mike Carlowicz
NASA’s Earth Observatory

Veronica (Southern Indian Ocean)

Mar. 25, 2019 – Satellite Tracks Tropical Cyclone Veronica Along Australia Coast

On March 25, Tropical Cyclone Veronica continued to move in southerly direction along the coast of Western Australia in the Southern Indian Ocean. NASA-NOAA’s Suomi NPP satellite provided a visible image of the storm.

Suomi NPP image of Veronica
NASA-NOAA’s Suomi NPP satellite passed over the Southern Indian Ocean and captured a visible image of Tropical Cyclone Veronica on March 25, as it continued moving along the coast of Western Australia. Credit: NASA Worldview, Earth Observing System Data and Information System (EOSDIS).

Suomi NPP passed over Veronica on March 25 and the Visible Infrared Imaging Radiometer Suite (VIIRS) instrument provided a visible image of the storm. The VIIRS image showed what appeared to be a cloud-filled eye just off the coast, surrounded by powerful thunderstorms. The eastern and southern quadrant of Veronica was over land, while the rest of the storm was over the Southern Indian Ocean.

The Australian Bureau of Meteorology or ABM said that Tropical Cyclone Veronica, located near Karratha, was moving slowly west southwest and is likely to weaken below tropical cyclone intensity early Tuesday. Heavy rain over the central Pilbara will ease during Tuesday.

The Warning zone for March 25, 2019 extended from Roebourne to Mardie, including Karratha, and adjacent inland areas.

ABM expects Veronica to move in a westerly direction with its eye remaining just off the coast. It is forecast to pass just north of Dampier and over Barrier Island on its west-southwestward track. ABM noted that “widespread, very heavy rainfall conducive to major flooding is likely over the central Pilbara coast and adjacent inland areas, easing gradually during Tuesday. Heavy rainfall is expected to result in significant river rises, areas of flooding and hazardous road conditions. Some roads may become impassable and some communities may become isolated.”

At 11 a.m. EDT or 11:00 p.m. Australian Western Standard Time (AWST) the ABM said that Veronica has maximum sustained winds near 75 kph (46 mph). Veronica was located near   20.4 degrees South latitude and 116.7 degrees East longitude. That’s about 30 kilometers (18.6 miles) north of Dampier.

The cyclone is a category one system currently located just off the central Pilbara coast, north of Karratha. Veronica is expected to move towards the west southwest and is likely to weaken below tropical cyclone intensity early Tuesday morning.

For updated forecasts, visit: http://www.bom.gov.au

By Rob Gutro 
NASA’s Goddard Space Flight Center

Joaninha (Southern Indian Ocean)

Mar. 25, 2019 – NASA Finds Heavy Rainfall around Tropical Cyclone Joaninha’s Center

NASA calculated the rainfall rates occurring in Tropical Cyclone Joaninha as it moved through the open waters of the Southern Indian Ocean.

IMERG data on Joaninha
On March 24 NASA’s IMERG calculated heavy rain falling around Tropical Cyclone Joaninha’s center at a rate of 0.75 inches (19 mm) per hour (dark red). Credit: JAXA/NASA Worldview, Earth Observing System Data and Information System (EOSDIS)

Data from the Global Precipitation Measurement mission (GPM) is used to develop rainfall total estimations and provided a look at rain Joaninha was generating.

GPM is a joint mission between NASA and the Japan Aerospace Exploration Agency, JAXA. GPM also utilizes a constellation of other satellites to provide a global analysis of precipitation that are used in the IMERG calculation. NASA’s Integrated Multi-satellitE Retrievals for GPM (IMERG) data were used to estimate the rate in which rain was falling in Joaninha on March 24.  Rainfall rates were often greater than 0.75 inches (19 mm) per hour around the center.

What Is IMERG? 

At NASA’s Goddard Space Flight Center in Greenbelt, Maryland, those data are incorporated into NASA’s IMERG or Integrated Multi-satellitE Retrievals for GPM. IMERG is used to estimate precipitation from a combination of passive microwave sensors, including the Global Precipitation Measurement (GPM) mission’s core satellite’s GMI microwave sensor and geostationary IR (infrared) data. IMERG real-time data are generated by NASA’s Precipitation Processing System every half hour and are normally available within six hours.

IMERG creates a merged precipitation product from the GPM constellation of satellites. These satellites include DMSPs from the U.S. Department of Defense, GCOM-W from the Japan Aerospace Exploration Agency (JAXA), Megha-Tropiques from the Centre National D’etudies Spatiales (CNES) and Indian Space Research Organization (ISRO), NOAA series from the National Oceanic and Atmospheric Administration (NOAA), Suomi-NPP from NOAA-NASA, and MetOps from the European Organisation for the Exploitation of Meteorological Satellites (EUMETSAT).  All of the instruments (radiometers) onboard the constellation partners are inter-calibrated with information from the GPM Core Observatory’s GPM Microwave Imager (GMI) and Dual-frequency Precipitation Radar (DPR).

Tropical Cyclone Joaninha’s Status

On March 25 at 11 a.m. EDT (1500 UTC), Joaninha had maximum sustained winds near 105 knots (121 mph/195 kph). It was centered near 18.3 degrees south latitude and 62.9 degrees east longitude, about 335 miles east-northeast of Port Louis, Mauritius. Joaninha was moving to the southeast and is expected to continue in that general direction.

A tropical cyclone warning class 4 remains in force at Rodrigues. At 11 a.m. EDT (1500 UTC) wind gusts of 87 knots (100 mph/161 kph) were observed, which will increase as the cyclone passes.

The Joint Typhoon Warning Center forecast expects Joaninha to continue to move southeast, while intensifying to 110 knots (126 mph/204 kph) by March 26, as it passes close to Rodrigues Island. After 3 days, the cyclone will start to weaken as conditions deteriorate.

By Rob Gutro
NASA’s Goddard Space Flight Center

Iba (Southern Atlantic Ocean)

Mar. 25, 2019 – Rare Tropical Storm Forms in the South Atlantic
NOAA GOES-East
A rare tropical storm formed in the South Atlantic off the southeast coast of Brazil on Sunday, March 24, 2019. Tropical Storm Iba, seen here by GOES East, is currently located about 440 miles northeast of Rio de Janeiro, Brazil, according to the Brazilian Navy Hydrographic Center (BNHC).. Iba is the first named tropical storm in the South Atlantic in nearly 10 years.

A rare tropical storm formed in the South Atlantic off the southeast coast of Brazil on March 24, 2019. Iba is the first named tropical storm in the South Atlantic since 2010. Only one known hurricane has ever been recorded in the South Atlantic. Hurricane Catarina made landfall over the state of Santa Catarina, Brazil, as a Category 1 storm on March 27, 2004. The lack of tropical cyclones in the region is generally attributed to cool sea surface temperatures and strong vertical wind shear according to the National Hurricane Center.

By John Leslie
NOAA