Apr. 27, 2020 – NASA Catches Formation and Final Fate of Eastern Pacific’s Tropical Depression 1E
The Eastern Pacific Ocean’s hurricane season may not officially start until mid-May, but the first tropical cyclone of the season formed over the weekend of April 25 and 26. NASA’s Aqua satellite provided an infrared look at the small depression when it was at its peak and before it became post-tropical.
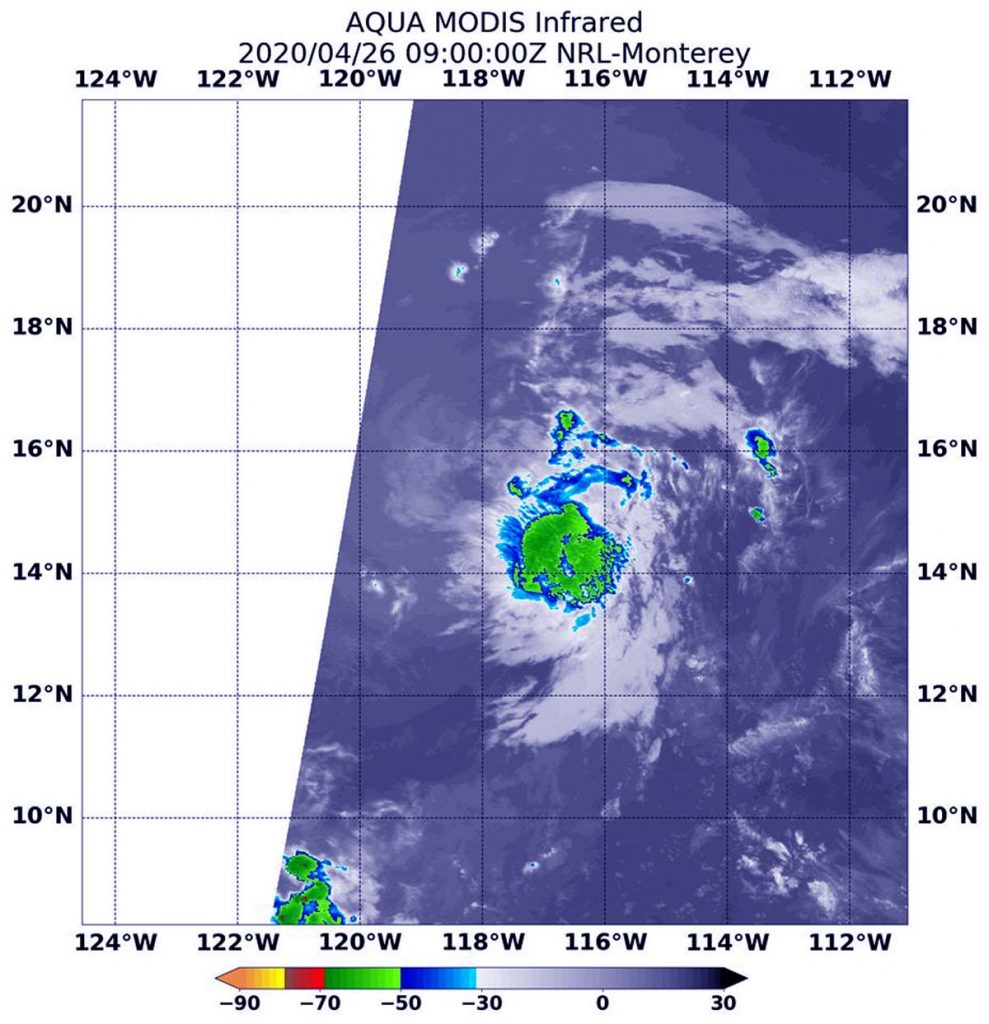
NASA’s Aqua satellite passed over Tropical Depression 1E on Sunday, April 26, 2020 at 5 a.m. EDT (0900 UTC) and the MODIS instrument aboard analyzed 1E in infrared light to determine temperature of cloud tops in storms. MODIS found cloud top temperatures as cold as minus 50 degrees Fahrenheit in the depression, not cold enough to suggest heavy rainfall. Credit: NASA/NRL
Tropical Depression 1E formed on Saturday, April 25 and by the next day, it was not in a favorable environment for further development, according to the National Hurricane Center (NHC). NASA’s Aqua satellite provided forecasters with a look at 1E’s cloud top temperatures to assess the strength of the storm.
NASA’s Aqua satellite passed over Tropical Depression 1E on Sunday, April 26, 2020 at 5 a.m. EDT (0900 UTC) and the Moderate Resolution Imaging Spectroradiometer or MODIS instrument aboard analyzed 1E in infrared light. Infrared light is used to determine temperature of cloud tops in storms, and the colder the cloud top, the higher it is in the troposphere (lowest layer of the atmosphere), and the stronger the storm tends to be. MODIS found cloud top temperatures as cold as minus 50 degrees Fahrenheit in the depression, not cold enough to suggest heavy rainfall.
On April 26, the National Hurricane Center (NHC) reported, “Deep convection has been waning quickly in the southeastern quadrant since the previous advisory, and the system barely met criteria for identifying it as a tropical cyclone at 1200 UTC (8 a.m. EDT).”
NHC said at 11 a.m. EDT (8 a.m. PDT) the center of Tropical Depression 1E was located near latitude 15.7 north, longitude 118.8 west. At that time, 1E reached its peak with maximum sustained winds near 35 mph (55 kph). The system weakened throughout the day and overnight as it encountered, “Deep-layer dry air and cooler sea-surface temperatures, combined with strong westerly shear of 25 to 30 knots,” NHC noted.
On Monday, April 27, 2020, the NHC said that post-tropical remnant low 1E was far from land areas as it continued to degenerate. It was centered near latitude 17 degrees north and longitude 121 degrees west. The estimated minimum central pressure was 1010 millibars. Maximum sustained winds were 25 knots (29 mph/46 kph).
A post-tropical storm is a generic term for a former tropical cyclone that no longer possesses sufficient tropical characteristics to be considered a tropical cyclone. Former tropical cyclones can become fully extratropical, subtropical, or remnant lows, which are three classes of post-tropical cyclones. In any case, they no longer possesses sufficient tropical characteristics to be considered a tropical cyclone. However, post-tropical cyclones can continue carrying heavy rains and high winds.
This system was only retaining shallow convection. It continued to weaken as it moved toward the west-northwest. NHC expects the system to dissipate by Tuesday, April 28.
Hurricane season officially begins on May 15 in the Eastern Pacific Ocean, so this depression was early for season. For more information about NHC, visit: www.nhc.noaa.gov.
Typhoons/ hurricanes are the most powerful weather events on Earth. NASA’s expertise in space and scientific exploration contributes to essential services provided to the American people by other federal agencies, such as hurricane weather forecasting.
The MODIS instrument is one of six instruments flying on board NASA’s Aqua satellite which launched on May 4, 2002.
NASA analyzed weakening Tropical Storm Jeruto’s rainfall and found one small area of moderate rainfall displaced from the center, because of strong wind shear.
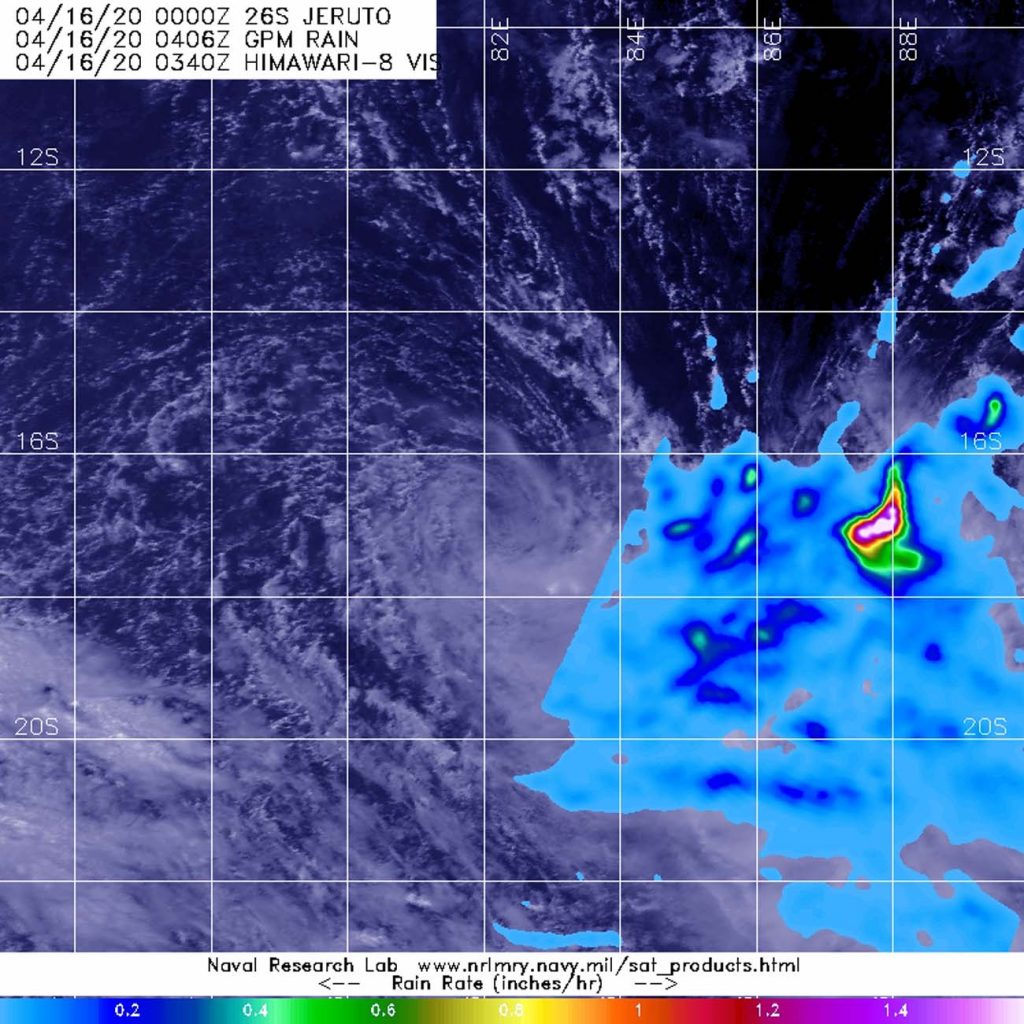
The GPM core satellite passed over Tropical Storm Jeruto on April 16 at 12:06 a.m. EDT (0406 UTC). Winds pushed the heaviest rainfall (pink) east of the center, where it was falling at a rate of 1.6 inches (40 mm) per hour in a small area. Credit: NASA/JAXA/NRL
In general, wind shear is a measure of how the speed and direction of winds change with altitude. Outside winds were pushing against the storm and displacing the heaviest rainfall east of the center.
On April 15 at 5 p.m. EDT (2100 UTC), The Joint Typhoon Warning Center noted that Tropical Storm Jeruto was barely holding onto tropical storm status with maximum sustained winds near 35 knots (40 mph/65 kph). Jeruto was located near latitude 16.2 degrees south and longitude 83.1 degrees east, about 828 nautical miles southeast of Diego Garcia.
Seven hours later, NASA gathered data on the precipitation occurring in the weakening storm. NASA has the unique capability of peering under the clouds in storms and measuring the rate in which rain is falling. The Global Precipitation Measurement mission or GPM core passed over Jeruto from its orbit in space and measured rainfall rates in the storm on April 16 at 12:06 a.m. EDT (0406 UTC). Winds pushed the heaviest rainfall east of the center, where it was falling at a rate of 1.6 inches (40 mm) per hour in a small area.
Jeruto is expected to dissipate on April 16.
Tropical cyclones/hurricanes are the most powerful weather events on Earth. NASA’s expertise in space and scientific exploration contributes to essential services provided to the American people by other federal agencies, such as hurricane weather forecasting.
Both the Japan Aerospace Exploration Agency, JAXA and NASA manage GPM.
Apr. 15, 2020 – NASA Finds Tropical Storm Jeruto Develop in Southern Indian Ocean
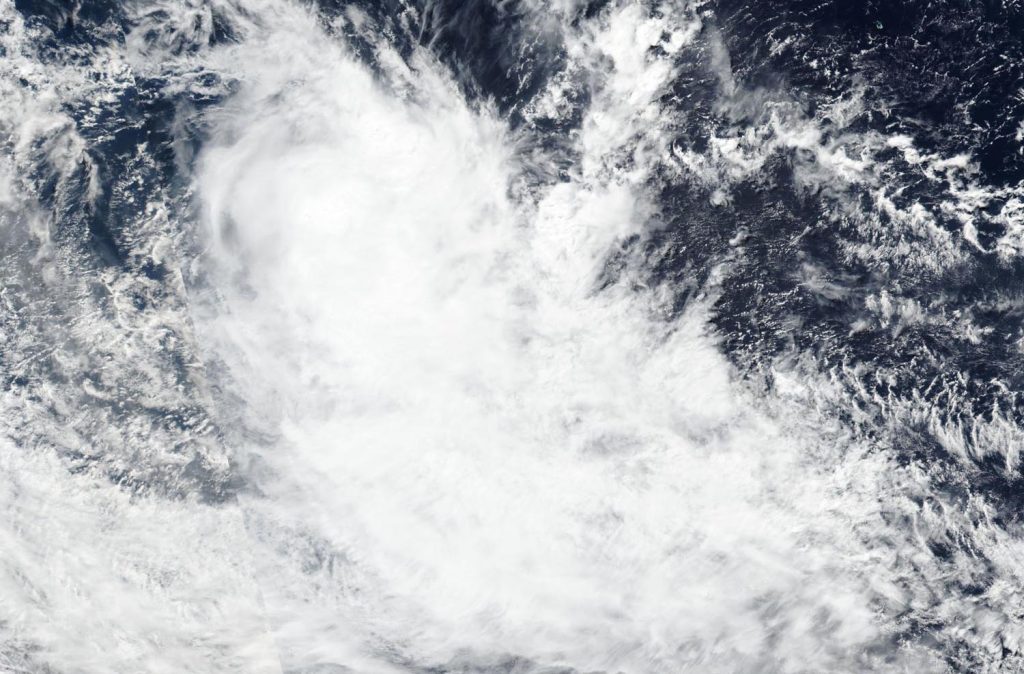
The latest tropical cyclone to develop in the Southern Indian Ocean is no threat to land areas. NASA-NOAA’s Suomi NPP satellite provided forecasters with a visible image of Tropical Storm Jeruto on April 15, 2020.
NASA-NOAA’s Suomi NPP satellite provided forecasters with a visible image of Tropical Storm Jeruto on April 15 shortly after it developed in the Southern Indian Ocean. Credit: NASA Worldview, Earth Observing System Data and Information System (EOSDIS)
Visible imagery from NASA satellites help forecasters understand if a storm is organizing or weakening. The visible image created by the Visible Infrared Imaging Radiometer Suite (VIIRS) instrument aboard Suomi NPP showed Jeruto was being affected by wind shear after it developed. Vertical wind shear, that is, winds outside of a tropical cyclone at different heights in the atmosphere (the troposphere) push against a tropical cyclone and tear it apart.
The shape of a tropical cyclone provides forecasters with an idea of its organization and strength, and NASA-NOAA’s Suomi NPP satellite showed the storm appeared elongated, as outside winds were pushing clouds away from the center of circulation.
On April 15 at 5 a.m. EDT (0900 UTC), Jeruto’s center was located near latitude 15.8 degrees south and longitude 84.3 degrees east. Jeruto was moving west-southwest near 10 knots (12 mph/19 kph). Maximum sustained winds were near 40 knots (46 mph/76 kph).
The Joint Typhoon Warning Center noted vertical wind shear (wind speeds) will increase and will likely dissipate the storm within a couple of days.
Tropical cyclones/hurricanes are the most powerful weather events on Earth. NASA’s expertise in space and scientific exploration contributes to essential services provided to the American people by other federal agencies, such as hurricane weather forecasting.
Apr. 10, 2020 – Extra-tropical Cyclone Harold Caught by NASA’s Terra Satellite
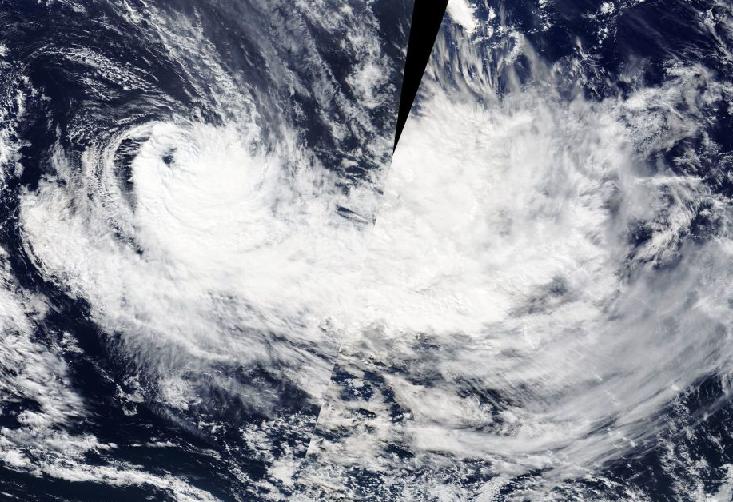
NASA’s Terra satellite passed over the Southern Pacific Ocean and captured a visible image of extra-tropical cyclone Harold.
On April 10, the MODIS instrument that flies aboard NASA’s Terra provided a visible image of Extra-tropical Cyclone Harold in the Southern Pacific Ocean. Credit: NASA Worldview, Earth Observing System Data and Information System (EOSDIS).
On April 10, the visible image captured by the Moderate Resolution Imaging Spectroradiometer or MODIS instrument that flies aboard NASA’s Terra satellite showed that extra-tropical cyclone Harold was elongated from strong northwesterly wind shear. Wind shear had pushed the bulk of clouds and convection (rising air that forms the thunderstorms that make up a tropical cyclone) to the southeast of the center. Sheared convection and initial frontal features indicate that the system is undergoing extra-tropical transition.
In general, wind shear is a measure of how the speed and direction of winds change with altitude. Tropical cyclones are like rotating cylinders of winds. Each level needs to be stacked on top each other vertically in order for the storm to maintain strength or intensify. Wind shear occurs when winds at different levels of the atmosphere push against the rotating cylinder of winds, weakening the rotation by pushing it apart at different levels.
When a storm becomes extra-tropical, it means that a tropical cyclone has lost its “tropical” characteristics. The National Hurricane Center defines “extra-tropical” as a transition that implies both poleward displacement (meaning it moves toward the north or south pole) of the cyclone and the conversion of the cyclone’s primary energy source from the release of latent heat of condensation to baroclinic (the temperature contrast between warm and cold air masses) processes. It is important to note that cyclones can become extra-tropical and retain winds of hurricane or tropical storm force.
The Joint Typhoon Warning Center or JTWC issued the final warning on this system on April 9. On April 10, extra-tropical cyclone Harold continued to move through the South Pacific Ocean and weaken. The storm is no threat to land areas.
Tropical cyclones/hurricanes are the most powerful weather events on Earth. NASA’s expertise in space and scientific exploration contributes to essential services provided to the American people by other federal agencies, such as hurricane weather forecasting.
Apr. 10, 2020 – NASA Gets a 3-D Look at Tropical Cyclone Harold
Tropical Cyclone Harold became an extra-tropical cyclone on April 10, but on April 4, when it was a Category 4 cyclone, the most powerful yet of 2020, it made landfall on the South Pacific nation of Vanuatu.
Just prior to the landfall, the Global Precipitation Measurement mission or GPM core satellite captured data on the storm which was used to model the storm in 3-D. Data revealed the storm was about 10 km high (6.2 miles) and about 200 km (125 miles) wide.
This animation provides a view of precipitation in 3-D from GPM’s Dual- frequency Precipitation Radar (DPR) and surface rain rates (mm/hr) from GPM’s Microwave Imager (GMI) of Cyclone Harold in the South Pacific on April 6, 2020. The camera pushes in to reveal the inner precipitation rates of the storm.
Tropical Cyclone Harold developed from a low pressure system that was observed to the east of Papua New Guinea last week, and has tracked to the southeast, where it has already caused flooding and loss of life in the Solomon Islands. Early reports from Vanuatu indicate heavy flooding and property damage. Harold is forecast to continue to Fiji later this week.
Credit: NASA Goddard/Scientific Visualization Studio
Visualizers: Greg Shirah, Kel Elkins, Alex Kekesi
NASA generated rainfall maps to show the excessive rainfall generated by powerful Tropical Cyclone Harold from the Solomon Islands to the island of Tonga in the South Pacific. Satellite data was used to calculate the rainfall generated as Harold moved through the Southern Pacific Ocean. NASA also provided infrared imagery on Harold.
Harold’s final warning was issued from the Joint Typhoon Warning Center or JTWC on April 9, after the storm passed by the island of Tonga.
Cloud Top Temperatures in Infrared Data
One of the ways NASA researches tropical cyclones is using infrared data that provides temperature information. The AIRS instrument aboard NASA’s Aqua satellite captured a look at those temperatures. Cloud top temperatures provide information to forecasters about where the strongest storms are located within a tropical cyclone. Tropical cyclones do not always have uniform strength, and some sides have stronger sides than others. The stronger the storms, the higher they extend into the troposphere, and the colder the cloud temperatures. NASA then provides data to forecasters for incorporation into their forecasting.
On Apr. 8, NASA’s Aqua satellite analyzed Tropical Cyclone Harold using the Atmospheric Infrared Sounder or AIRS instrument when it was a major hurricane. AIRS found coldest cloud top temperatures as cold as or colder than minus 80 degrees Fahrenheit (minus 62.2 Celsius). Credit: NASA JPL/Heidar Thrastarson
On April 8 at 0141 UTC (April 7 at 9:41 p.m. EDT) NASA’s Aqua satellite analyzed the storm using the Atmospheric Infrared Sounder or AIRS instrument when it was major hurricane. AIRS found coldest cloud top temperatures as cold as or colder than minus 80 degrees Fahrenheit (minus 62.2 Celsius). NASA research has shown that cloud top temperatures that cold indicate strong storms that have the capability to create heavy rain.
Visualizing Harold’s Heavy Rainfall
Harold’s path of heavy rain from April 2 to 9 was calculated and mapped in an animation created at NASA’s Goddard Space Flight Center in Greenbelt, Maryland.
The animation shows the heavy precipitation associated with Tropical Cyclone Harold as it progresses from the Solomon Islands on April 2, 2020 to its movement beyond the island of Tonga on April 8. Harold’s core region produced precipitation rates in excess of 30 millimeters per hour, which is equivalent to a 7-inch-deep rain accumulation if the core region were to remain over a given location for 6 hours. The precipitation estimates in this animation come from the IMERG multi-satellite algorithm developed by NASA and run in near real-time.
The precipitation estimates in this animation come from the IMERG multi-satellite algorithm developed by NASA and run in near real-time.
This animation shows the heavy precipitation associated with Tropical Cyclone Harold as it progresses from the Solomon Islands (upper left) on April 2, 2020 to its movement beyond the island of Tonga on April 8 (lower right). Harold’s core region produced precipitation rates in excess of 30 millimeters per hour, which is equivalent to a 7-inch-deep rain accumulation if the core region were to remain over a given location for 6 hours. The precipitation estimates in this animation come from the IMERG multi-satellite algorithm developed by NASA and run in near real-time. Credit: NASA/JAXA, B. Jason West and Owen Kelley
What is NASA’s IMERG?
NASA’s Integrated Multi-satellitE Retrievals for GPM or IMERG, is a NASA satellite rainfall product. The near-real time rain estimates come from the NASA’s IMERG, which combines observations from a fleet of satellites, in near-real time, to provide near-global estimates of precipitation every 30 minutes. By combining NASA precipitation estimates with other data sources, we can gain a greater understanding of major storms that affect our planet.
Instead, what the IMERG does is “morph” high-quality satellite observations along the direction of the steering winds to deliver information about rain at times and places where such satellite overflights did not occur. Information morphing is particularly important over the majority of the world’s surface that lacks ground-radar coverage. Basically, IMERG fills in the blanks between weather observation stations.
Harold’s Status on April 9, 2020
At 10 a.m. EDT (1500 UTC), JTWC’s final warning on Harold noted that the system had weakened to the strength of a Category 1 hurricane on the Saffir-Simpson Hurricane Wind scale with maximum sustained winds near 80 knots (92 mph/148 kph). Harold was located near latitude 26.7 degrees south and longitude 166.1 degrees west, approximately 426 nautical miles south-southeast of Niue and has tracked east southeastward at 30 knots (35 mph/56 kph).
NASA Finds Harold Hit by Wind Shear
On April 9, infrared imagery, from the AIRS instrument aboard NASA’s Aqua satellite, revealed that strong, persistent northwesterly vertical wind shear continues to displace the bulk of central convection and thunderstorms to the south and southeast of Harold’s center.
Global Precipitation Measurement (GPM) core satellite’s Microwave Imager (GMI) instrument still showed a well-defined microwave eye feature and tightly curved shallow banding of thunderstorms. However, the JTWC noted that the imagery indicates only limited deep convective banding over the southern semicircle
What is Wind Shear?
In general, wind shear is a measure of how the speed and direction of winds change with altitude. Tropical cyclones are like rotating cylinders of winds. Each level needs to be stacked on top each other vertically in order for the storm to maintain strength or intensify. Wind shear occurs when winds at different levels of the atmosphere push against the rotating cylinder of winds, weakening the rotation by pushing it apart at different levels.
JTWC forecasters said, “Additionally, Harold will undergo extra-tropical transition as it accelerates east-southeastward within the mid-latitude westerlies and is forecast to complete extra-tropical transition by 12 hours as the system gains frontal characteristics.”
What does Extra-tropical Mean?
When a storm becomes extra-tropical, it means that a tropical cyclone has lost its “tropical” characteristics. The National Hurricane Center defines “extra-tropical” as a transition that implies both poleward displacement (meaning it moves toward the north or south pole) of the cyclone and the conversion of the cyclone’s primary energy source from the release of latent heat of condensation to baroclinic (the temperature contrast between warm and cold air masses) processes. It is important to note that cyclones can become extratropical and retain winds of hurricane or tropical storm force.
Tropical cyclones/hurricanes are the most powerful weather events on Earth. NASA’s expertise in space and scientific exploration using a fleet of satellites contributes to essential services provided to the American people by other federal agencies, such as hurricane weather forecasting.
Apr. 08, 2020 – NASA Finds Very Heavy Rainfall in Major Tropical Cyclone Harold
On April 8, Tropical Cyclone Harold is a major hurricane, a Category 4 on the Saffir-Simpson Hurricane Wind Scale, as it exits Fiji and heads toward the island of Tonga. NASA used satellite data to calculate the rainfall generated by this powerful and destructive storm in the Southern Pacific Ocean.
This animation shows the heavy precipitation associated with Tropical Cyclone Harold as it progresses from the Solomon Islands (upper left) on April 2, 2020, explosively intensifies on April 3, reaches Vanuatu (center) as a Category 4 storm on April 5 before briefly attaining Category 5 status on April 6 and passing just south of Fiji (center right) on April 7 as a Category 4 storm. Periodically, Harold’s core region produced precipitation rates in excess of 30 millimeters per hour, which is equivalent to a 7-inch-deep rain accumulation if the core region were to remain over a given location for 6 hours. The precipitation estimates in this animation come from the IMERG multi-satellite algorithm developed by NASA and run in near real-time. Credit: NASA/JAXA, B. Jason West and Owen Kelley
Harold brought flooding rains and strong hurricane-force winds to the South Pacific island nation of Fiji on Wednesday, April 8. The Fiji Meteorological Service noted that Harold’s strength ranked in the highest category of five, when passed over Fiji’s south at about midday (local time). Earlier in the week, Harold caused damages and communications outages when it passed over Vanuatu on April 7, and killed dozens of people in the Solomon Islands.
Visualizing Harold’s Heavy Rainfall
At NASA’s Goddard Space Flight Center in Greenbelt, Maryland, the heavy rain generated from Harold from April 2 to 8 was calculated and mapped in an animation.
“This animation shows the heavy precipitation associated with Tropical Cyclone Harold as it progresses from the Solomon Islands on April 2, 2020, explosively intensifies on April 3, reaches Vanuatu as a Category 4 storm on April 5 before briefly attaining Category 5 status on April 6 and passing just south of Fiji on April 7 as a Category 4 storm,” said B. Jason West, Science Data Analyst for the Precipitation Processing System (PPS) at NASA Goddard.
The data showed that periodically, Harold’s core region produced precipitation rates were in excess of 30 millimeters per hour (mm/h), which is equivalent to a 7-inch-deep rain accumulation if the core region were to remain over a given location for 6 hours. The precipitation estimates in this animation come from the IMERG multi-satellite algorithm developed by NASA and run in near real-time.
What is NASA’s IMERG?
NASA’s Integrated Multi-satellitE Retrievals for GPM or IMERG, is a NASA satellite rainfall product. The near-real time rain estimates come from the NASA’s IMERG, which combines observations from a fleet of satellites, in near-real time, to provide near-global estimates of precipitation every 30 minutes. By combining NASA precipitation estimates with other data sources, we can gain a greater understanding of major storms that affect our planet.
Instead, what the IMERG does is “morph” high-quality satellite observations along the direction of the steering winds to deliver information about rain at times and places where such satellite overflights did not occur. Information morphing is particularly important over the majority of the world’s surface that lacks ground-radar coverage. Basically, IMERG fills in the blanks between weather observation stations.
Harold’s Status on April 8, 2020
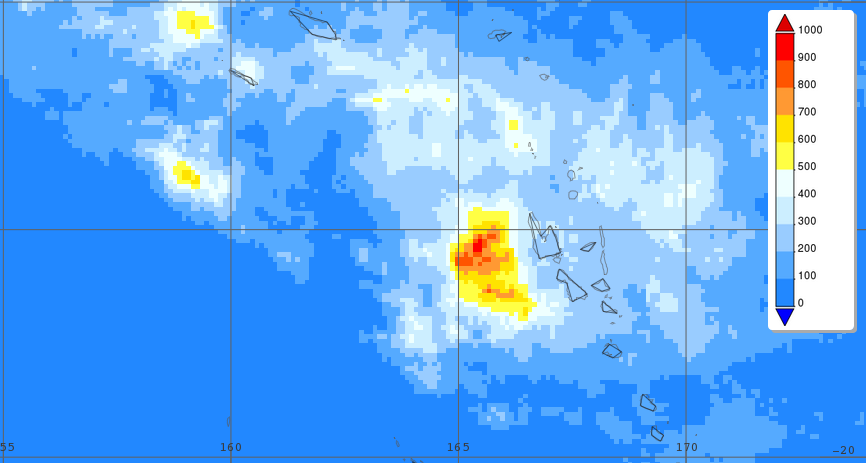
This IMERG image estimates rainfall from March 30 to April 7 just west of Vanuatu in the South Pacific. The deeper red areas indicated rainfall totals up to almost 750 mm (30 inches) west and east of Vanuatu. Credit: NASA/JAXA, Steve Lang
The Joint Typhoon Warning Center or JTWC noted that Harold had maximum sustained winds near 120 knots (138 mph/222 kph) on April 8 at 10 a.m. EDT (1500 UTC). That makes it a Category 4 hurricane and a major storm. Harold was located near latitude 21.2 degrees south and longitude 176.9 degrees west, approximately 248 nautical miles southeast of Suva, Fiji, and has tracked east-southeastward at 23 knots (26 mph/43 kph).
What is Ahead for Harold
JTWC forecasters said what lies ahead for Harold is a hostile environment as vertical wind shear (winds that blow at different levels of the atmosphere that can tear a storm apart) will increase, and Harold will track through cooler waters (that will not help maintain thunderstorm development which a tropical cyclone needs to maintain structure and strength). On April 9, Harold is expected to begin interacting with the mid-latitude westerlies (winds) and start extratropical transition.
Tropical cyclones/hurricanes are the most powerful weather events on Earth. NASA’s expertise in space and scientific exploration using a fleet of satellites contributes to essential services provided to the American people by other federal agencies, such as hurricane weather forecasting.
Apr. 07, 2020 – NASA Finds Tropical Cyclone Harold between Vanuatu and Fiji
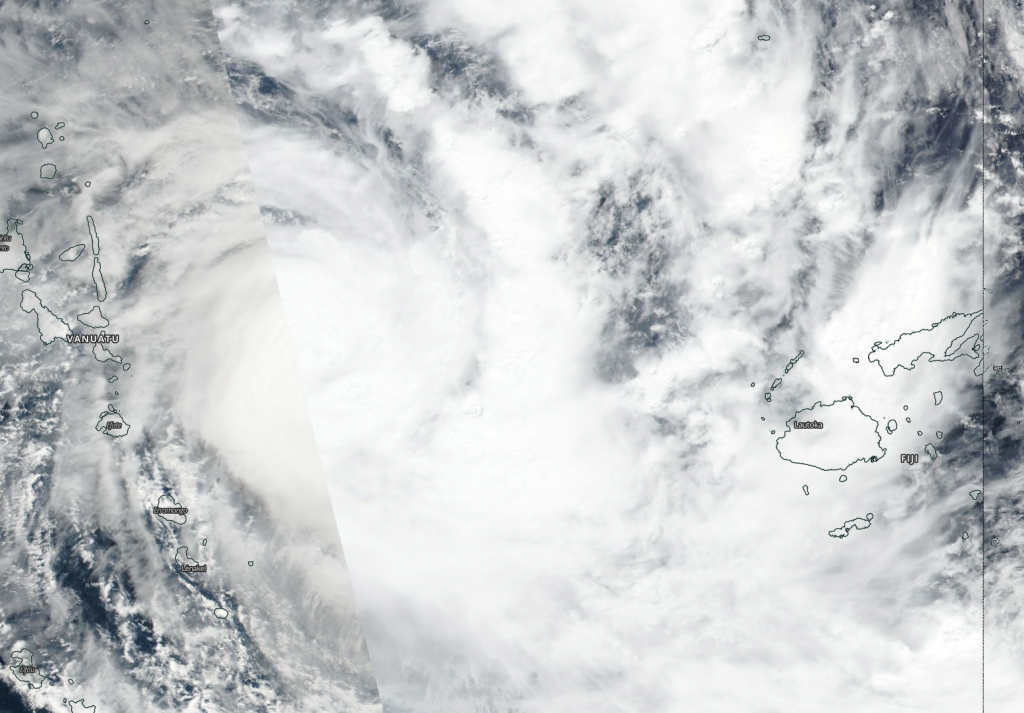
Tropical Cyclone Harold brought heavy rains and hurricane-force winds to Vanuatu and was moving toward Fiji when NASA-NOAA’s Suomi NPP satellite provided forecasters with an image of the storm.
NASA-NOAA’s Suomi NPP satellite provided forecasters with a visible image of Tropical Cyclone Harold on April 7 between Vanuatu (left) and Fiji (right). Credit: NASA Worldview, Earth Observing System Data and Information System (EOSDIS)
Visible imagery from NASA satellites help forecasters understand if a storm is organizing or weakening. The Visible Infrared Imaging Radiometer Suite (VIIRS) instrument aboard Suomi NPP provided a visible image of Harold on April 7, which showed the western quadrant of the storm east of Vanuatu while eastern quadrant was already affecting Fiji.
The shape of a tropical cyclone provides forecasters with an idea of its organization and strength, and NASA-NOAA’s Suomi NPP satellite showed powerful thunderstorms circling the low-level center of circulation with thick, fragmented bands of thunderstorms mostly on the eastern side of the storm. The eye was not visible on the Suomi NPP image. Forecasters at the Joint Typhoon Warning Center noted, “Animated enhanced infrared satellite imagery shows deep convection surrounding and obscuring the low level circulation center, possibly indicating an eye may be trying to form.”
Warnings are in effect for the Fiji group of islands. On April 7, warnings in Fiji included a hurricane warning for Kadavu and Ono-I-Lau. A storm warning is in effect for southern parts of Viti Levu [from Momi through to Pacific Harbour], Beqa, Vatulele, Matuku and Vatoa. A storm warning remains in force for Moala, Totoya, Vanuavatu and is now also in force for Yasawa and Mamanuca group, the rest of Viti Levu, Lomaiviti and the rest of Southern Lau group.
A gale warning remains in force for Lakeba and Cicia and the rest of the Lau Group, Vanua Levu, Taveuni and nearby smaller islands. A strong wind warning remains in force for the rest of Fiji.
At 10 a.m. EDT (1500 UTC) on April 7, Harold had maximum sustained winds near 110 knots (127 mph/204 kph) making it a Category 3 hurricane on the Saffir-Simpson Hurricane Wind Scale. Harold was centered near latitude 17.7 degrees south and longitude 174.9 degrees east, about 225 nautical miles west of Suva, Fiji. Harold was moving to the east-southeast at 14 knots (16 mph/26 kph).
The Joint Typhoon Warning Center or JTWC forecast said, “Through the next 24 hours, the intensity should remain around 105 to 110 knots (121 to 127 mph/194 to 204 kph), although the tropical cyclone may get stronger if an eye were to form.”
JTWC forecasts Harold to make a brief landfall over Fiji on April 7 around 8 p.m. EDT (April 8 at 0000 UTC) and move to the southeast near Tonga.
Tropical cyclones/hurricanes are the most powerful weather events on Earth. NASA’s expertise in space and scientific exploration contributes to essential services provided to the American people by other federal agencies, such as hurricane weather forecasting.
Apr. 06, 2020 – NASA Finds Heavy Rainfall in Powerful Tropical Cyclone Harold
One of NASA’s satellites that can measure the rate in which rainfall is occurring in storms passed over powerful Tropical Cyclone Harold just after it made landfall in Vanuatu in the Southern Pacific Ocean.
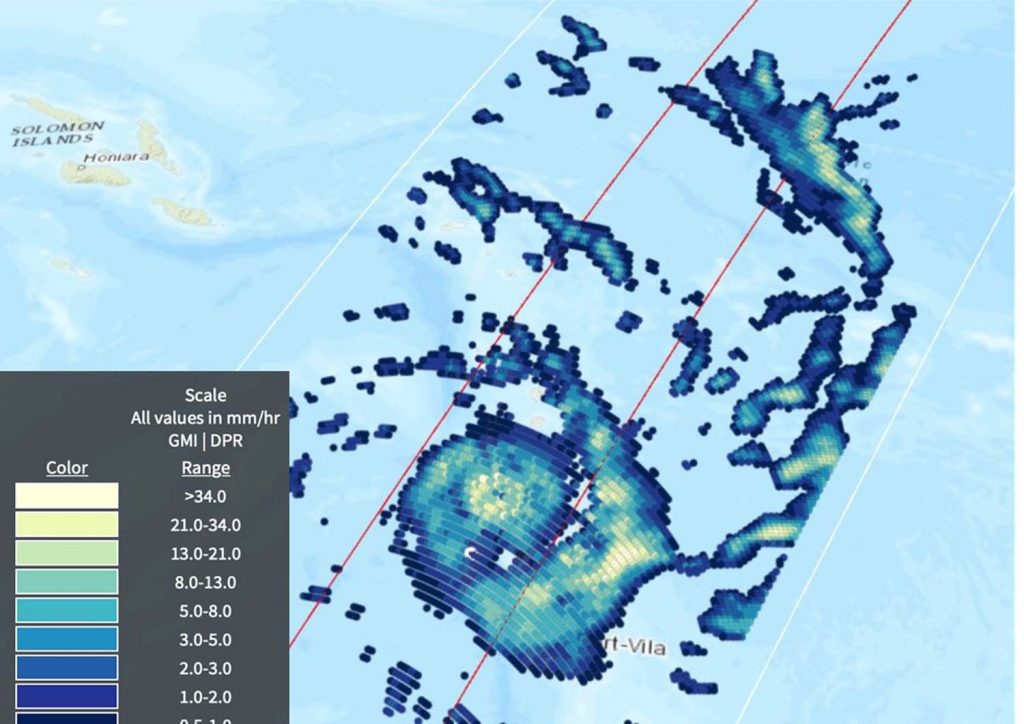
On April 6, 2020, the GPM satellite provided an estimate of rainfall rates in powerful Tropical Cyclone Harold over Vanuatu in the Southern Pacific Ocean. The highest rates were in the rain band to the southeast of the eye at 48 mm (1.8 inches) per hour. Near the eye rates in some areas also exceeded 40 mm (1.6 inches) per hr. Credit: JAXA/Jason West, NASA EOSDIS
Tropical Cyclone Harold developed from a low-pressure system that was observed to the east of Papua New Guinea last week, and has tracked to the southeast, where it has already caused flooding and loss of life in the Solomon Islands.
Now a Category 4 cyclone, the most powerful yet of 2020, Harold made landfall on the South Pacific nation of Vanuatu on Monday, April 6, not long before the Global Precipitation Measurement mission or GPM passed overhead. GPM’s Dual-frequency Precipitation Radar and GPM Microwave Imager data provided data on rainfall rates. “The highest rates were in the rain band to the southeast of the eye, at 48 mm (1.8 inches) per hour,” said B. Jason West, Science Data Analyst at NASA’s Goddard Space Flight Center in Greenbelt, Md. “Near the eye, rates in some areas also exceeded 40 mm (1.6 inches) per hour.”
Early reports from Vanuatu indicate heavy flooding and property damage.
On April 6, 2020, the GPM satellite provided an estimate of rainfall rates in powerful Tropical Cyclone Harold over Vanuatu in the Southern Pacific Ocean. The highest rates were in the rain band to the southeast of the eye at 48 mm (1.8 inches) per hour. Near the eye rates in some areas also exceeded 40 mm (1.6 inches) per hr. Credit: JAXA/NASA, Steve Lang
The Vanuatu Meteorological Service (VMS) posted Tropical Cyclone Warning Number 27 for the Sanma, Penama, Malampa and Shefa Provinces. At 8 a.m. EDT (11:00 p.m. Vanuatu local time), VMS noted that “Severe Tropical Cyclone Harold was located at latitude 16.0 degrees south and longitude 168.8 degrees east, about 80 kilometers (50 miles) east northeast of Ambrym and 105 km (65 miles) northeast of Epi. Severe Tropical Cyclone Harold has been moving in an east-southeasterly direction at 19 kph (10 knots/12 mph) in the past 3 hours. Maximum sustained winds close to the center are estimated at 230 kph (125 Knots/143 mph).
The VMS warning noted, “Damaging gale force winds, destructive storm force winds and hurricane force winds with heavy rainfalls and flash flooding over low lying areas and areas close to river banks including coastal flooding is expected over Sanma, Penama, Malampa and Shefa Provinces including Torba province tonight. Very rough to phenomenal seas with heavy to phenomenal swells are expected over northern and central open and coastal waters tonight as the system continues to move over the Central Islands of Vanuatu. High Seas wind warning and a Marine strong wind warning are current for all coastal and open waters of Vanuatu. People, including sea-going vessels are strongly advised not to go out to sea within affected area until the system has moved out of the area.”
The Vanuatu National Disaster Management Office (NDMO) advises that Red Alert is in effect for Sanma, Penama, Malampa and Shefa Provinces, while Yellow Alert for Torba provinces.
The Vanuatu Meteorology and Geo-Hazards Department updates are available on VMGD’s website: https://www.vmgd.gov.vu and on its Facebook page: https://www.facebook.com/vmgd.gov.vu.
Harold is forecast to continue to Fiji later this week.
Apr. 06, 2020 – NASA Finds Tropical Storm Irondro’s Heavy Rainfall Displaced
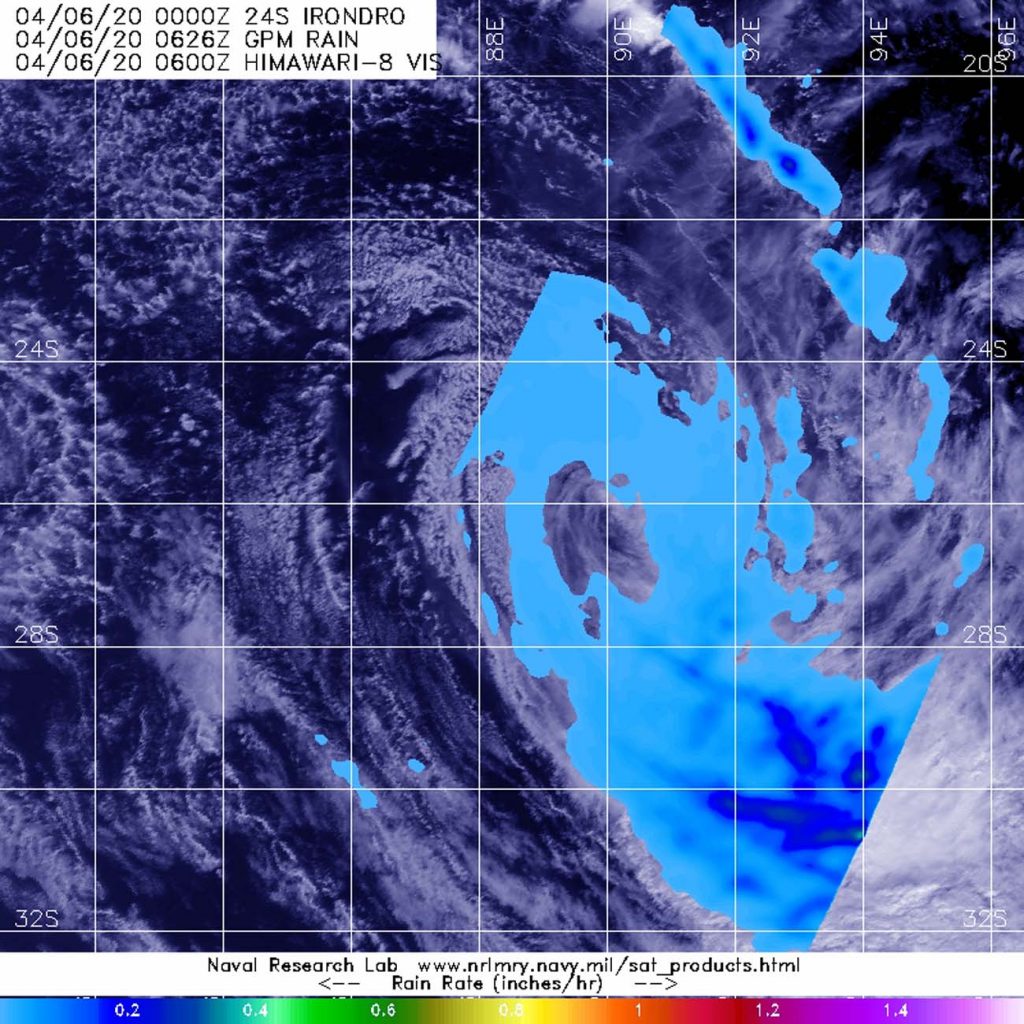
NASA analyzed Tropical Storm Irondro’s rainfall and found heaviest rainfall was being pushed far southeast of the center because of strong wind shear.
The GPM core satellite passed over Tropical Storm Irondro on Apr. 6 at 2:26 a.m. EDT (0626 UTC). Heaviest rainfall (orange), located southeast of the center, was falling at a rate 1 inch (25 mm) per hour. Light rain (blue) was found throughout the rest of the storm. Credit: NASA/JAXA/NRL
NASA has the unique capability of peering under the clouds in storms and measuring the rate in which rain is falling. Global Precipitation Measurement mission or GPM core passed over Irondro from its orbit in space and measured rainfall rates throughout the storm on Apr. 6 at 2:26 a.m. EDT (0626 UTC). Heaviest rainfall was being pushed southeast of the center where it was falling at a rate of 1 inch (25 mm) per hour. Light rain was found throughout the rest of the storm.
In general, wind shear is a measure of how the speed and direction of winds change with altitude. Tropical cyclones are like rotating cylinders of winds. Each level needs to be stacked on top each other vertically in order for the storm to maintain strength or intensify. Wind shear occurs when winds at different levels of the atmosphere push against the rotating cylinder of winds, weakening the rotation by pushing it apart at different levels. Winds from the northwest were pushing against the storm and displacing the heaviest rainfall southeast of the center.
On Apr. 6 at 4 a.m. EDT (0900 UTC), the Joint Typhoon Warning Center issued their final warning on Irondro. Despite the wind shear, Tropical Storm Irondro had maximum sustained winds near 40 knots (46 mph/74 kph). Irondro was located near latitude 26.7 degrees south and longitude 89.5 degrees east. Irondro is becoming extra-tropical and is expected to become a cold core low pressure area later in the day.
Typhoons/hurricanes are the most powerful weather events on Earth. NASA’s expertise in space and scientific exploration contributes to essential services provided to the American people by other federal agencies, such as hurricane weather forecasting.
Both the Japan Aerospace Exploration Agency, JAXA and NASA manage GPM.
Apr. 03, 2020 – NASA-NOAA Satellite Catches Tropical Cyclone Harold Develop Near Solomon Islands
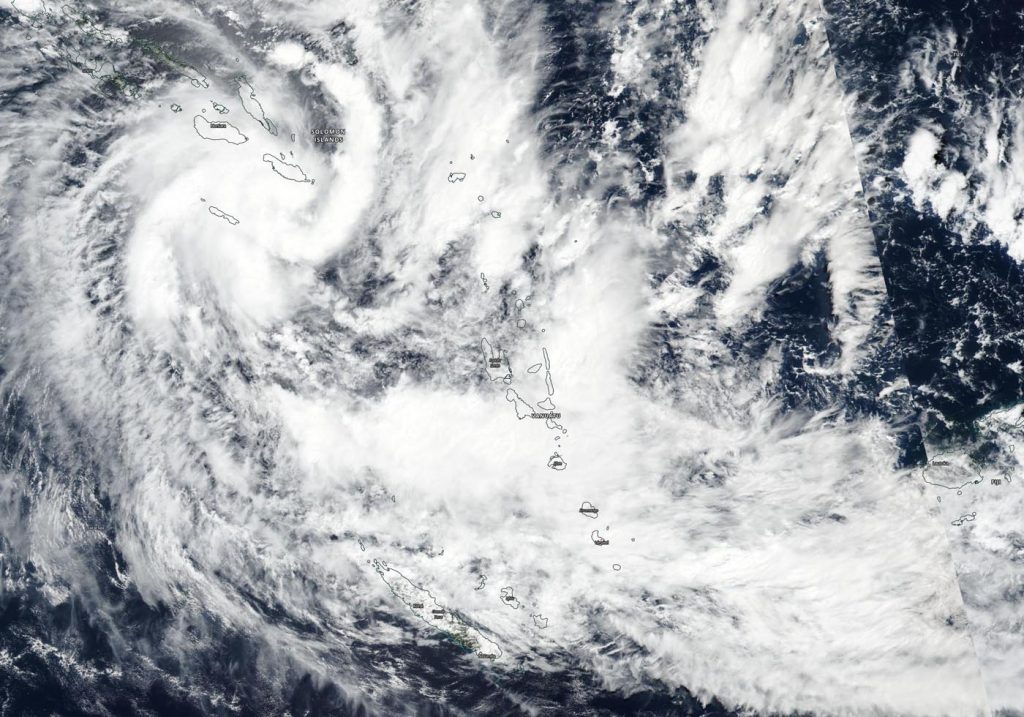
NASA-NOAA’s Suomi NPP satellite passed over the Southern Pacific Ocean and provided forecasters with a visible image of newly formed Tropical Cyclone Harold. Harold formed near the Solomon Islands and now threatens Vanuatu, which has already issued some warnings.
NASA-NOAA’s Suomi NPP satellite captured a visible image of Tropical Cyclone Harold over the Solomon Islands in the Southern Pacific Ocean on April 3, 2020. Credit: NASA Worldview, Earth Observing System Data and Information System (EOSDIS)
The Visible Infrared Imaging Radiometer Suite (VIIRS) instrument aboard Suomi NPP provided a visible image of Tropical Cyclone Harold on April 3, 2020. The VIIRS image showed the center near the Solomon Islands, with bands of thunderstorms wrapping tightly into the low-level center from the southeast and western quadrants. A long band of thunderstorms on the eastern side of the storm stretched from southeast of the center to northeast of the center. Outer fragmented bands of thunderstorms extended southeast to Vanuatu. Microwave satellite imagery has detected an eye forming.
At 1500 UTC, (10 a.m. EDT) Tropical cyclone Harold was located near latitude 13.0 degrees south and longitude 163.2 degrees east, about 429 nautical miles northwest of Port Vila, Vanuatu. Harold was moving to the south-southeast and had maximum sustained winds near 55 knots (62 mph/102 kph).
On April 3 EDT (April 4 local time), the Vanuatu Meteorology and Geo-Hazards Department, Port Vila issued Tropical Cyclone Warning Number 4 on Tropical Cyclone Harold for Torba and Sanma. The warning noted, “damaging gale force winds of 75 kph (40 knots/46 mph), gusting to 105 kph (55 Knots/65 mph) are expected to extend closer to Torba and Sanma today.” For updated forecasts, visit: https://www.vmgd.gov.vu/
The Joint Typhoon Warning Center (JTWC) noted that rapid intensification is possible. JTWC expects Harold to move south-southeast and intensify to hurricane strength. JTWC currently forecasts Harold to cross over Vanuatu on April 6 on its track to the southeast.
Tropical cyclones/hurricanes are the most powerful weather events on Earth. NASA’s expertise in space and scientific exploration contributes to essential services provided to the American people by other federal agencies, such as hurricane weather forecasting.