Oct. 31, 2018 – NASA Gets An Infrared View of Hurricane Oscar
NASA’s Aqua satellite passed over the North Atlantic Ocean and gathered temperature data on Hurricane Oscar. The data showed the bulk of strong storms were in the northwestern quadrant as Oscar began transitioning into an extra-tropical storm.
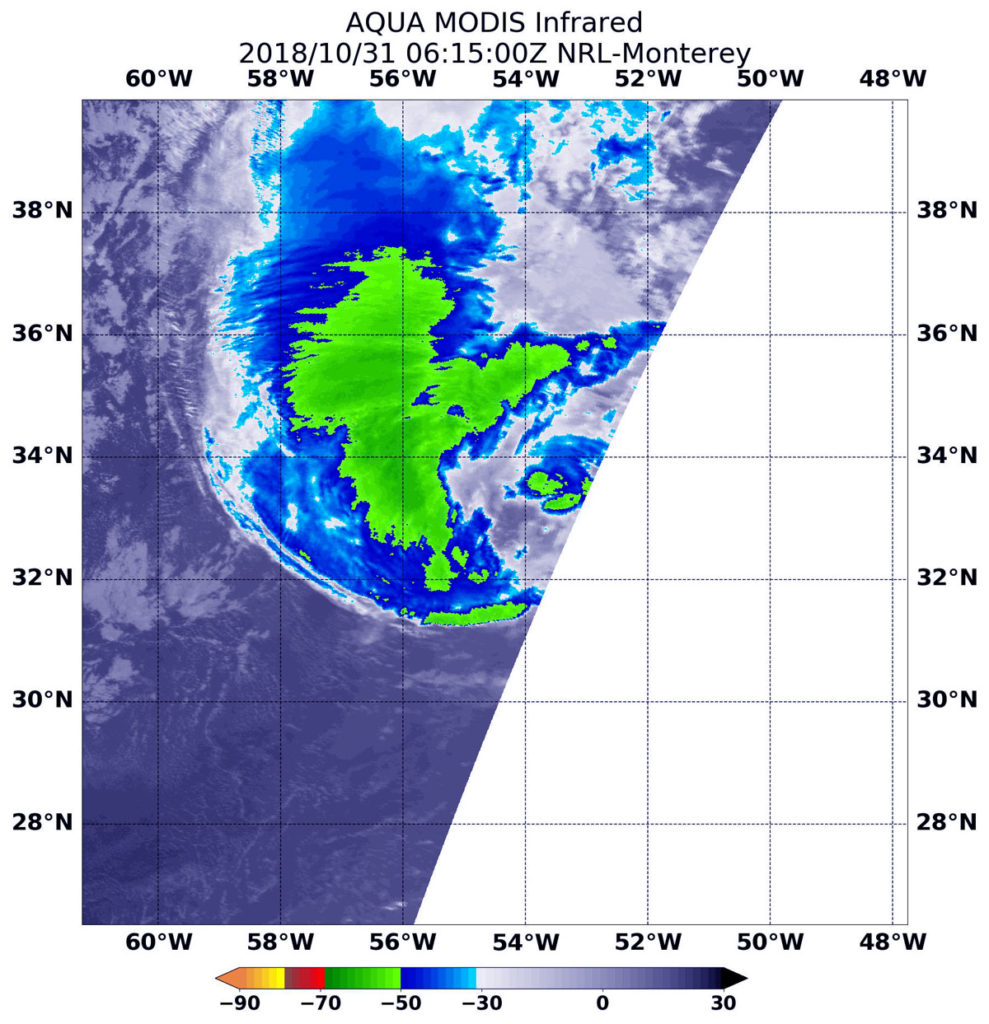
At 2:15 a.m. EDT (0615 UTC) on Oct. 31, the MODIS instrument that flies aboard NASA’s Aqua satellite gathered infrared data on Hurricane Oscar. Strongest thunderstorms circled the center and were in a thick band west of center where cloud top temperatures were as cold as minus 63 degrees Fahrenheit (minus 53 Celsius). Credit: NASA/NRL
On Oct. 31 at 2:15 a.m. EDT (0615 UTC) the MODIS instrument that flies aboard NASA’s Aqua satellite gathered infrared data on Oscar. Infrared data provides temperature information. Strongest thunderstorms were west and northwest of the center where MODIS found cloud top temperatures as cold as minus 63 degrees Fahrenheit (minus 53 Celsius). NASA research has shown that cloud tops with temperatures that cold were high in the troposphere and have the ability to generate heavy rain.
At 5 a.m. EDT (0900 UTC) on Oct. 31 the center of Hurricane Oscar was located near latitude 34.1 degrees north and longitude 53.6 degrees west. That’s about 660 miles (1,060 km) east-northeast of Bermuda. Oscar is moving toward the northeast near 22 mph (35 kph). A faster north-northeast to northeast motion is expected during the next few days. Maximum sustained winds have decreased to near 75 mph (120 kph) with higher gusts. The estimated minimum central pressure is 982 millibars.
The National Hurricane Center noted at 11 a.m. EDT (1500 UTC), “Oscar is quickly transforming into an extratropical low. Although there is still a little bit of deep convection just north of the center, a more prominent cloud shield extends northward from the western part of the circulation.”
NOAA’s GOES-16 satellite imagery showed Oscar’s center nearly embedded within a frontal zone and cold air moving into the back side of the system.
Oscar is expected to become an extratropical low over the north-central Atlantic Ocean by tonight, Oct. 31 (EDT). Although gradual weakening is expected during the next several days, Oscar is expected to remain a powerful post-tropical cyclone over the north-central and northeastern Atlantic Ocean into the weekend.
Although far from land, large swells generated by Oscar will affect Bermuda through Wednesday, Oct. 31.
Oct. 31, 2018 -NASA’s CloudSat Gets a Slice of Typhoon Yutu’s Eye
NASA’s CloudSat satellite captured a stunning image of Typhoon Yutu as it passed over the eye of the storm. The storm has since weakened to a tropical storm.
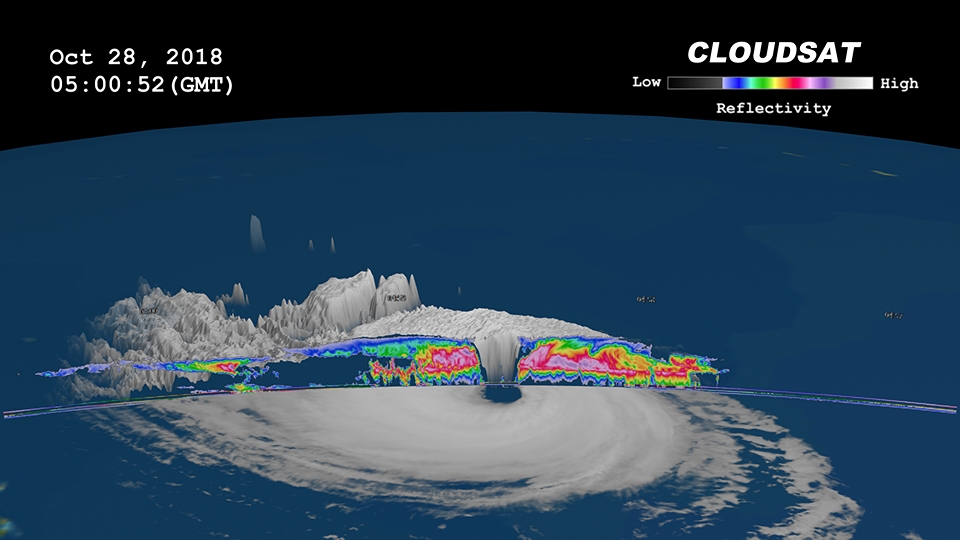
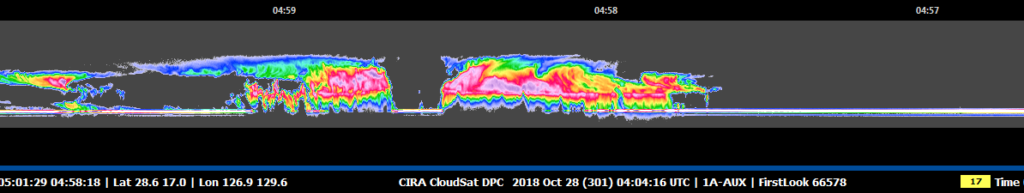
CloudSat flew over the eye of Typhoon Yutu on October 28, 2018 at 12:58 a.m. EDT (0458 UTC) as the storm was approaching the Philippines in the Western North Pacific. Yutu revealed the cirrus free eye with an outward sloping eyewall, a feature typically found in intense tropical systems. Intense areas of convection with moderate to heavy rainfall (deep red and pink colors), cloud-free areas (moats) underneath the northern portion of the cirrus canopy and cloud top height’s estimated at 14 kilometers. Lower values of reflectivity (areas of green and blue) denote smaller ice and water particle sizes typically located at top of the system (in the anvil area). Credit: Colorado State/Natalie Tourville
CloudSat flew over the eye of Typhoon Yutu on October 28, 2018 at 12:58 a.m. EDT (0458 UTC) as the storm was approaching the Philippines in the Western North Pacific. At the time of the CloudSat overpass, Typhoon Yutu was beginning a period of weakening as the storm was moving info less favorable atmospheric conditions (lower sea surface temperatures). Typhoon Yutu contained estimated sustained winds of 120 knots (138 mph) with a minimum pressure of 933 millibars (the equivalent of a Category 4 strength storm). Typhoon Yutu left a trail of destruction through Saipan, Tinian and the Mariana Islands on October 24 and 25, 2018 as a Super Typhoon (category 5 strength storm).
Natalie Tourville of Colorado State University who produced the images, said “CloudSat’s 94 GHz cloud profiling radar (CPR) passed directly over the eye of Typhoon Yutu revealing the cirrus free eye with an outward sloping eyewall, a feature typically found in intense tropical systems. The southern portion of the eyewall appears more disorganized as the thicker cloud tops are starting to disintegrate from the top down.
CloudSat flew over the eye of Typhoon Yutu on October 28, 2018 at 12:58 a.m. EDT (0458 UTC) as the storm was approaching the Philippines in the Western North Pacific. Yutu revealed the cirrus free eye with an outward sloping eyewall, a feature typically found in intense tropical systems. Intense areas of convection with moderate to heavy rainfall (deep red and pink colors), cloud-free areas (moats) underneath the northern portion of the cirrus canopy and cloud top height’s estimated at 14 kilometers. Lower values of reflectivity (areas of green and blue) denote smaller ice and water particle sizes typically located at top of the system (in the anvil area). Credit: Colorado State/Natalie Tourville
The CloudSat overpass reveals the inner details beneath the storms cloud tops. Intense areas of convection with moderate to heavy rainfall, cloud-free areas (moats) underneath the northern portion of the cirrus canopy and cloud top height’s estimated at 14 kilometers (8.7 miles). Lower values of reflectivity denote smaller ice and water particle sizes typically located at top of the system (in the anvil area). The CloudSat CPR signal attenuates in heavy rainfall when cloud droplets become larger than 3 millimeters (.11 inch) which dampen the strength of the CPR signal. This is evident by the lack of signal typically occurring beneath the melting level when frozen particles transform into liquid.”
On Oct. 31 at 5 a.m. EDT (0900 UTC) Yutu had weakened to a tropical storm with maximum sustained winds near 45 knots (52 mph/83 kph). Tropical storm Yutu was centered near 18.1 degrees north latitude and 117.5 degrees east longitude, about 291 nautical miles northwest of Manila, Philippines.
As Yutu moves toward China, Hong Kong has posted Stand-by signal #1. The Joint Typhoon Warning Center expects Yutu to re-strengthen as it moves north. The storm is forecast to dissipate off the Chinese mainland, east of Hong Kong.
Oct. 30, 2018 – Hurricane Oscar on Satellite Imagery: A One-Eyed Little Monster with a Tail
Of course, tropical cyclones have one eye and with Halloween on the horizon, false-colored infrared imagery from NASA’s Aqua satellite brought out that eye in this small tropical monster with a tail of thunderstorms.
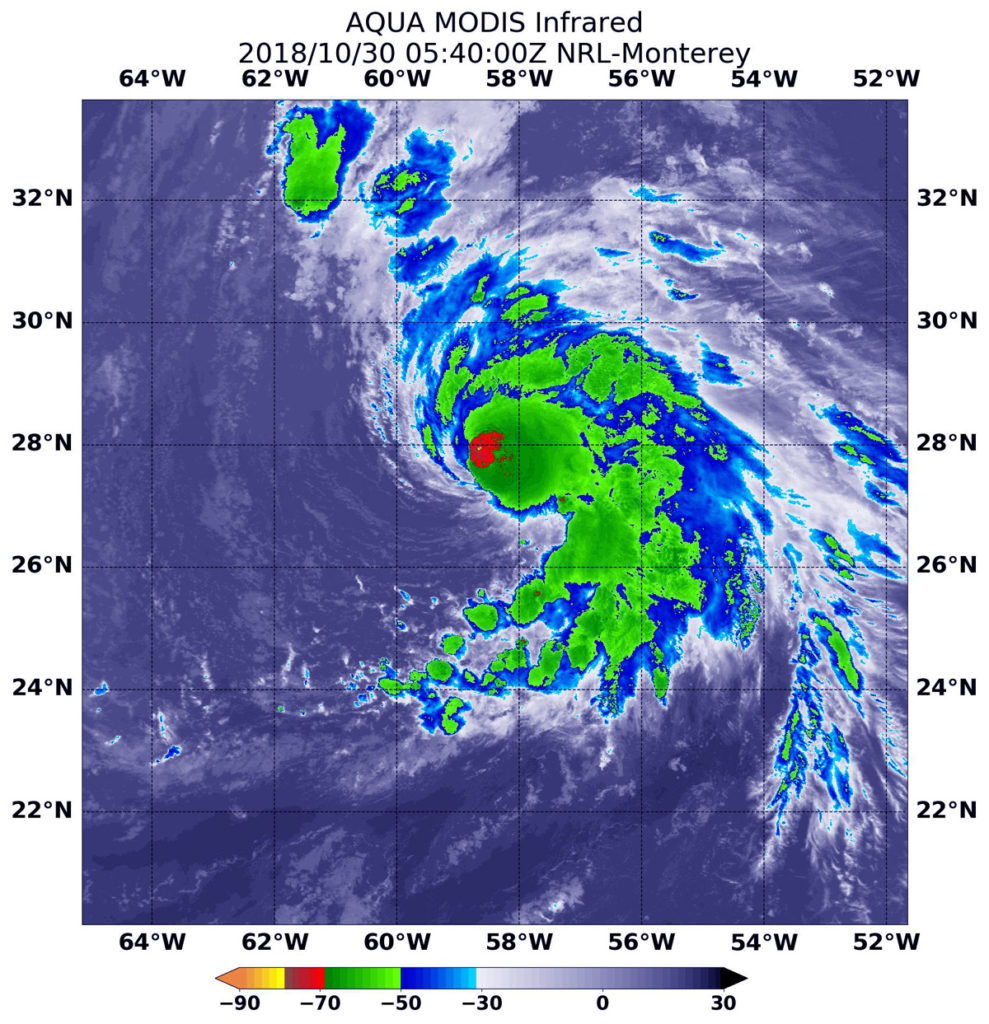
NASA’s Aqua satellite showed cloud top temperatures in strongest storms around Oscar’s eye were as cold as or colder than minus 70 degrees (red) Fahrenheit (minus 56.6 degrees Celsius). A fragmented band of thunderstorms wrapping into the center of circulation from the southeast gave the storm an appearance of having a tail. Credit: NASA/NRL
When NASA’s Aqua satellite passed over the Central Atlantic Ocean, it took Hurricane Oscar’s cloud top temperatures that helped forecasters key into where the strongest side of the storm was located.
Cloud top temperatures determine strength of the thunderstorms that make up a tropical cyclone. The colder the cloud top, the stronger the uplift in the storm that helps thunderstorm development. Basically, infrared data helps determine where the most powerful storms are within a tropical cyclone.
The Moderate Resolution Imaging Spectroradiometer or MODIS instrument aboard Aqua provided that infrared data on Oct. 30 at 1:40 a.m. EDT (0540 UTC) MODIS data showed cloud top temperatures in strongest storms around Oscar’s eye were as cold as or colder than minus 70 degrees Fahrenheit (minus 56.6 degrees Celsius). NASA research indicates very cold cloud tops with the potential to generate very heavy rainfall.
The National Hurricane Center or NHC said ” Cloud-top temperatures have warmed a bit overall, and the convective pattern is becoming more asymmetric as dry air is infiltrating the southern and eastern part of Oscar’s circulation. However, the hurricane is still producing plenty of inner-core convection and some lightning strikes.”
A fragmented band of thunderstorms wrapping into the center of circulation from the southeast gave the storm an appearance of having a tail.
MODIS imagery also showed that Oscar is a small storm. Hurricane-force winds extend outward up to 25 miles (35 km) from the center, and tropical-storm-force winds extend outward up to 90 miles (150 km).
At 11 a.m. EDT (1500 UTC) on Oct. 30 the center of Hurricane Oscar was located near latitude 29.7 North, longitude 57.7 West. Oscar is moving toward the north-northeast near 14 mph (22 kph). A north-northeastward or northeastward motion with an increase in forward speed is expected through Friday. Maximum sustained winds are near 100 mph (155 kph) with higher gusts. The estimated minimum central pressure is 972 millibars.
Gradual weakening is forecast during the next several days, but Oscar is expected to become a powerful extratropical low over the north-central Atlantic Ocean by late Wednesday, Oct. 31.
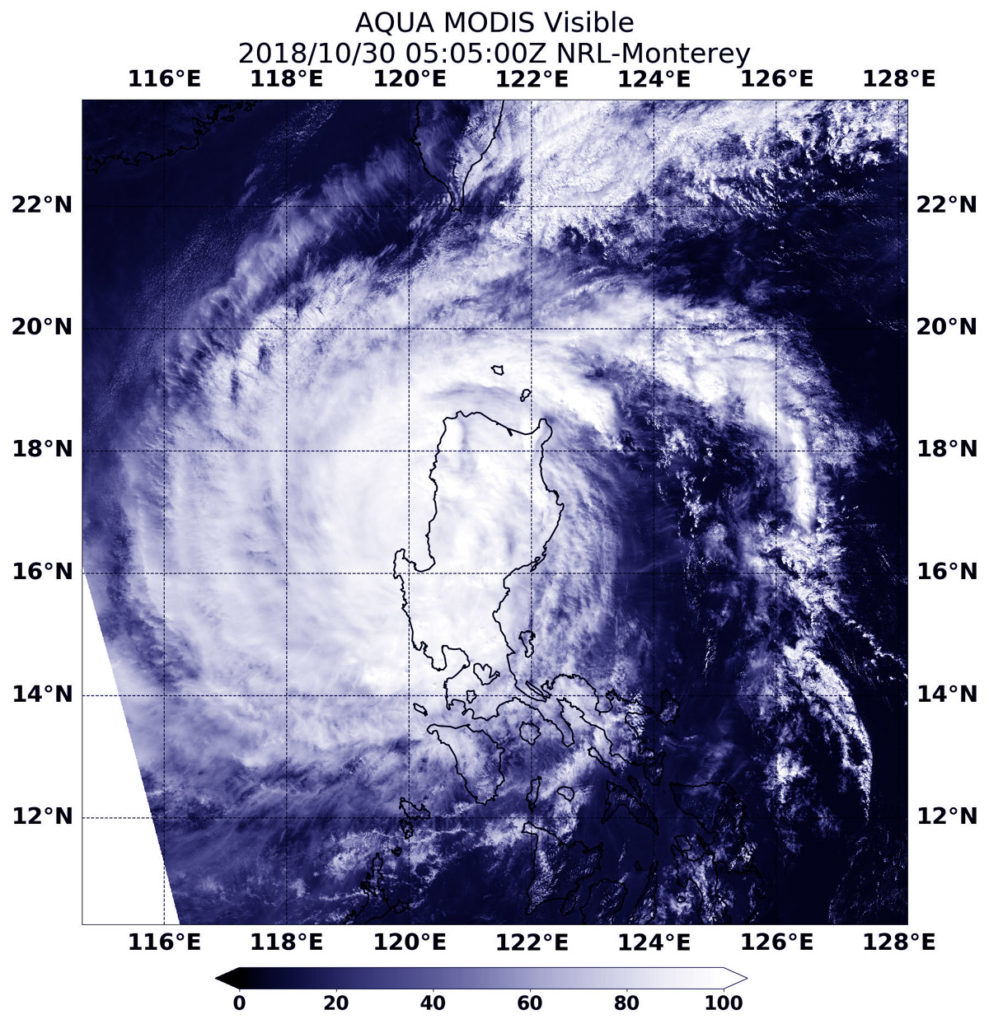
Oct. 30, 2018 – NASA’s Aqua Satellite Captures Typhoon Yutu Exiting the Northern Philippines
Visible satellite imagery from NASA’s Aqua satellite showed that Typhoon Yutu maintained its structure as it exited Luzon, the northern Philippines.
At 1:05 a.m. EDT (0505 UTC) on Oct. 30, the MODIS instrument aboard Aqua captured a visible image of Yutu as it was exiting then northern Philippines and entering the South China Sea. Visible satellite imagery showed the storm maintained a symmetrical structure despite passing over land. Credit: NASA/NRL
Yutu is known locally as Rosita in the Philippines. On Oct. 30, Yutu moved into the South China Sea after passing through La Union. La Union is a province in the Ilocos Region in the island of Luzon.
Philippines warnings that are in effect on Oct. 30 include Warning signal 3 over the Luzon provinces of La Union and Pangasinan; Warning signal 2 over the Luzon provinces of Abra, Ilocos Sur, Mt Province, Nueva Vizcaya, Nueva Ecija, Tarlac and Zambales; and Warning signal 1 over the Luzon provinces of Ilocos Norte, Apayao, Kalinga, Cagayan, Isabela, Quirino, Aurora, Bulacan, Pampanga, Bataan, Metro Manila, Rizal, Cavite, Laguna and Batangas.
At 1:05 a.m. EDT (0505 UTC) on Oct. 30, the Moderate Resolution Imaging Spectroradiometer or MODIS instrument aboard Aqua captured a visible image of Yutu as it was exiting then northern Philippines and entering the South China Sea. Visible satellite imagery showed the storm maintained a symmetrical structure despite passing over land.
At 5 a.m. EDT (0900 UTC) on Oct. 30, the center of Yutu was located near latitude 16.8 degrees north and longitude 120.0 degrees east. That’s 144 nautical miles north-northeast of Manila, Philippines. Maximum sustained winds were near 75 knots (86 mph/139 kph).
The Joint Typhoon Warning Center expects Yutu to re-strengthen in the South China Sea and then turn north. It is expected to dissipate in the Taiwan Strait, located between Taiwan and the Chinese mainland.
Typhoon Yutu, known as Rosita in the Philippines, is now threatening the Philippine Island of Luzon. The Global Precipitation Measurement mission or GPM core satellite provided a look at the heavy rainfall the storm is packing.
The GPM core observatory satellite passed above the Philippine Sea on Oct. 29, 2018 at 0212 UTC (Oct. 28 at 10:12 p.m. EDT). Those GPM data revealed that heavy rainfall within the typhoon covered an area the size of Luzon. Extreme precipitation falling at a rate of over 178 mm (7 inches) per hour was also revealed by GPM’s radar (DPR Ku Band) within powerful storms in Yutu’s southwestern eye wall. Credit: NASA/JAXA, Hal Pierce
On Oct. 24, 2018 Yutu devastated the Northern Mariana Islands of Tinian and Saipan as a super typhoon. One death has been attributed to the typhoon in the Mariana with many structures including schools and hospitals being destroyed. Typhoon Yutu weakened as it moved toward the Philippines and had maximum sustained winds of about 90 knots (103.5 mph) when the GPM core observatory satellite passed above the Philippine Sea on Oct. 29, 2018 at 0212 UTC (Oct. 28 at 10:12 p.m. EDT).
By 11 a.m. EDT (1500 UTC) on Oct. 29, Yutu’s maximum sustained winds remained at the same strength as they were earlier. Yutu was located near 16.7 degrees north latitude and 123.6 east longitude. That’s about 224 nautical miles northeast of Manila, Philippines.
The GPM core observatory satellite passed above the Philippine Sea on Oct. 29, 2018 at 0212 UTC (Oct. 28 at 10:12 p.m. EDT). Those GPM data revealed that heavy rainfall within the typhoon covered an area the size of Luzon. Extreme precipitation falling at a rate of over 178 mm (7 inches) per hour was also revealed by GPM’s radar (DPR Ku Band) within powerful storms in Yutu’s southwestern eye wall. Credit: NASA/JAXA, Hal Pierce
At NASA’s Goddard Space Flight Center in Greenbelt, Maryland, a rainfall analysis was developed using data collected by GPM’s Microwave Imager (GMI) and Dual-Frequency Precipitation Radar (DPR) instruments. Those GPM data revealed that heavy rainfall within the typhoon covered an area the size of Luzon. Extreme precipitation falling at a rate of over 178 mm (7 inches) per hour was also revealed by GPM’s radar (DPR Ku Band) within powerful storms in Yutu’s southwestern eye wall.
The GPM mission is managed by both NASA and the Japan Aerospace Exploration Agency, JAXA.
The GPM core observatory satellite passed above the Philippine Sea on Oct. 29, 2018 at 0212 UTC (Oct. 28 at 10:12 p.m. EDT). Those GPM data revealed that heavy rainfall within the typhoon covered an area the size of Luzon. Extreme precipitation falling at a rate of over 178 mm (7 inches) per hour was also revealed by GPM’s radar (DPR Ku Band) within powerful storms in Yutu’s southwestern eye wall. Credit: NASA/JAXA, Hal Pierce
The Joint Typhoon Warning Center (JTWC) predicts that typhoon Yutu will still be a powerful typhoon with winds of about 85 knots (98 mph) when it makes landfall in the Philippines. Interaction with the rugged terrain over Luzon is expected to cause Yutu to weaken to tropical storm intensity. Yutu is then expected to intensify to typhoon again as it moves into the South China Sea. Typhoon Yutu is then expected to re-curve to the east of Hong Kong.
Oct. 29, 2018 – Atlantic’s Hurricane Oscar’s Water Vapor Measured by NASA’s Terra Satellite
When NASA’s Terra satellite passed over the Central Atlantic Ocean on Oct. 16 the MODIS instrument aboard analyzed water vapor within Tropical Storm Oscar.
NASA’s Terra satellite passed over Hurricane Oscar in the Atlantic Ocean On Oct. 29 at 10:20 a.m. EDT (1420). The MODIS instrument showed highest concentrations of water vapor (brown) and coldest cloud top temperatures were around the center (over water) and in the eastern quadrant. Credits: NASA/NRL
Oscar formed as a subtropical storm in the central North Atlantic Ocean on Friday, Oct. 26 at 11 p.m. EDT. Over the weekend of Oct. 27 and 28, Oscar took on tropical characteristics and strengthened into a hurricane.
On Oct. 29 at 10:20 a.m. EDT (1420) NASA’s Terra satellite passed over Oscar and provided visible and water vapor imagery of the newest Atlantic Hurricane.
Water vapor analysis of tropical cyclones tells forecasters how much potential a storm has to develop and shows where the heaviest rainfall may be found. Water vapor releases latent heat as it condenses into liquid. That liquid becomes clouds and thunderstorms that make up a tropical cyclone. Temperature is important when trying to understand how strong storms can be. The higher the cloud tops, the colder and the stronger they are.
NASA’s Terra satellite passed over Hurricane Oscar in the Atlantic Ocean On Oct. 29 at 10:20 a.m. EDT (1420). The MODIS instrument showed a clear eye surrounded by powerful thunderstorms. Fragmented bands of thunderstorms in the eastern quadrant. Credits: NASA/NRL
The Moderate Resolution Imaging Spectroradiometer or MODIS instrument aboard Terra gathered water vapor content and temperature information. The MODIS image showed highest concentrations of water vapor and coldest cloud top temperatures circled the center and extended east. MODIS saw coldest cloud top temperatures were as cold as minus 70 degrees Fahrenheit (minus 56.6 degrees Celsius) in those areas. Storms with cloud top temperatures that cold have the capability to produce heavy rainfall.
Visible imagery from MODIS showed a clear eye surrounded by powerful thunderstorms. Fragmented bands of thunderstorms in the eastern quadrant.
The National Hurricane Center said “Oscar’s convective cloud pattern has continued to improve since the previous advisory, with a small, cloud-filled eye now apparent in visible satellite imagery and also in a recent microwave pass. In addition, cirrus outflow has been expanding in all quadrants, especially in the eastern semicircle.”
The National Hurricane Center or NHC said at 11 a.m. EDT (1500 UTC) the eye of Hurricane Oscar was located near latitude 25.8 degrees north and longitude 58.4 degrees west. That’s about 590 miles (955 km) southeast of Bermuda. Oscar is moving toward the west-northwest near 7 mph (11 kph). A turn toward the northwest at a slower forward speed is expected later today, followed by a motion toward the north tonight. Maximum sustained winds have increased to near 85 mph (140 kph) with higher gusts. Additional strengthening is forecast through Tuesday, followed by gradual weakening thereafter. The estimated minimum central pressure is 981 millibars.
On Tuesday, Oct. 30, Oscar is forecast to begin moving toward the north-northeast with an increase in forward speed. The hurricane is then expected to accelerate quickly toward the northeast through the middle of the week.
NASA uses satellite data to calculate the amount of rainfall generated from tropical cyclones, and used that capability for the Eastern Pacific Ocean’s Hurricane Willa.
A rainfall accumulation analysis was generated by totaling Integrated Multi-satellitE Retrievals for GPM (IMERG) data for the period from October 20 to 26, 2018. Hurricane Willa’s approximate 0000Z and 1200Z locations are shown on this analysis. Willa produced rainfall totals greater than 20 inches (508 mm) in the Pacific Ocean off Mexico’s coast. IMERG data also indicated that rainfall accumulations of over 15 inches (381 mm) occurred in parts of Mexico and Southeastern Texas. Credit: NASA/JAXA, Hal Pierce
Tropical Depression 24E formed on October 20, 2018 and later in the day became tropical storm Willa. The tropical depression rapidly intensified and was a category five hurricane with winds of over 161 mph (140 knots) on October 22. Willa had weakened to category three intensity when it made landfall in Sinaloa, Mexico on October 24, 2018. Moisture streaming from Willa’s remnants added to the soaking of the already water logged state of Texas. Moisture from Willa’s remnants contributed to storms over the Southeast and to the developing Nor’easter moving over the East Coast.
At NASA’s Goddard Space Flight Center in Greenbelt, Maryland a rainfall accumulation analysis was generated by totaling Integrated Multi-satellitE Retrievals for GPM (IMERG) data for the period from October 20 to 26, 2018. The IMERG rainfall accumulation data indicated that Willa produced rainfall totals greater than 20 inches (508 mm) in the Pacific Ocean off Mexico’s coast. IMERG data also indicated that rainfall accumulations of over 15 inches (381 mm) occurred in parts of Mexico and Southeastern Texas.
A rainfall accumulation analysis was generated by totaling Integrated Multi-satellitE Retrievals for GPM (IMERG) data for the period from October 20 to 26, 2018. Hurricane Willa’s approximate 0000Z and 1200Z locations are shown on this analysis. Willa produced rainfall totals greater than 20 inches (508 mm) in the Pacific Ocean off Mexico’s coast. IMERG data also indicated that rainfall accumulations of over 15 inches (381 mm) occurred in parts of Mexico and Southeastern Texas. Credit: NASA/JAXA, Hal Pierce
IMERG data are generated every half hour by NASA’s Precipitation Processing System by merging data from the satellites in the GPM Constellation, and calibrating those data with measurements from the GPM Core Observatory as well as rain gauge networks around the world. IMERG data are provided for much of the globe. Full coverage is calculated over latitudes from 60 degrees north to 60 degrees south with the remaining areas of the globe being partially covered.
The Integrated Multi-satellitE Retrievals for GPM (IMERG) creates a merged precipitation product from the GPM constellation of satellites. These satellites include DMSPs from the U.S. Department of Defense, GCOM-W from the Japan Aerospace Exploration Agency (JAXA), Megha-Tropiques from the Centre National D’etudies Spatiales (CNES) and Indian Space Research Organization (ISRO), NOAA series from the National Oceanic and Atmospheric Administration (NOAA), Suomi-NPP from NOAA-NASA, and MetOps from the European Organisation for the Exploitation of Meteorological Satellites (EUMETSAT). All of the instruments (radiometers) onboard the constellation partners are intercalibrated with information from the GPM Core Observatory’s GPM Microwave Imager (GMI) and Dual-frequency Precipitation Radar (DPR).
GPM is a joint mission between NASA and the Japan Aerospace Exploration Agency, JAXA.
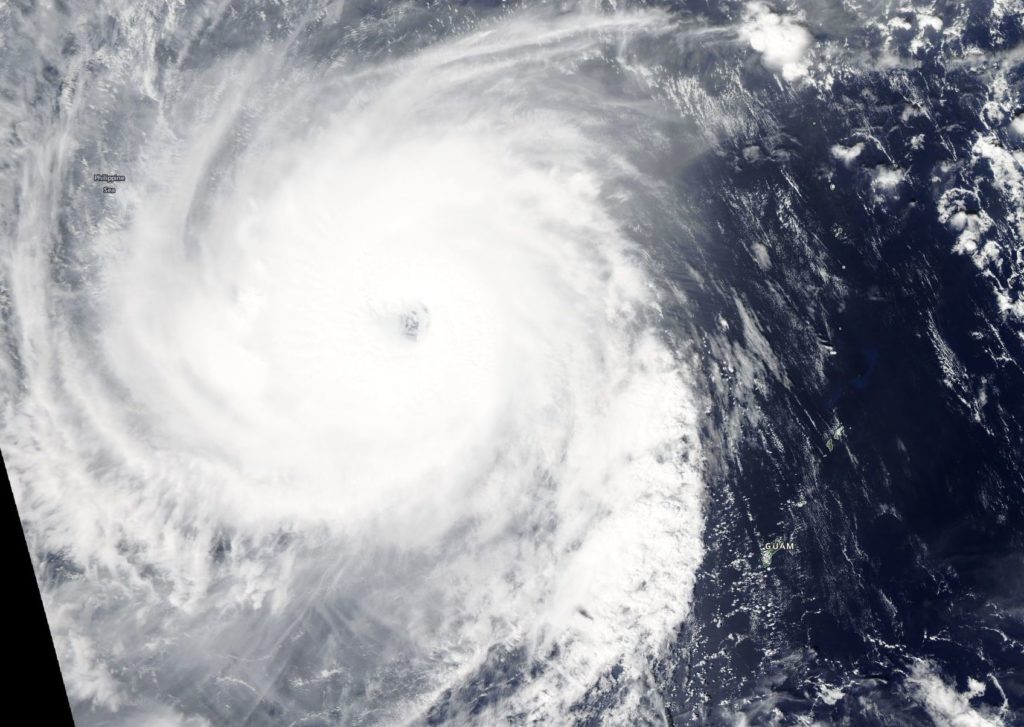
Oct. 26, 2018 – NASA’s Aqua Satellite Tracks Super Typhoon Yutu’s Oblong Eye
Visible satellite imagery from NASA’s Aqua satellite captured powerful Super Typhoon Yutu as it moved through the Philippine Sea. Yutu’s eye appeared oblong on satellite imagery.
On Oct. 25 at 1:30 p.m. CHST (local time, Guam) the MODIS instrument aboard Aqua captured a visible image of Typhoon Yutu with a 19 nautical mile oblong eye. Credit: NASA Worldview, Earth Observing System Data and Information System (EOSDIS) Credit: NASA Worldview, Earth Observing System Data and Information System (EOSDIS)
On Oct. 25 at 1:30 p.m. CHST (local time, Guam) the Moderate Resolution Imaging Spectroradiometer or MODIS instrument aboard Aqua captured a visible image of Yutu. The MODIS image showed that large typhoon Yutu continued to remain symmetric with an open 19 nautical-mile-wide eye surrounded by very thick bands of powerful thunderstorms circling the center. At the time of the image, Yutu had passed and cleared Guam.
In satellite imagery on Oct. 26, the eye had become cloud-filled. Infrared satellite imagery revealed cooler cloud tops (indicating the uplift of air had strengthened) and a contracting eye occurring after the storm experienced an eyewall replacement cycle.
Mature, intense tropical cyclones can and often undergo an eyewall replacement cycle. That’s where a new eyewall or ring of thunderstorms within the outer rain bands forms further out from the storm’s center, outside of the original eye wall. That ring of thunderstorms then begins to choke off the original eye wall, starving it of moisture and momentum. Eventually, if the cycle is completed, the original eye wall of thunderstorms dissipates and the new outer eye wall of thunderstorms contracts and replace the old eye wall. The storm’s intensity can fluctuate over this period, initially weakening as the inner eye wall dies before again strengthening as the outer eye wall contracts.
The National Weather Service (NWS) in Tiyan, Guam continued to issue a small craft advisory on Oct. 26. The NWS noted for Marianas Waters “Winds and seas will remain elevated, then slowly subside over the weekend as Super Typhoon Yutu moves away from the Marianas. A Small Craft Advisory remains in effect through Saturday afternoon.”
At 11 a.m. EDT (1500 UTC) on Oct. 26, the Joint Typhoon Warning Center or JTWC noted that Yutu had maximum sustained winds near 135 knots (155.4 mph/250 kph).
Super Typhoon Yutu was the equivalent of a Category 4 hurricane on the Saffir-Simpson Hurricane Wind Scale. Yutu was centered near 17.3 degrees north latitude and 136.9 east longitude. It was about 465 nautical miles west-northwest of Navsta, Guam. Yutu was moving toward the west-northwest.
The JTWC forecast carries Yutu west toward the northern Philippines through Oct. 31. Yutu is expected to maintain typhoon strength through that time.
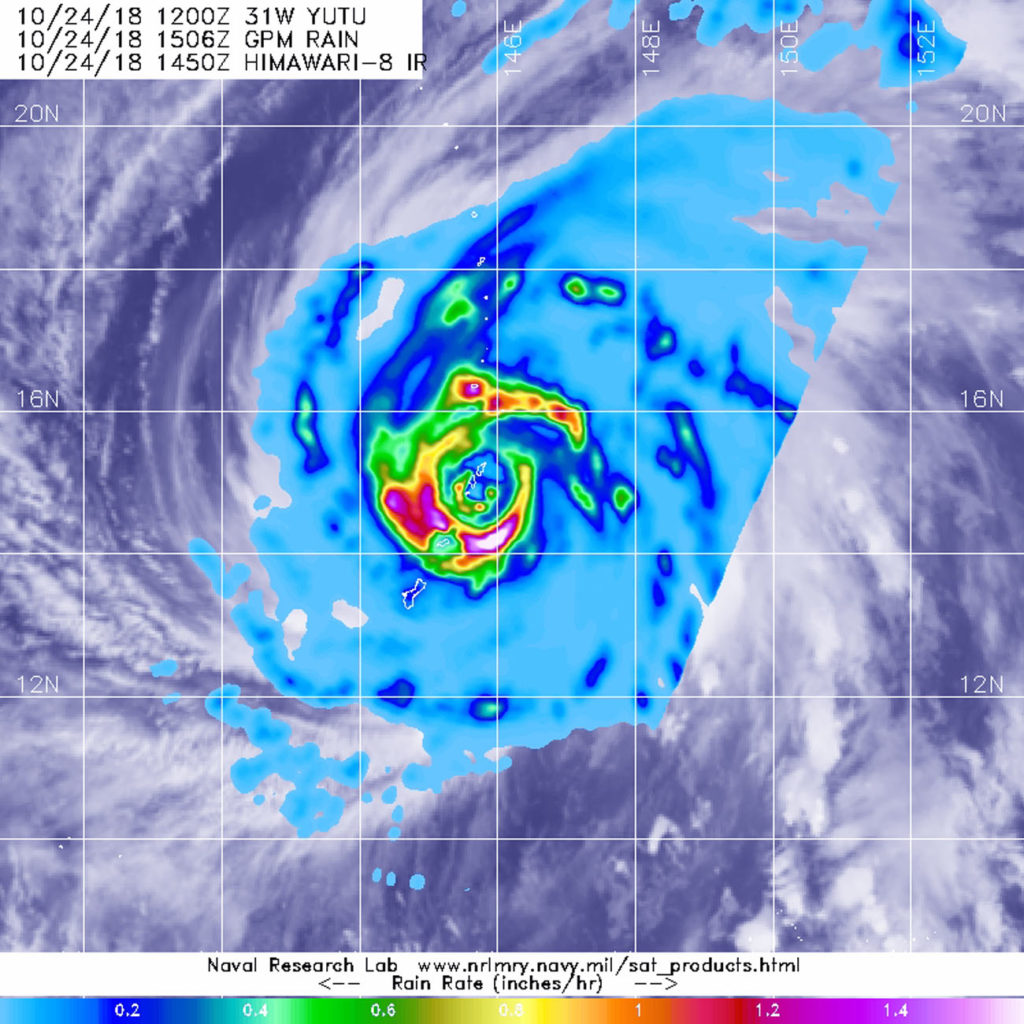
NASA’s GPM Core observatory satellite captured an image of Super Typhoon Yutu when it flew over the powerful storm just as the center was striking the central Northern Mariana Islands north of Guam.
Early Thursday, Oct. 25 local time, Super Typhoon Yutu crossed over the U.S. commonwealth of the Northern Mariana Islands. It was the equivalent of a Category 5 hurricane. The National Weather Service in Guam said it was the strongest storm to hit any part of the U.S. this year.
On Oct. 24 at 11:07 a.m. EDT (1507 UTC)/ 1:07 a.m. Guam Time, Oct. 25, GPM shows the inner eyewall as a near perfect ring of heavy to intense rain (shown by the circle of darker red and magenta). Peak rain rates of up to 269 mm/hr. (~10.6 inches/hr.) were estimated within the DPR swath. The almost perfect symmetry of the inner wall is indicative of an extremely powerful storm. The eyewall replacement is evidenced by the emerging ring of heavy rain outside of the inner eyewall separated by the area of weaker rain (shown in blue). Credit: NASA/JAXA, Hal Pierce
The Global Precipitation Measurement mission or GPM core satellite, which is managed by both NASA and the Japan Aerospace Exploration Agency, JAXA analyzed Yutu on Oct. 24 at 11:07 a.m. EDT (1507 UTC)/ 1:07 a.m. Guam Time, Oct. 25. GPM estimated rain rates within Super Typhoon Yutu fusing data from two instruments aboard: the GPM Dual-frequency Precipitation Radar or DPR, which covered the inner part of the storm, and the GPM Microwave Imager or GMI that analyzed the outer swath, just as the center was passing over the Island of Tinian.
GPM shows the inner eyewall as a near perfect ring of heavy to intense rain. Peak rain rates of up to 269 mm/hr. (~10.6 inches/hr.) were estimated within the DPR swath. The almost perfect symmetry of the inner wall is indicative of an extremely powerful storm. In fact, at the time this image was taken, Yutu’s maximum sustained winds were estimated at 155 knots (~178 mph) by the Joint Typhoon Warning Center, making it the strongest typhoon on record to strike Saipan and Tinian.
In this 3D image from GPM data on Super Typhoon Yutu on Oct. 24 at 11:017 a.m. EDT (1507 UTC)/ 1:07 a.m. Guam Time, Oct. 25, the double eyewall structure is readily apparent by the two rings of taller towers evident in the precipitation top heights. The tallest tower is located in the southeast part of the outer eyewall and is 15.7 km (9.7 miles) high. Credit: NASA/JAXA, Hal Pierce
For comparison, Hurricane Michael, which devastated the northern Gulf Coast of Florida, had maximum sustained winds reported at 155 mph. At the time of the satellite flyover, GPM showed the northern eyewall passing right over Tinian and the southern tip of Saipan. GPM also reveals another interesting feature common with powerful tropical cyclones, the beginning of an eyewall replacement cycle.
After strong hurricanes and typhoons reach maturity, they often undergo an eyewall replacement cycle wherein a concentric outer eyewall forms outside and around the inner eyewall before contracting and eventually replacing the inner eyewall. This is evidenced by the emerging ring of heavy rain outside of the inner eyewall separated by the area of weaker rain.
At NASA’s Goddard Space Flight Center in Greenbelt, Maryland, a second image was created at the same time as the first and shows a unique 3D perspective of Yutu courtesy of the GPM DPR. In that image the double eyewall structure is readily apparent by the two rings of taller towers evident in the precipitation top heights. The tallest tower is located in the southeast part of the outer eyewall and is 15.7 km (9.7 miles) high.
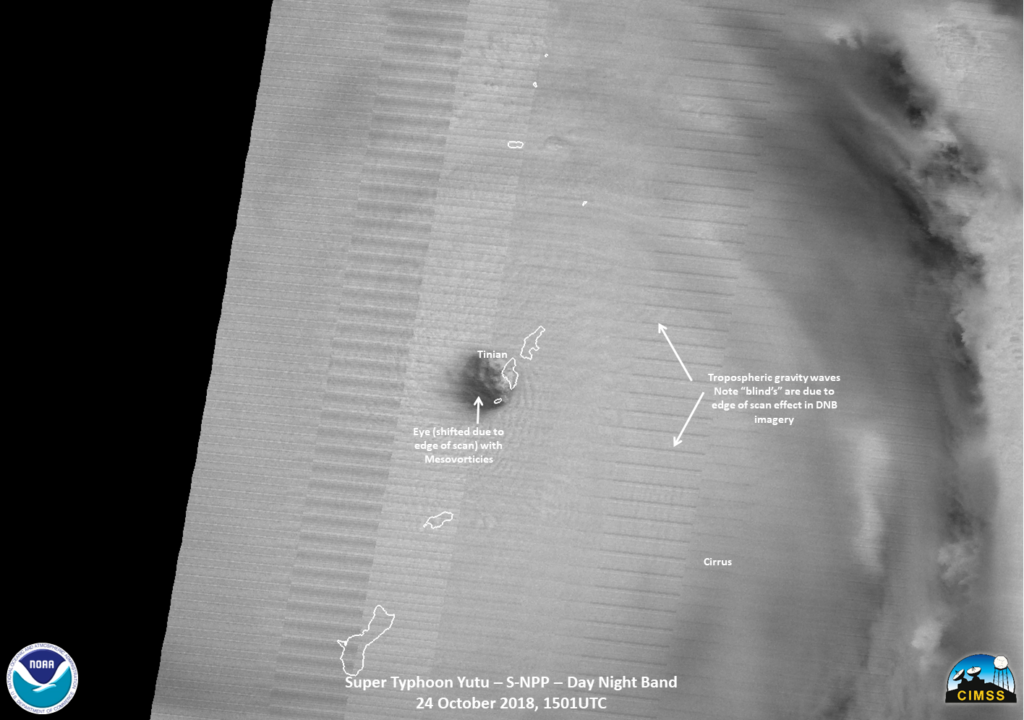
Super Typhoon Yutu has made a direct hit on Tinian Island. This image from NASA-NOAA’s Suomi NPP satellite was lit by a full moon. The eye was very well defined had ample tropospheric gravity waves generated by the intense convection. A “brightening” on the northeastern part of the eye, is not lightning, but perhaps the moonlight being reflected off of ice particles or something else. Credit: UWM-SSEC-CIMSS/William Straka III
On Oct. 25 at 11 a.m. EDT (1500 UTC), Super Typhoon Yutu had maximum sustained winds near 140 knots (161 mph/259 kph) and was still a Category 5 hurricane on the Saffir-Simpson Hurricane Wind Scale. It was centered near 6.4 degrees north and 141.8 degrees east. Super typhoon Yutu was located approximately 206 nautical miles west-northwest of Tinian and has tracked west-northwestward.
Yutu is expected to remain a very powerful super typhoon for the next few days before gradually weakening as it makes its way westward across the Philippine Sea in the general direction of Taiwan.
Oct. 24, 2018 – Satellite Sees Supertyphoon Yutu’s Eye Pass Over Tinian
On Oct. 24, the National Weather Service or NWS in Tiyan, Guam issued the warning that “Catastrophic winds for Tinian and Saipan are imminent” as the eye of Super typhoon Yutu neared both islands. NASA-JAXA’s GPM satellite and NOAA’s NOAA-20 satellite provided a look at the heavy rainfall and the structure and eye of the storm. Maximum sustained winds in the eye wall are 180 mph or stronger making Yutu a dangerous category 5 super typhoon.
NASA and the Japan Aerospace Exploration Agency’s GPM or Global Precipitation Measurement mission core satellite provided a look at heavy rainfall occurring in Super Typhoon Yutu on Oct. 24 at 10:50 a.m. EDT (1450 UTC) as it was battering Tinian and Saipan in the Northwestern Pacific Ocean. Credit: NASA/JAXA/NRL
At 10:22 a.m. EDT (1422 UTC) on Oct. 24 or 12:22 a.m. CHST (local time) on Thursday, Oct. 25, the NWS noted “Typhoon warnings remain in effect for Rota, Tinian and Saipan. The strongest winds will occur over the next few hours at Tinian and Saipan. The winds will be much stronger than in Typhoon Soudelor!”
In addition, a Tropical Storm Warning remains in effect for Guam, Alamagan, Pagan, and Agrihan. Typhoon conditions are expected through late this morning (CHST time) at Rota,Tinian and Saipan. Tropical storm conditions are expected for Guam through this evening (CHST time). Tropical storm conditions are expected at Alamagan, Pagan, and Agrihan around midnight tonight through late Thursday evening (CHST time).
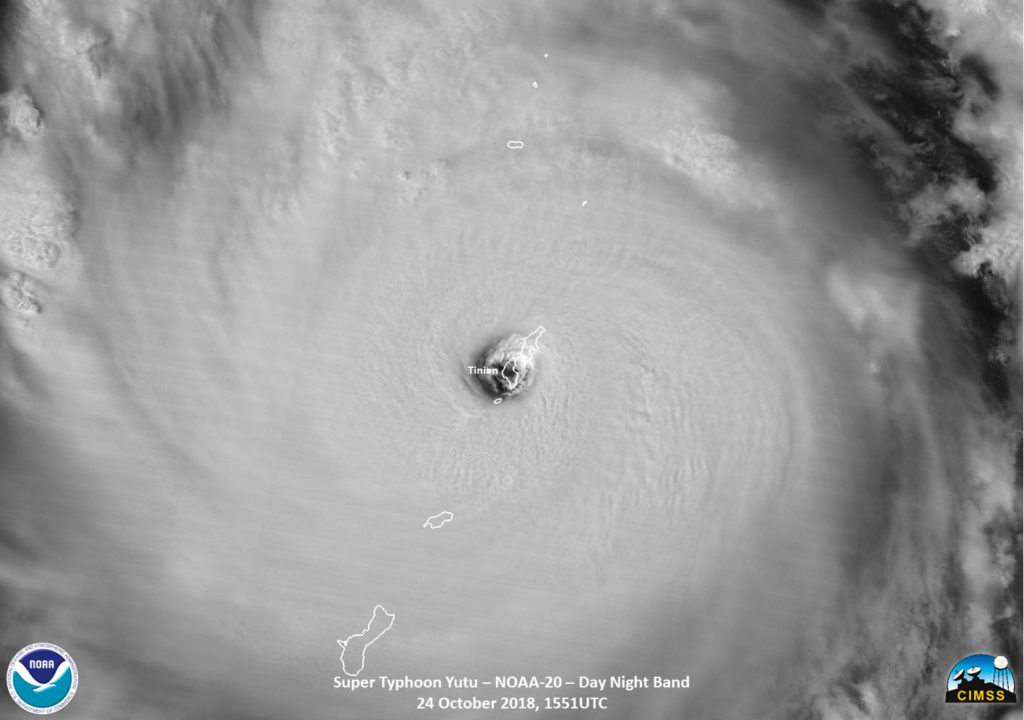
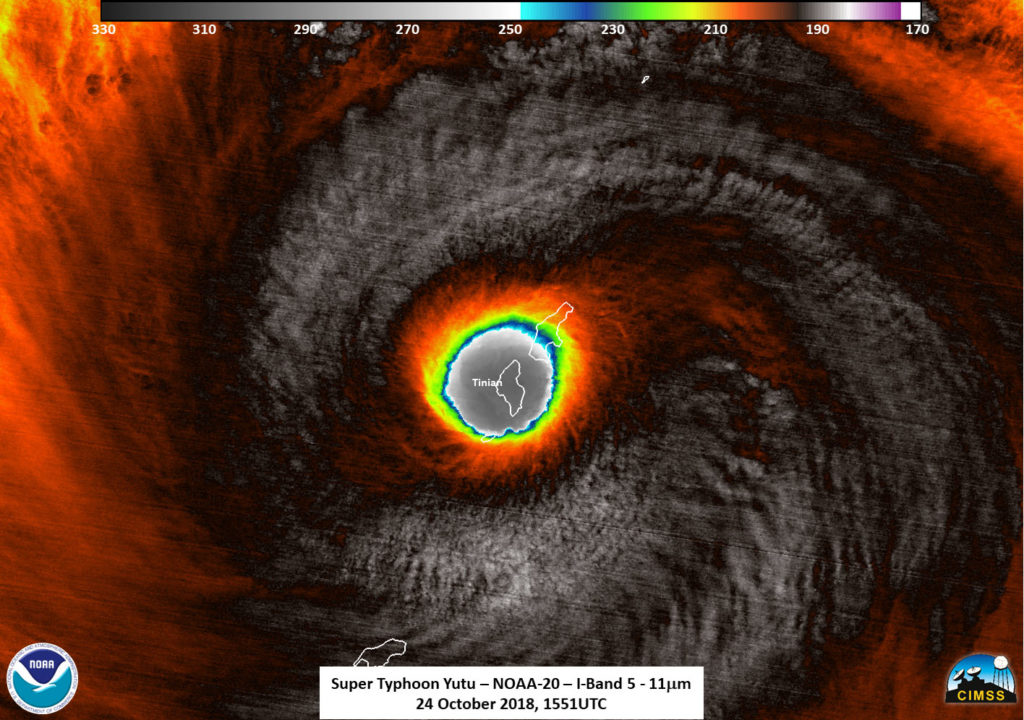
Shortly before the NOAA-20 satellite overpass on Oct. 23 (EDT) at 11:51 a.m. EDT (1551 UTC), Super typhoon Yutu hit Tinian island, one of the three principle islands of the Northern Mariana Islands, just south of Sapian and a U.S. Commonwealth. The southern part of Saipan is also impacted as well, which is where Saipan International Airport is located. Credit: NOAA/UWM-CIMSS, William Straka III
Shortly before the NOAA-20 satellite overpass on Oct. 23 (EDT) at 11:51 a.m. EDT (1551 UTC), Super typhoon Yutu hit Tinian Island, one of the three principle islands of the Northern Mariana Islands, just south of Sapian and a U.S. Commonwealth. Tinian is one of the three principal islands of the Commonwealth of the Northern Marianas. The southern part of Saipan was also impacted as well, where Saipan International Airport is located. A NOAA-20 infrared image showed coldest storm top temperatures around the eyewall at 210 kelvin (minus 81.6 Fahrenheit/minus 63.5 degrees Celsius) where storms are dropping extremely heavy rainfall.
NASA and the Japan Aerospace Exploration Agency’s GPM or Global Precipitation Measurement mission core satellite provided a look at heavy rainfall occurring in Super Typhoon Yutu on Oct. 24 at 10:50 a.m. EDT (1450 UTC) as it was battering Tinian and Saipan in the Northwestern Pacific Ocean.
At 11 a.m. EDT (1500 UTC) on Oct. 24 (1 a.m. CHST Oct. 25) the center of Super Typhoon Yutu will be located near Latitude 14.8 degrees North and Longitude 145.7 degrees East. That’s about 15 miles south-southeast of Tinian. Yutu is moving northwest at 13 mph. The eye of Yutu will pass over Tinian over the next couple hours. Maximum sustained winds have increased to 180 mph. Super Typhoon Yutu is a very dangerous Category 5 storm.
Typhoon force winds extend outward from the center up to 85 miles. Tropical storm force winds extend outward from the center up to 240 miles to the northeast and up to 205 miles elsewhere.
Shortly before the NOAA-20 satellite overpass on Oct. 23 (EDT) at 11:51 a.m. EDT (1551 UTC), Super typhoon Yutu hit Tinian island, one of the three principle islands of the Northern Mariana Islands, just south of Sapian and a U.S. Commonwealth. This infrared image shows coldest storm top temperatures around the eyewall at 210 kelvin where storms are dropping extremely heavy rainfall. Credit: NOAA/UWM-CIMSS, William Straka III
NWS said about storm surge and storm tide: Combined seas between 30 and 40 feet near the center of the storm will continue through tonight…resulting in deadly surf conditions. Coastal inundation of 15 to 20 feet is possible on windward exposures. Once Yutu passes to the west of the Mariana Islands…west and southwest swell will build with surf rising to 12 to 16 feet along west facing reefs. Coastal inundation of 5 to 7 feet is possible on west facing exposures. Surf will generate deadly rip currents.
A flash flood warning remains in effect for the entire area. Additional rainfall amounts of 6 to 10 inches are possible today. Isolated total rainfall amounts of up to 15 inches are possible.