June 30, 2020 – NASA Catches a Short-lived Eastern Pacific Depression 4E
Tropical Depression 4E formed late on June 29 and it is forecast to become a remnant low-pressure area by the end of the day on June 30. NASA-NOAA’s Suomi NPP satellite provided forecasters with an image of the depression, located just southwest of the southern tip of Mexico’s Baja Peninsula.
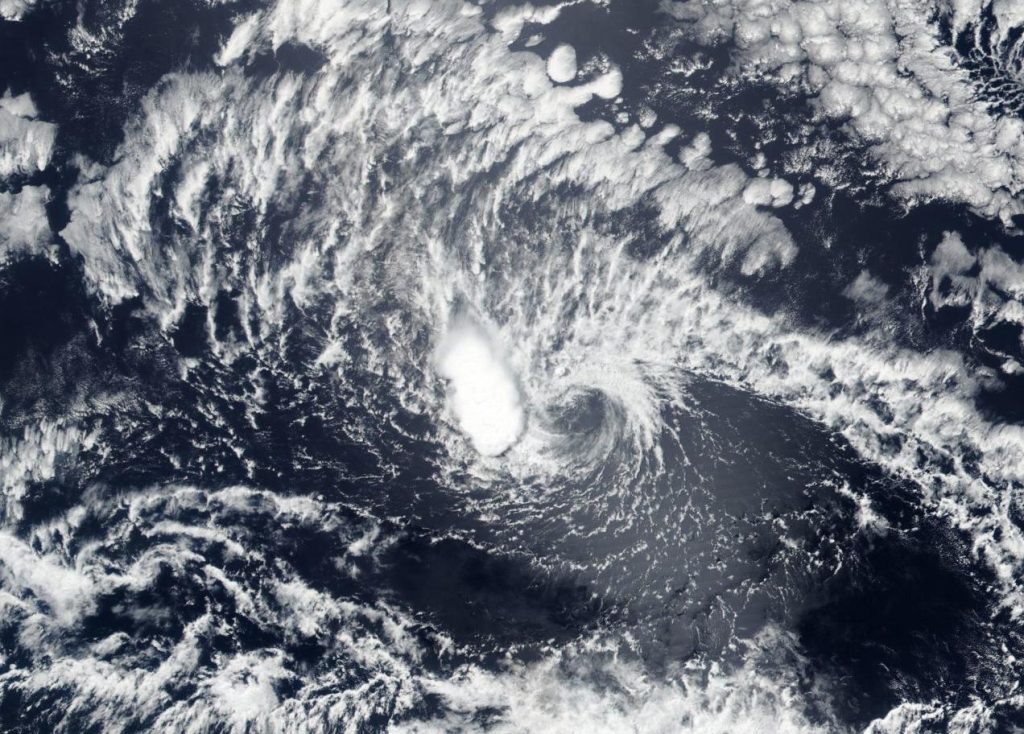
NASA-NOAA’s Suomi NPP satellite provided forecasters with a visible image of Tropical Depression 4E on June 29, 2020. The depression was located southwest of the southernmost tip of Baja California, Mexico. Credit: NASA Worldview, Earth Observing System Data and Information System (EOSDIS)
Tropical Depression Four-E (TD4E) formed on June 29 at 11 p.m. EDT (June 30 at 0300 UTC). It maintained depression status on June 30 and is forecast to weaken.
Visible imagery from NASA satellites help forecasters understand if a storm is organizing or weakening. The Visible Infrared Imaging Radiometer Suite (VIIRS) instrument aboard Suomi NPP provided a visible image of TD4E late on June 29 that showed it remained disorganized and lop-sided. The imagery showed that the bulk of clouds and precipitation was displaced more than 90 nautical miles northeast of the center of circulation. Clouds associated with the depression were streaming over the southern tip of the Baja Peninsula.
At 5 a.m. EDT (0900 UTC) on June 30, NOAA’s National Hurricane Center (NHC) noted the center of Tropical Depression Four-E was located near latitude 20.6 degrees north and longitude 113.2 degrees west. That is about 265 miles (425 km) southwest of the southern tip of Baja California, Mexico. The estimated minimum central pressure is 1005 millibars.
Maximum sustained winds had decreased to near 30 mph (45 kph) with higher gusts. The low should gradually spin down during the next day or two over cool waters while it moves slowly northwestward.
NHC forecasters said the system is forecast to become a remnant low later today, and degenerate into a trough of low pressure in a couple of days.
Tropical cyclones/hurricanes are the most powerful weather events on Earth. NASA’s expertise in space and scientific exploration contributes to essential services provided to the American people by other federal agencies, such as hurricane weather forecasting.
June 29, 2020 – NASA-NOAA Satellite Animation Shows the End of Tropical Cyclone Boris
NASA-NOAA’s Suomi NPP satellite imagery provided a look at the end of the second named tropical cyclone of the Eastern Pacific Ocean’s 2020 Hurricane Season.
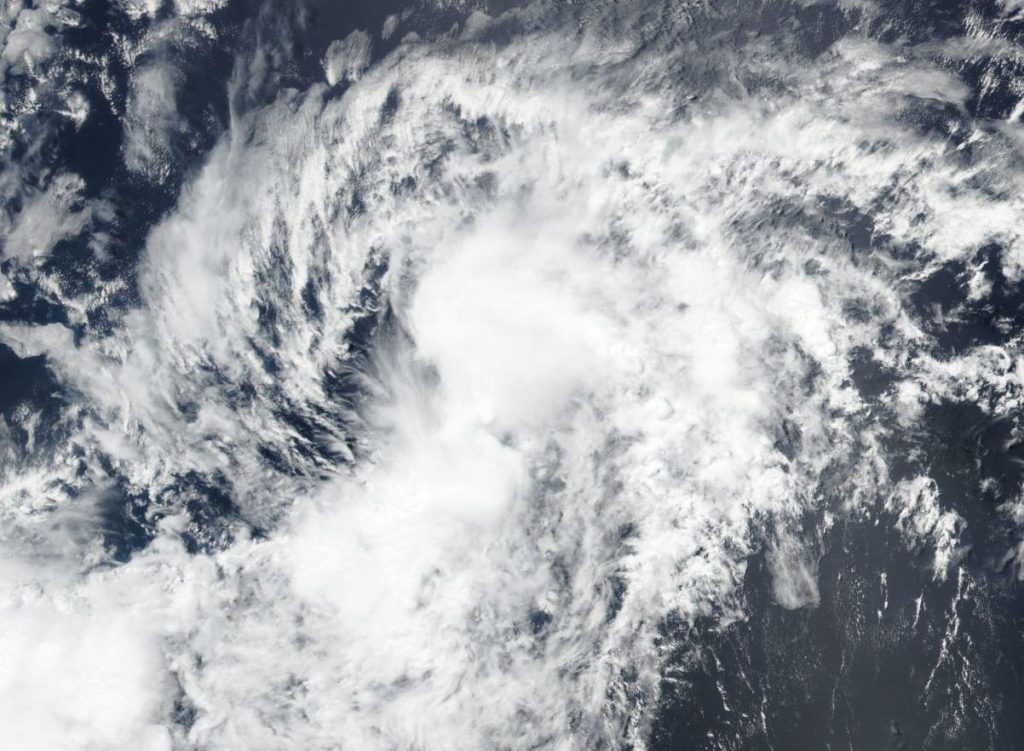
NASA-NOAA’s Suomi NPP satellite provided this image of former Tropical Cyclone Boris as it weakened to a remnant low-pressure area on June 29, 2020 in the Central Pacific Ocean. The circulation center can be seen surrounded by wispy clouds with the exception of a small area of thunderstorms on the western side of the circulation. Credit: NASA Worldview, Earth Observing System Data and Information System (EOSDIS)
Tropical Cyclone Boris formed in the Eastern Pacific Ocean on Wednesday, June 24 and by early on Sunday, June 29, the storm had become a remnant low-pressure area.
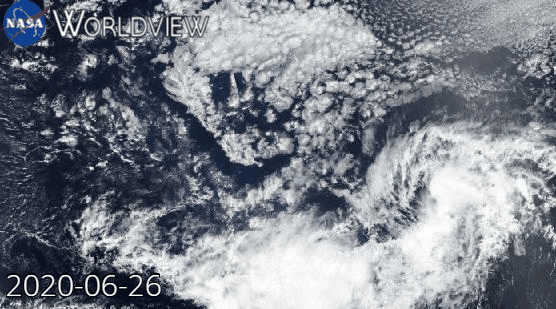
At NASA’s Goddard Space Flight Center in Greenbelt, Md., an animation of satellite imagery was created from NASA Worldview, Earth Observing System Data and Information System (EOSDIS). The animation used imagery from the Visible Infrared Imaging Radiometer Suite (VIIRS) instrument aboard NASA-NOAA’s Suomi NPP satellite and ran from June 26 to June 29, 2020. The animation showed the progression and weakening of Tropical Cyclone Boris as it crossed from the Eastern Pacific Ocean into the Central Pacific Ocean.
This animation shows the progression and dissipation of Tropical Cyclone Boris in the Eastern and Central Pacific Ocean. The animation using imagery from the VIIRS instrument aboard NASA-NOAA’s Suomi NPP satellite runs from June 26 to June 29, 2020. Credit: NASA Worldview, Earth Observing System Data and Information System (EOSDIS)
The final advisory issued by NOAA’s National Hurricane Center came on Saturday, June 27 at 11 p.m. EDT. At that time, center of Post-Tropical Cyclone Boris was located near latitude 12.1 degrees north and longitude 142.0 degrees west. That was about 1,015 miles (1,635 km) east-southeast of Hilo, Hawaii. The post-tropical cyclone was moving toward the west-southwest near 8 mph (13 kph). Maximum sustained winds were near 30 mph (45 kph) and weakening.
NASA-NOAA’s Suomi NPP satellite provided an image of former Tropical Cyclone Boris as it weakened to a remnant low-pressure area on June 29. In the image, the circulation center can be seen surrounded by wispy clouds with the exception of a small area of thunderstorms on the western side of the circulation.
The remnant low is expected to dissipate by June 30.
Tropical cyclones/hurricanes are the most powerful weather events on Earth. NASA’s expertise in space and scientific exploration contributes to essential services provided to the American people by other federal agencies, such as hurricane weather forecasting.
June 26, 2020 – NASA-NOAA’s Suomi NPP Satellite Sees Tropical Storm Boris Form
NASA-NOAA’s Suomi NPP satellite provided forecasters with visible image of the Eastern Pacific Ocean’s second tropical storm of the season, Boris. Boris formed just east of the Central Pacific Ocean’s boundary as it was moving into that region.
On June 25, 2020, NASA-NOAA’s Suomi NPP satellite provided forecasters with a visible image of Tropical Storm Boris in the Eastern Pacific Ocean, during its short time as a tropical storm. Credit: NASA Worldview, Earth Observing System Data and Information System (EOSDIS)
The Central Pacific Ocean Basin is the central area of the North Pacific Ocean. Its boundaries are the Marshall Islands to the west and the Line Islands to the east. Hawaii lies in the Central Pacific Ocean.
Satellites have been monitoring the progress and development of Tropical Depression 3 in the Eastern Pacific for two days. On June 25, the depression organized and strengthened into a tropical storm and was renamed Boris at 5 p.m. EDT. Boris reached maximum strength with maximum sustained winds near 40 mph and weakened back to a depression in 12 hours by 5 a.m. EDT (0900 UTC) on June 26.
Visible imagery from NASA satellites help forecasters understand if a storm is organizing or weakening. The Visible Infrared Imaging Radiometer Suite (VIIRS) instrument aboard Suomi NPP provided a visible image of Boris during its short time as a tropical storm on June 26, 2020.
At 11 a.m. EDT (1500 UTC) on June 26, NOAA’s Central Pacific Hurricane Center noted the center of Tropical Depression Boris was located near latitude 12.0 degrees north and longitude 139.0 degrees west. That is about 1,195 miles (1,920 km) east-southeast of Hilo, Hawaii. The depression was moving toward the west-northwest near 7 mph (11 kph), and this motion should continue through tonight. Maximum sustained winds were near 35 mph (55 kph) with higher gusts.
A turn toward the west is expected late on Friday June 26, or on Saturday June 27. Gradual weakening is forecast during the next couple of days, and Boris is forecast to degenerate to a remnant low pressure area Saturday night or Sunday.
Tropical cyclones/hurricanes are the most powerful weather events on Earth. NASA’s expertise in space and scientific exploration contributes to essential services provided to the American people by other federal agencies, such as hurricane weather forecasting.
June 24, 2020 – NASA Finds Post-Tropical Cyclone Dolly Exiting the Tropical Stage
NASA’s Terra satellite provided a night-time look at what is now Post-Tropical Storm Dolly in the Northern Atlantic Ocean. Terra found that all of Dolly’s clouds were on one side of the storm as the storm weakened further.
NASA’s Terra satellite provided an infrared image of Post-Tropical Cyclones Dolly during the early morning hours of June 24, 2020 that showed the bulk of its storms (dark blue) were south of its center. Credit: NASA Worldview
The National Hurricane Center (NHC) defines a post-tropical cyclone as a former tropical cyclone. This generic term describes a cyclone that no longer possesses sufficient tropical characteristics to be considered a tropical cyclone. Post-tropical cyclones can continue carrying heavy rains and high winds. Note that former tropical cyclones that have become fully extratropical and remnant lows are two classes of post-tropical cyclones.
At 11 a.m. EDT (1500 UTC), the NHC issued their final advisory on Post-Tropical Storm Dolly as the storm weakened to a remnant low-pressure area. The center of Post-Tropical Cyclone Dolly was located near latitude 42.5 north, longitude 57.8 west. That is about 370 miles (595 km) southwest of Cape Race Newfoundland, Canada. Maximum sustained winds are near 35 mph (55 kph) with higher gusts.
The estimated minimum central pressure is 1007 millibars. The post-tropical cyclone is moving toward the northeast near 16 mph (26 kph) and this general motion is expected to continue through tonight.
In the early morning hours of June 24, the Moderate Resolution Imaging Spectroradiometer or MODIS instrument that flies aboard NASA’s Terra satellite captured an infrared image of Post-Tropical Cyclone Dolly’s brightness temperatures. Brightness temperature is actually a measure of the photons seen in the 11-micron wavelength by the MODIS instrument aboard Terra. They are presented in units of temperature. The infrared image provided temperature data that revealed the coldest, highest clouds were about 213.8 Kelvin (minus 76.2 degrees Fahrenheit/minus 60.1 degrees Celsius). Those areas indicated the strongest thunderstorms within the low-pressure area and were all displaced to the south of the center.
Because Dolly is now moving over cool waters below 20 degrees Celsius (60 degrees Fahrenheit), forecasters do not expect any more development of strong thunderstorms. Tropical cyclones require sea surface temperatures of at least 26.6 degrees Celsius (80 degrees Fahrenheit) to maintain strength and generate thunderstorms.
Therefore, the low-pressure area is forecast to gradually spin down through Wednesday [June 24] night. It will likely open to an elongated area of low pressure known as a surface trough sometime on Thursday as it continues to move northeastward.
The National Hurricane Center said, “Gradual weakening is expected, and Post-Tropical Cyclone Dolly is expected to dissipate by Thursday [June 25] morning.”
NASA’s Terra satellite is one in a fleet of NASA satellites that provide data for hurricane research.
Tropical cyclones/hurricanes are the most powerful weather events on Earth. NASA’s expertise in space and scientific exploration contributes to essential services provided to the American people by other federal agencies, such as hurricane weather forecasting.
June 23, 2020 – NASA Satellite Gives a Hello to Tropical Storm Dolly
During the morning of June 23, the fourth system in the Northern Atlantic Ocean was a subtropical depression. By the afternoon, the subtropical depression took on tropical characteristics and was renamed Dolly. NASA’s Terra satellite greeted Tropical Storm Dolly by taking an image of the new tropical storm.
NASA’s Terra satellite provided a visible image of Tropical Storm Dolly in the western North Atlantic Ocean on June 23, 2020 at 1:30 p.m. EDT. Credit: NASA Worldview
At 1 p.m. EDT (1700 UTC), the National Hurricane Center (NHC) classified Dolly as a tropical storm. The NHC Discussion said, “A (9:48 a.m. EDT) 1348 UTC an ASCAT-A scatterometer [a satellite instrument that measures wind speed and direction] pass, arriving just after the previous advisory was issued, indicates that the cyclone is producing winds of 35 to 40 knots (40 to 46 mph/65 to 74 kph) in its southern semicircle. In addition, the radius of maximum winds has contracted to about 40 nautical miles. This, along with the current convective pattern, suggests that the system has made a transition from a subtropical to a tropical cyclone, and it has been designated as Tropical Storm Dolly.”
The center of Tropical Storm Dolly was located near latitude 39.4 degrees north and longitude 61.7 degrees west. That is about 370 miles (600 km) south-southeast of Halifax, Nova Scotia, Canada. Dolly was moving toward the east-northeast near 13 mph (20 kph). A turn toward the northeast with an increase in forward speed is expected tonight and on Wednesday, June 24.
Satellite-derived wind data indicate that maximum sustained winds have increased to near 45 mph (75 kph) with higher gusts. Tropical-storm-force winds extend outward up to 70 miles (110 km) to the south of the center. The estimated minimum central pressure is 1002 millibars.
The Moderate Resolution Imaging Spectroradiometer or MODIS instrument that flies aboard NASA’s Terra satellite captured a visible image of Tropical Storm Dolly in the western North Atlantic Ocean on June 23, 2020 at 1:30 p.m. EDT. The image showed a thick band of thunderstorms wrapping around the center from the southern to the eastern quadrant of the storm. The image was created by NASA Worldview at NASA’s Goddard Space Flight Center in Greenbelt, Md.
The National Hurricane Center said, “Weakening is forecast during the next day or two as Dolly moves over colder waters, and the system is expected to become post-tropical on Wednesday. The low should then dissipate by early Thursday.”
NASA’s Terra satellite is one in a fleet of NASA satellites that provide data for hurricane research.
Tropical cyclones/hurricanes are the most powerful weather events on Earth. NASA’s expertise in space and scientific exploration contributes to essential services provided to the American people by other federal agencies, such as hurricane weather forecasting.
June 23, 2020 – NASA Analyzes the Newest Atlantic Ocean Subtropical Depression
NASA’s Aqua satellite used infrared light to analyze the strength of storms in the North Atlantic Ocean’s newly formed Subtropical Depression 4. Infrared data provides temperature information to find the strongest thunderstorms that reach high into the atmosphere which have the coldest cloud top temperatures.
On June 23 at 2:10 a.m. EDT (0610 UTC), NASA’s Aqua satellite found several fragmented and disorganized thunderstorms circling the center of circulation of Subtropical Depression 4, where cloud top temperatures as cold as or colder than minus 50 degrees Fahrenheit (minus 45.5 Celsius). Credit: NASA/NRL
By 5 p.m. EDT on Monday, June 22, the non-tropical low-pressure system that the National Hurricane Center had been following for the past couple of days off the U.S. east coast had developed enough organized convection near the center to be classified as subtropical depression. It was then that Subtropical Depression 4 was born.
The Moderate Resolution Imaging Spectroradiometer or MODIS instrument aboard NASA’s Aqua satellite captured infrared data on June 23 at 2:10 a.m. EDT (0610 UTC). The MODIS data showed several fragmented and disorganized thunderstorms circling the center of circulation where cloud top temperatures as cold as or colder than minus 50 degrees Fahrenheit (minus 45.5 Celsius). Cloud top temperatures that cold indicate strong storms with the potential to generate heavy rainfall.
Just three hours after the MODIS image, at 5 a.m. EDT as daylight broke, NOAA’s National Hurricane Center (NHC) said satellite data showed an increase in deep convection (rising air that forms the thunderstorms that make up tropical cyclones) since the Aqua satellite passed overhead. Those thunderstorms still appeared disorganized in this image.
NHC said, “The depression is situated beneath an upper-level low [pressure area], and the system has a large radius-of-maximum winds, so it is still subtropical. While it is possible the depression could become a storm later today, rapidly cooling sea surface temperatures should cause the system to weaken on Wednesday [June 24].”
What is a Subtropical Storm?
NOAA’s National Hurricane Center defines subtropical storms as “A non-frontal low-pressure system that has characteristics of both tropical and extratropical cyclones. Like tropical cyclones, they are non-frontal, synoptic-scale cyclones that originate over tropical or subtropical waters, and have a closed surface wind circulation about a well-defined center. In addition, they have organized moderate to deep convection, but lack a central dense overcast. Unlike tropical cyclones, subtropical cyclones derive a significant proportion of their energy from baroclinic sources, and are generally cold-core in the upper troposphere, often being associated with an upper-level low or trough. In comparison to tropical cyclones, these systems generally have a radius of maximum winds occurring relatively far from the center (usually greater than 60 nautical miles), and generally have a less symmetric wind field and distribution of convection.
Subtropical Depression 04L’s Status
At 5 a.m. EDT (0900 UTC), on June 23 the center of Subtropical Depression Four was located near latitude 39.3 degrees north and longitude 63.4 degrees west. That is about 365 miles (590 km) south of Halifax, Nova Scotia, Canada.
The depression is moving toward the northeast near 13 mph (20 km/h), and this motion is expected to continue for next couple of days with some increase in forward speed. The estimated minimum central pressure is 1008 millibars. Maximum sustained winds are near 35 mph (55 kph) with higher gusts.
Little change in strength is forecast during the next day or so, with the system likely weakening and transitioning into a post-tropical cyclone on Wednesday, June 24.
What is a Post-tropical Cyclone?
NHC defines a post-tropical cyclone as a former tropical cyclone. This generic term describes a cyclone that no longer possesses sufficient tropical characteristics to be considered a tropical cyclone. Post-tropical cyclones can continue carrying heavy rains and high winds. Note that former tropical cyclones that have become extratropical, as well as remnant lows, are two classes of post-tropical cyclones.
Hurricanes/tropical cyclones are the most powerful weather events on Earth. NASA’s expertise in space and scientific exploration contributes to essential services provided to the American people by other federal agencies, such as hurricane weather forecasting.
This animation shows NASA IMERG rain rates (blue shading) and accumulations (green shading) alongside the NOAA low-pressure center track (red line) of Tropical Storm Amanda/Cristobal. The origin of this storm was in the eastern Pacific Ocean in late May 2020, where it was named Tropical Storm Amanda as it approached the southern Mexican and Central American coast. Amanda made landfall in Guatemala on May 31, where it began to deliver the first of a series of heavy rain pulses that led to flooding in the region. After temporarily stalling over land, the system reformed over the Bay of Campeche on June 1 as Tropical Storm Cristobal and made its second landfall on June 3 in Mexico. The storm continued to deliver several pulses of heavy rainfall to southern Mexico, Guatemala, and El Salvador. Some areas of the region accumulated over 60 cm (~2 feet) of rainfall throughout Cristobal’s passage. The storm then crossed the Gulf of Mexico and made landfall in Louisiana on June 7 and progressed northward as a tropical depression before being classified as an extratropical low pressure system over Wisconsin on June 10. Large swaths of the U.S. Gulf Coast and Midwest as far north as Wisconsin saw accumulations in excess of 10 cm (~4 inches), and some areas along the coasts of Florida, Alabama, and Mississippi received over 20 cm (~8 inches), during Cristobal’s passage.
Credit: Visualization and text by Jason West (NASA GSFC)
June 15, 2020 – NASA Follows Tropical Storm Nuri’s Path
An animation of four days of imagery from NASA’s Terra satellite showed the progression and landfall of Tropical Storm Nuri.
This animation of Nuri’s path through the South China Sea, its landfall and dissipation over southern China was generated by visible images taken from NASA’s Terra satellite from June 11 to 15, 2020. Credit: NASA Worldview
At NASA’s Goddard Space Flight Center in Greenbelt, Md. an animation of Nuri from June 11 to 15 was created using NASA Terra satellite images. It showed Nuri’s path through the South China Sea, its landfall and dissipation over southern China. The Moderate Imaging Spectroradiometer or MODIS instrument that flies aboard NASA’s Terra satellite captured the visible images.
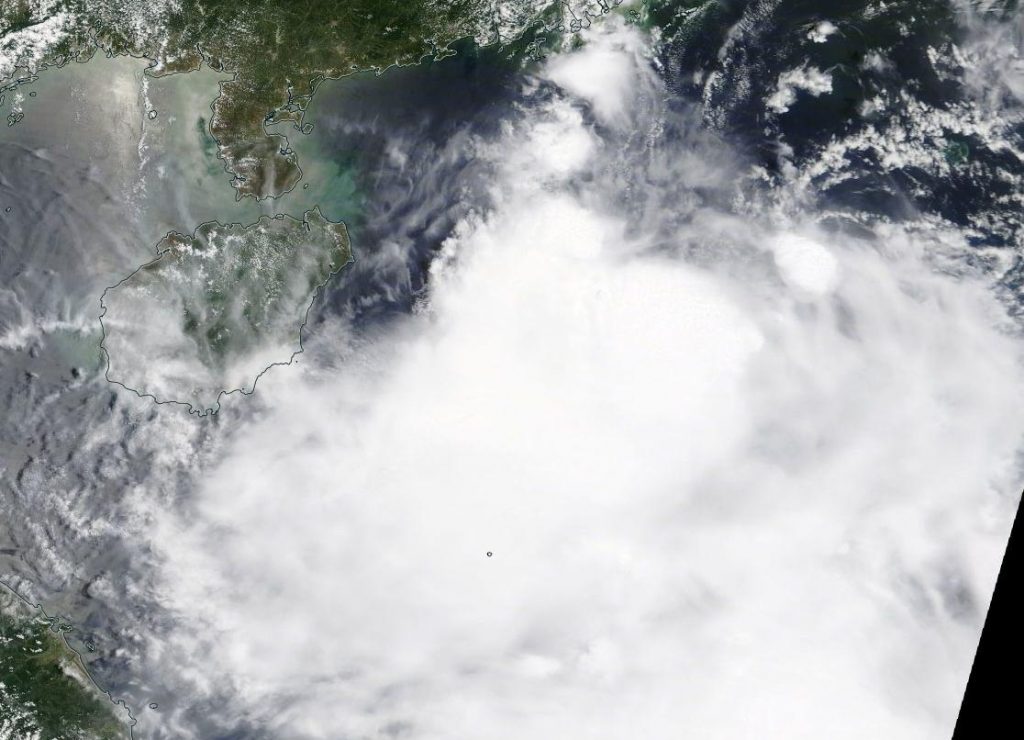
NASA’s Terra satellite provided a visible image to forecasters of Tropical Storm Nuri as it approached the southeastern coast of China during the day on Saturday, June 13. At that time, Strong wind signal #3 was in force for Hong Kong. At 5 a.m. EDT (0900 UTC), Tropical storm Nuri was located near latitude 18.7 north and longitude 115.2 east, 166 miles south-southeast of Hong Kong. Nuri was moving to the west-northwest and had maximum sustained winds of 35 knots (40 mph/65 kph). Nuri was moving northwest and did not strengthen further before making landfall.
NASA’s Terra satellite provided a visible image to forecasters of Tropical Storm Nuri as it approached the southeastern coast of China on Saturday, June 13. Credit: NASA Worldview
On June 13 at 11 p.m. EDT (June 14 at 0300 UTC), the Joint Typhoon Warning Center issued their final warning on Nuri. Nuri had made landfall in China’s Guangdong Province and was located near latitude 21.8 degrees north and longitude 112.0 degrees east, about 126 nautical miles west-southwest of Hong Kong. Nuri had weakened to a depression and had maximum sustained winds near 25 knots (29 mph/46 kph). It was moving to the northwest and dissipating.
NASA’s Terra satellite is one in a fleet of NASA satellites that provide data for hurricane research.
Tropical cyclones/hurricanes are the most powerful weather events on Earth. NASA’s expertise in space and scientific exploration contributes to essential services provided to the American people by other federal agencies, such as hurricane weather forecasting.
June 12, 2020 – NASA Catches Development of Tropical Cyclone Nuri in South China Sea
A low-pressure system that developed in the Philippine Sea and tracked over the central Philippines has moved into the South China Sea and become a depression. NASA’s Terra satellite provided an image of the newly formed storm.
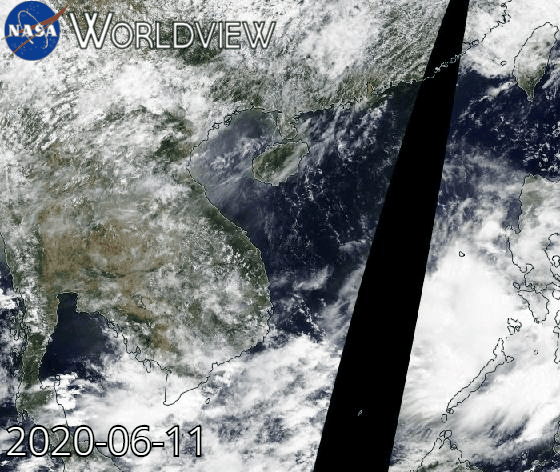
On June 12, 2020, the MODIS instrument that flies aboard NASA’s Terra satellite provided a visible image of the newly developed Nuri. The image showed a cluster of thunderstorms surrounding the center of circulation, and located between the Philippines and Hainan Island, China. Credit: NASA/Worldview
Tropical Depression Nuri (also known as 02W) formed by 5 a.m. EDT (0900 UTC) after passing over Luzon, Philippines and moved into the South China Sea. On June 12, 2020, the Moderate Resolution Imaging Spectroradiometer or MODIS instrument that flies aboard NASA’s Terra satellite provided a visible image of the newly developed Nuri. The image showed a cluster of thunderstorms surrounding the center of circulation and located between the Philippines and Hainan Island, China.
The Joint Typhoon Warning Center noted, “Animated enhanced infrared satellite imagery depicts discrete clusters of deep convection flaring around the periphery of a broad low-level circulation center. A microwave image indicates a broad weakly defined low level center with formative shallow banding [of thunderstorms] wrapping into the center.”
By 11 a.m. EDT (1500 UTC), it was located approximately 329 nautical miles south-southeast of Hong Kong, China, near latitude 17.9 degrees north and longitude 116.8 degrees east. Maximum sustained winds were 30 knots (34.5 mph/55.5 kph) and strengthening is forecast. Nuri has tracked west northwestward at 13 knots (15 mph/24 kph).
The storm is forecast to make landfall to the southwest of Hong Kong, China on June 14.
NASA’s Terra satellite is one in a fleet of NASA satellites that provide data for hurricane research.
Tropical cyclones/hurricanes are the most powerful weather events on Earth. NASA’s expertise in space and scientific exploration contributes to essential services provided to the American people by other federal agencies, such as hurricane weather forecasting.
June 10, 2020 – NASA Finds Post-Tropical Depression Cristobal Soaking the Great Lakes
NASA’s GPM satellite gathered data on what is now Post-Tropical Cyclone Cristobal and revealed some areas of heavy rain were occurring. Cristobal was bringing rainfall and gusty winds to the Great Lakes Region and still generating warnings.
Warnings and Advisories
On June 10, Cristobal was designated a post-tropical cyclone and the storm has triggered several watches and warnings in the Great Lakes area. The National Weather Service’s Weather Prediction Center (WPC) in College Park, Md. issued a Lakeshore Flood Warning for the northern shores of Lake St. Clair. Lakeshore Flood Advisories are in effect for the Lake Michigan shoreline of northern Lower Michigan, the Lake Michigan shoreline of Upper Michigan and the Lake Huron shoreline of Upper Michigan.
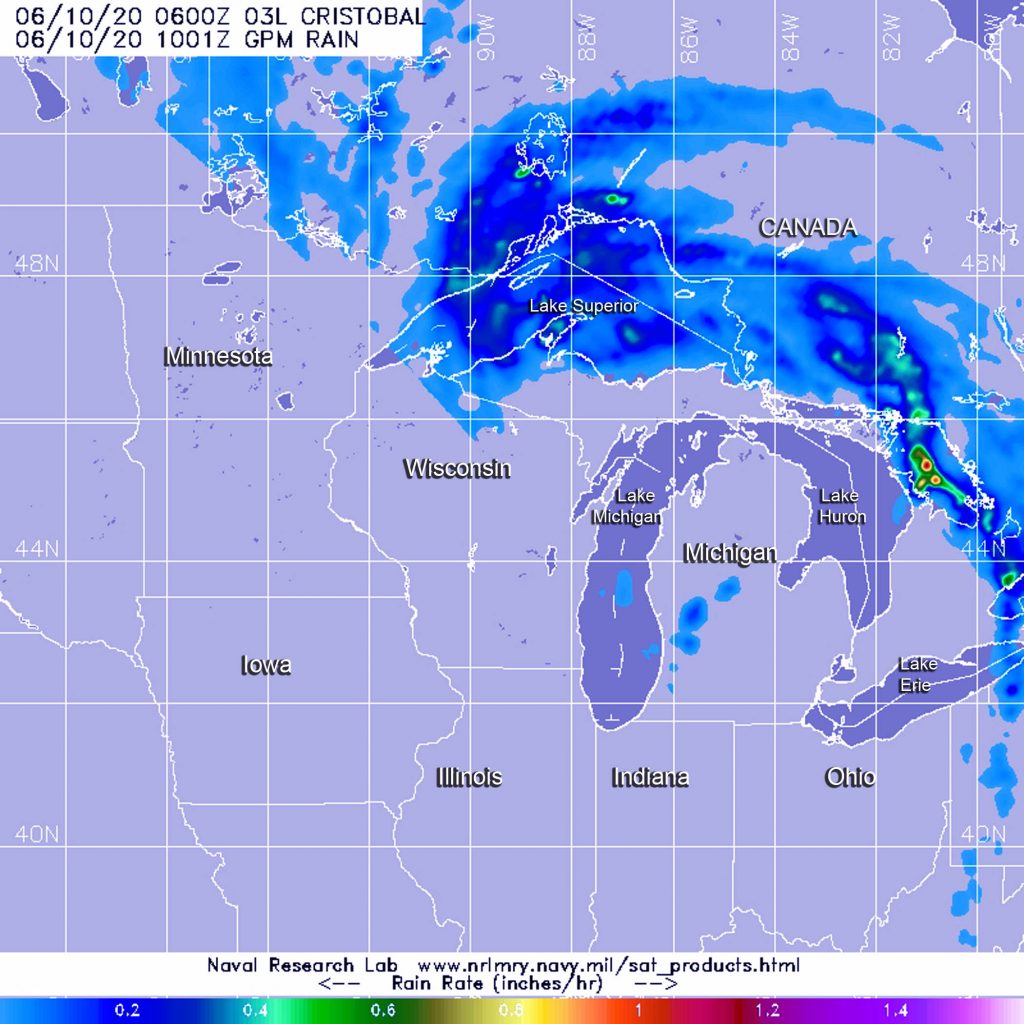
The GPM’s core satellite passed over Cristobal on June 10 at 2 a.m. EDT (0600 UTC). GPM found heaviest rainfall (orange) occurring in two areas. One area was north and west of Lake Superior, north of Rossport and Red Rock, Ontario, Canada. The second area was over Georgian Bay in the eastern side of Lake Huron. In both places, heavy rain (orange) was falling at a rate of 1 inch (25 mm) per hour. Light rain (blue) appears stretched around the northern and eastern side of the system. Credit: NASA/NRL
In addition, a Gale Warning is in effect for Lake Michigan, eastern Lake Superior and portions of Lake Huron. Wind Advisories are in effect for parts of Wisconsin and Michigan.
What is a Post-tropical Cyclone?
NOAA’s National Hurricane Center defines a Post-tropical cyclone as a former tropical cyclone. This generic term describes a cyclone that no longer possesses sufficient tropical characteristics to be considered a tropical cyclone. Post-tropical cyclones can continue carrying heavy rains and high winds. Former tropical cyclones that have become fully extratropical and remnant lows are two classes of post-tropical cyclones.
Rainfall Estimates
When the Global Precipitation Measurement mission or GPM core satellite passed over Cristobal on June 10 at 2 a.m. EDT (0600 UTC). GPM found heaviest rainfall occurring in two areas. One area was north and west of Lake Superior, north of Rossport and Red Rock, Ontario, Canada. The second area was over Georgian Bay on the eastern side of Lake Huron. In both places, rain was falling at rates of 1 inch (25 mm) per hour. Light rain appears stretched around the northern and eastern side of the system, falling at less than 0.2 inches (less than 5 millimeters) per hour.
Forecast Rainfall
The WPC noted, “The primary rainfall threat with Cristobal has ended. Sporadic heavy rain is possible today across the Great Lakes, along and ahead of a cold front associated with extratropical Cristobal. Minor to moderate river flooding will continue across portions of the Mississippi Valley.”
Cristobal’s Status on Wednesday, June 10, 2020
At 5 a.m. EDT (0900 UTC) on June 10, the center of Post-Tropical Cyclone Cristobal was located near latitude 45.8 degrees north and longitude 88.2 degrees west. That places the center about 195 miles (310 km) north-northeast of Madison, Wisconsin and about 185 miles (295 km) west of Sault Ste. Marie, Michigan. The post-tropical cyclone is moving toward the north-northeast near 30 mph (48 kph) and this motion is expected to continue as Cristobal tracks into Ontario, Canada.
On June 8, from aboard the International Space Station, Astronaut Chris Cassidy captured this image of Tropical Storm Cristobal. Credit: NASA/Chris Cassidy Twitter
Maximum sustained winds are near 40 mph (65 kph) with higher gusts. Little change in strength is forecast during the next 48 hours. The estimated minimum central pressure is 983 millibars.
Cristobal’s Forecast Path
WPC noted that in addition to rainfall, winds gusting over 40 mph are expected early during the morning of June 10 over portions of Wisconsin and Michigan close to the Great Lakes. In addition, a few tornadoes are possible today across in the Great Lakes region, with the greatest chances in parts of Michigan, Indiana and Ohio.
Tropical cyclones/hurricanes are the most powerful weather events on Earth. NASA’s expertise in space and scientific exploration contributes to essential services provided to the American people by other federal agencies, such as hurricane weather forecasting.
GPM is a joint mission between NASA and the Japan Aerospace Exploration Agency, JAXA. The Suomi NPP satellite is a joint mission with NASA and NOAA.