Sep. 06, 2018 – NASA Adds Up Heavy Rains from Typhoon Jebi
Typhoon Jebi brought flooding to Japan and NASA’s IMERG estimated rainfall over the country and the surrounding region for a one-week period.

Credit: NASA/JAXA, Hal Pierce
Super Typhoon Jebi began as an area of low pressure that formed in the vicinity of Enewetak Atoll in the far western Marshall Islands. Two days later on the 27th of August the system was upgraded to a tropical depression, which continued to intensify, becoming a named tropical storm, the 21st of the season, the following day.
After initially moving northwest, Jebi took a more westward track and continued to steadily intensify as it approached the Northern Mariana Islands, becoming a typhoon on the 29th, a Category 3 typhoon on the 30th, and finally a super typhoon on the 31st of August (local time) just after it passed between the islands of Pagan and Alamagan in the Northern Marianas. Jebi then reached its peak intensity with sustained winds estimated at 175 mph by the Joint Typhoon Warning Center as it made its way into the Philippine Sea. Over the central Philippine Sea, Jebi began to recurve toward the northwest before eventually turning northward under the influence of an upper-level trough as it neared Japan.
Accumulated IMERG rainfall estimates over Japan and the surrounding region for the 1-week period from August 29 to Sept. 5, 2018 show rainfall amounts on the order of 100 mm (~4 inches, shown in red) or more covering much of the main island of Honshu and Shikoku in the south. Much of the band of rain oriented east-west across central Japan was due to a frontal system that brought rain to the area before Jebi made landfall. Credit: NASA/JAXA, Hal Pierce
As is often the case, the wind shear associated with the change in direction helped to weaken Jebi as it approached the southern part of Japan. Nevertheless, Jebi was the strongest typhoon to make landfall in Japan in 25 years when it came ashore over the eastern end of Shikoku, the smallest of Japan’s four main islands, Tuesday, September 4th around noon (local time), where winds gusts of up to 129 mph were reported. Jebi then crossed the southern coast of the main island of Honshu near Kobe, bringing heavy rains and high winds to the region.
The Integrated Multi-satellitE Retrievals for GPM (the Global Precipitation Measurement mission) or IMERG is used to estimate precipitation from a combination of passive microwave sensors, including GPM’s GMI microwave sensor and geostationary IR (infrared) data. Accumulated IMERG rainfall estimates over Japan and the surrounding region for the 1-week period from August 29 to Sept. 5, 2018 show rainfall amounts on the order of 100 mm (~4 inches) or more covering much of the main island of Honshu and Shikoku in the south. Much of the band of rain oriented east-west across central Japan was due to a frontal system that brought rain to the area before Jebi made landfall.
GPM is a joint satellite mission between NASA and the Japan Aerospace Exploration Agency, JAXA.
Jebi contributed much of the rainfall over Shikoku and most of the rainfall over the south central coastal regions of Honshu where it made landfall before adding to the rainfall amounts across central Honshu.
So far, the storm is being blamed for 11 fatalities and as many as 300 injuries in Japan. The storm also caused major flooding at Kansai International Airport near Osaka where wind gusts of at least 113 mph were reported. The storm also drove a tanker into the bridge connecting the airport to the mainland stranding many passengers.
By Steve Lang
NASA’s Goddard Space Flight Center
Sep. 04, 2018 – NASA Sees Landfall of Tropical Storm Jebi
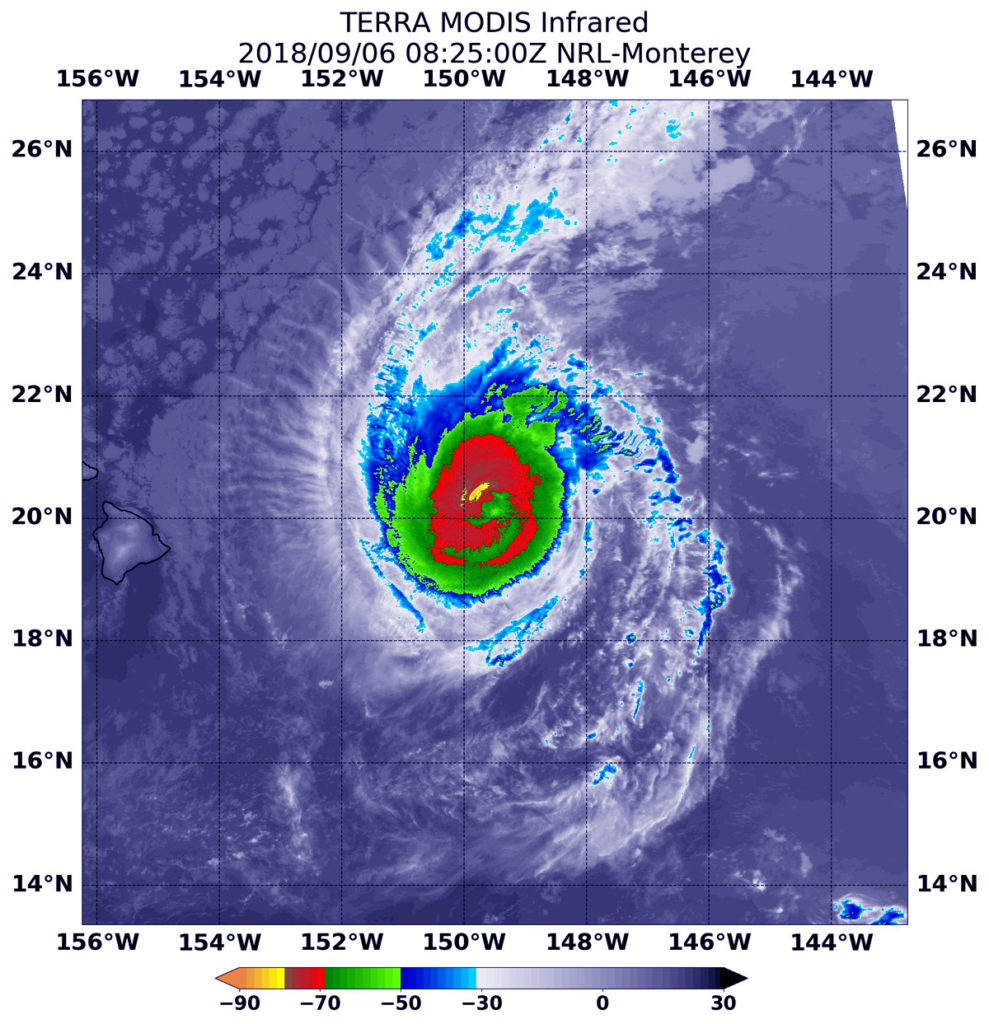
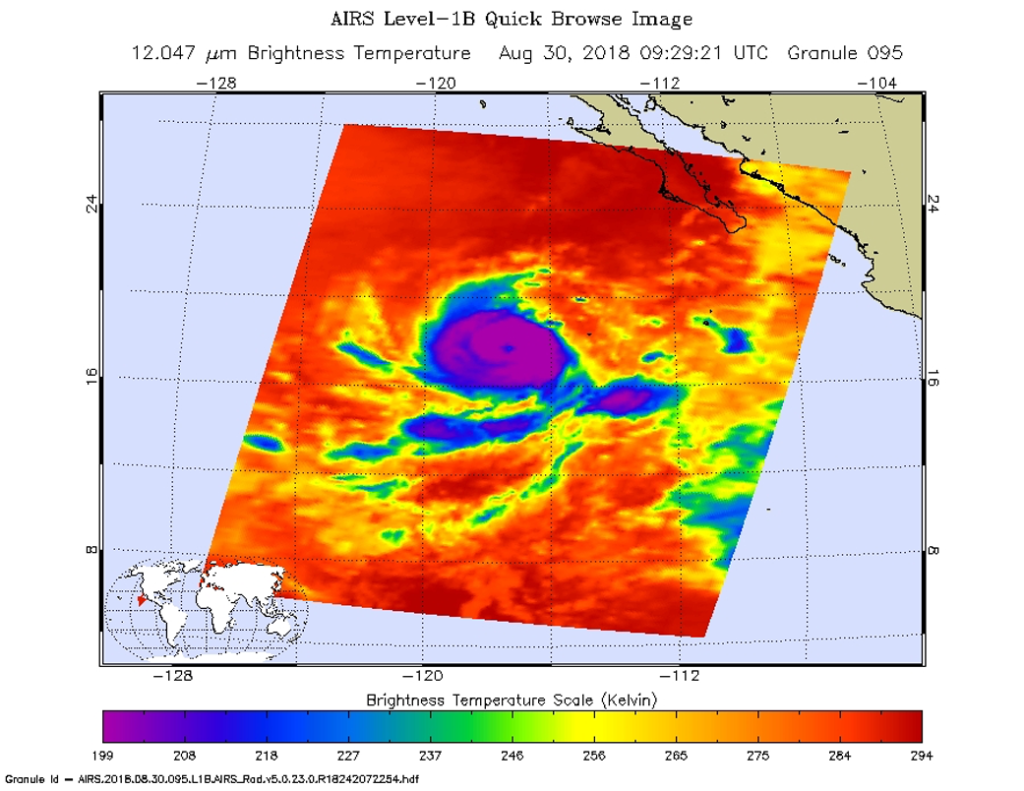
When NASA’s Aqua satellite passed over Tropical Storm Jebi on Sept. 4 at 12:17 a.m. EDT (417 UTC) it had made landfall in southeastern Japan. The Atmospheric Infrared Sounder or AIRS instrument analyzed the storm in infrared light which provides temperature information. Temperature is important when trying to understand how strong storms can be. The higher the cloud tops, the colder and the stronger they are.
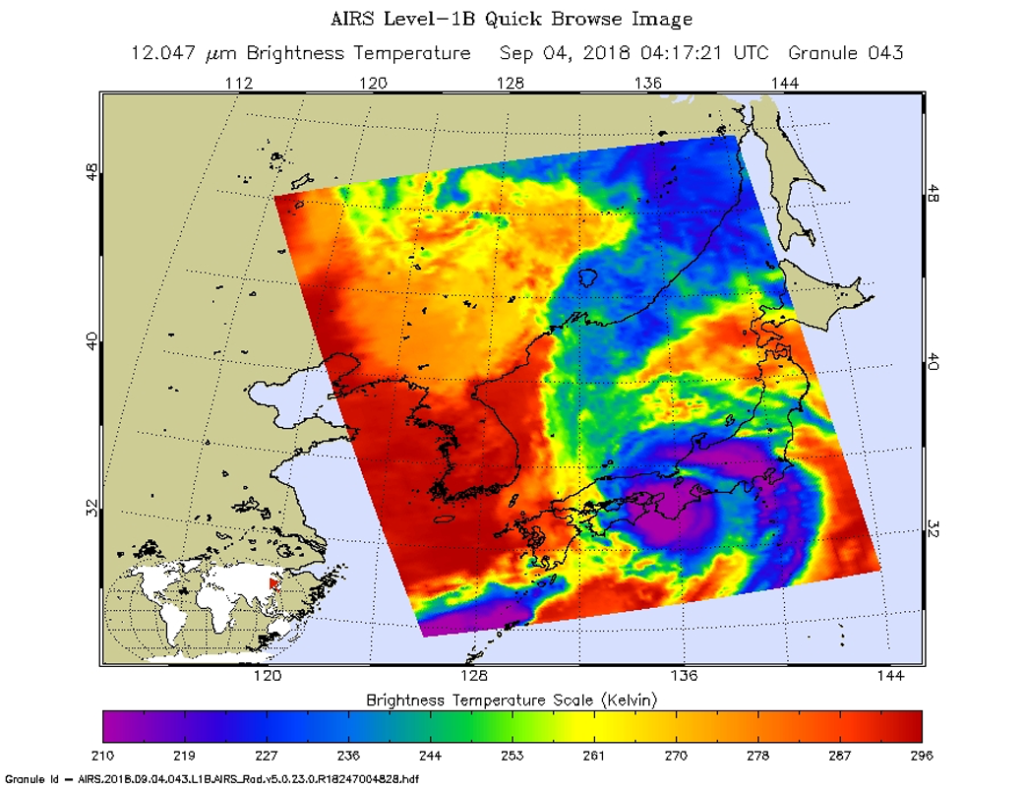
AIRS saw coldest cloud top temperatures being pushed away from the center by strong vertical wind shear. Those cloud top temperatures were as cold as minus 63 degrees Fahrenheit (minus 53 degrees Celsius). Storms with cloud top temperatures that cold have the capability to produce heavy rainfall.
At 11 a.m. EDT (1500 UTC) on Sept. 4, the Joint Typhoon Warning Center issued the final warning on Jebi. At that time the center of Jebi was located near latitude 38.9 degrees north and longitude 137.7 degrees east. The tropical storm was about 185 nautical miles west-southwest of Misawa, Japan. Jebi was moving toward the north-northeast at 45 mph (39 knots/72kph). Maximum sustained winds were near 63 mph (55 knots/102 kph) with higher gusts.
Jebi’s center crossed near Kyoto before it emerged into the Sea of Japan where it is getting caught up in the mid-latitude westerly jet stream. Jebi is in the process of becoming extra-tropical over the Sea of Japan as its wind field expands. Jebi should finish transition by Sept 5.
By Rob Gutro
NASA’s Goddard Space Flight Center
Aug. 31, 2018 – NASA Finds Super Typhoon Jebi Undergoing Eyewall Replacement
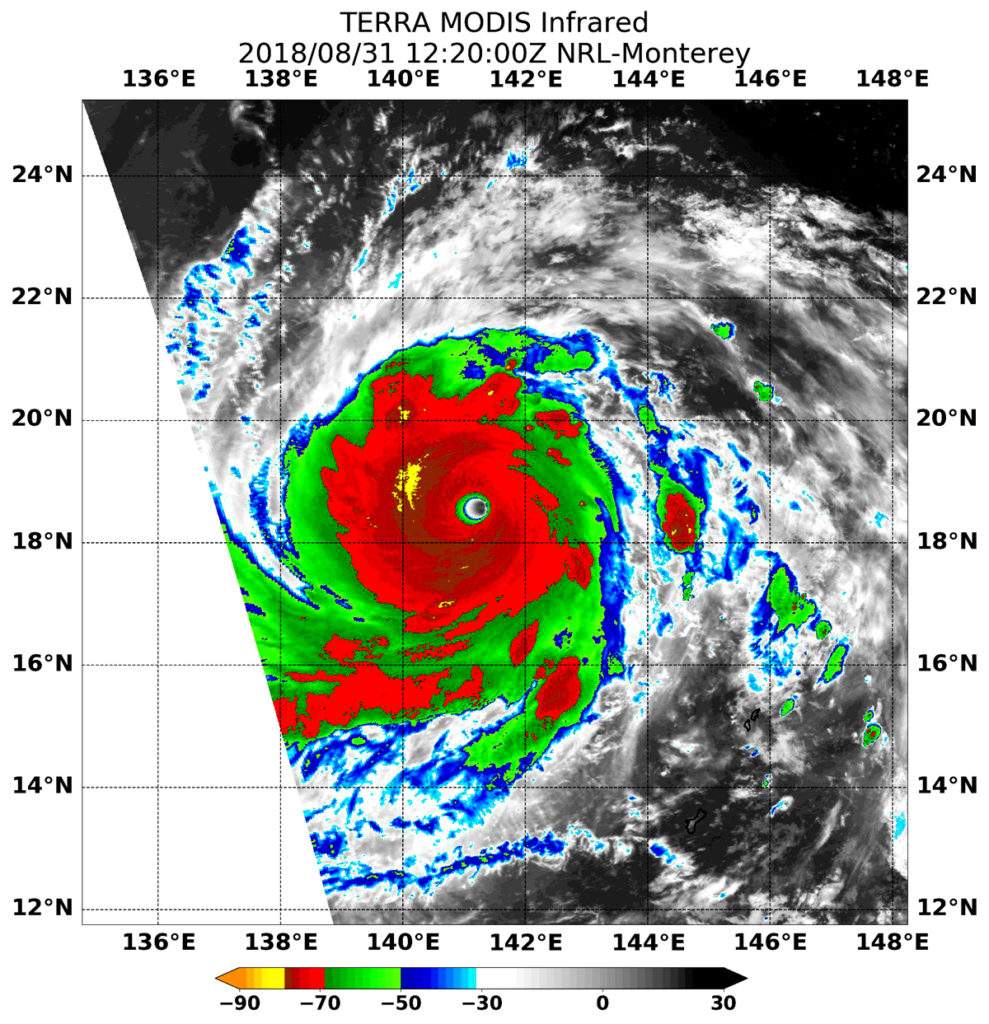
The tropical cyclone known as Jebi has intensified into a super typhoon and NASA’s Terra satellite found it was undergoing eyewall replacement. Terra found powerful storms around the 15 nautical-mile wide eye in this Category 5 storm.
When Terra passed over Super Typhoon Jebi it appeared to be undergoing eyewall replacement. Mature, intense tropical cyclones can and often undergo an eyewall replacement cycle. That happens when a new eyewall or ring of thunderstorms within the outer rain bands forms further out from the storm’s center, outside of the original eye wall. Then, that outer ring of thunderstorms chokes off the original eye wall, starving it of moisture and momentum. Eventually, if the cycle is completed, the original eye wall of thunderstorms dissipates and the new outer eye wall of thunderstorms contracts and replace the old eye wall. The storm’s intensity can fluctuate over this period, initially weakening as the inner eye wall fades before again strengthening as the outer eye wall contracts.
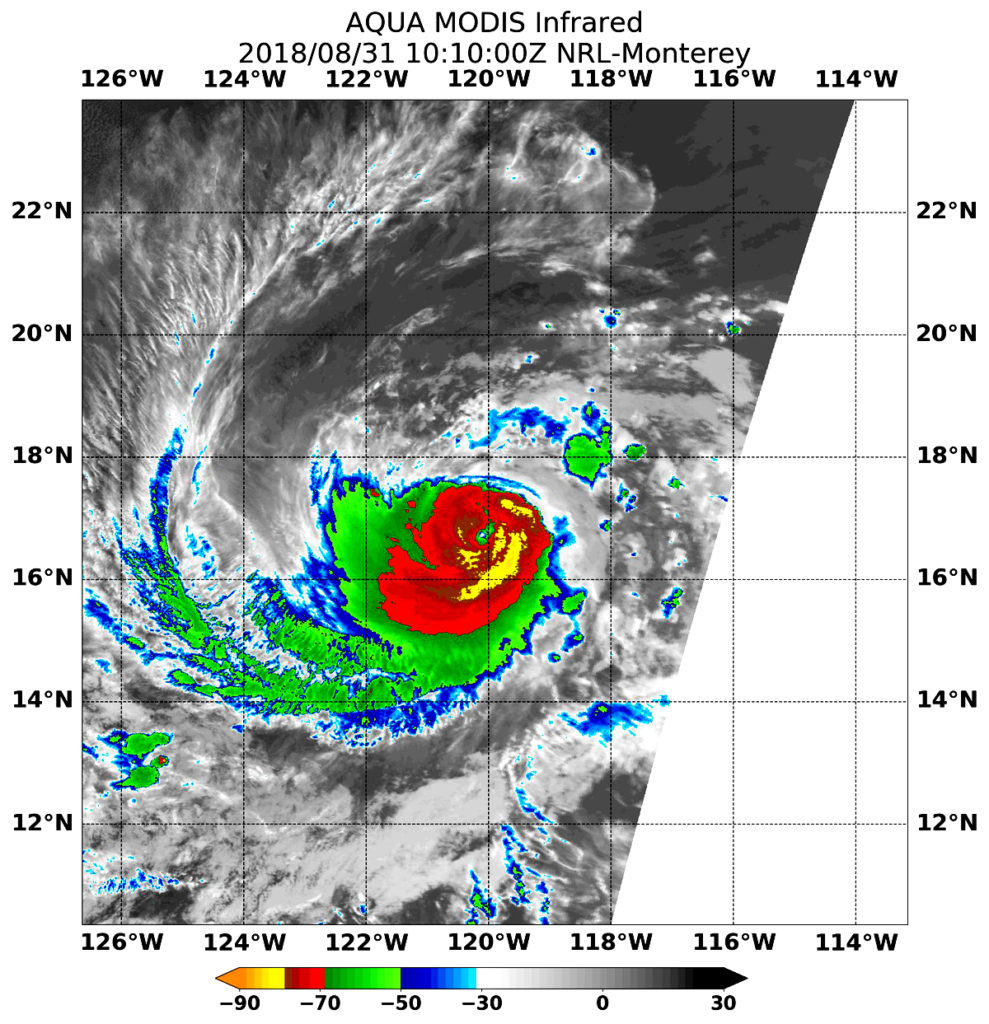
On Aug. 31 at 7:15 a.m. EDT (1150 UTC) the Moderate Resolution Imaging Spectroradiometer or MODIS instrument aboard NASA’s Terra satellite found the coldest temperatures of the strongest thunderstorms around Jebi’s eye and west of the center. They were as cold as or colder than minus 80 degrees Fahrenheit (minus 62.2 Celsius). Those powerful storms were embedded in a large area of storms where cloud top temperatures were as cold as or colder than minus 70 degrees Fahrenheit (minus 56.6 degrees Celsius). NASA research has shown that storms with cloud top temperatures that cold (that are very high in the troposphere) have the capability to generate heavy rain.
At 11 a.m. EDT (1500 UTC) Super Typhoon Jebi’s maximum sustained winds were near 172 mph (150 knots/278 kph). Jebi’s eye was centered near 18.8 degrees north latitude and 141.0 degrees east longitude, or about 316 nautical miles northwest of Saipan. Jebi was moving to the west-northwest at 14 mph (12 knots/22 kph).
The Joint Typhoon Warning Center (JTWC) expects Jebi to start weakening but it is forecast to make landfall between Kyoto and Tokyo, Japan on Sept. 4.
For updated forecasts, visit: http://www.prh.noaa.gov/cphc
By Rob Gutro
NASA’s Goddard Space Flight Center
Aug. 30, 2018 – NASA Sees Typhoon Jebi Moving through Northwestern Pacific
NASA’s Aqua satellite passed over Typhoon Jebi in the Northwestern Pacific Ocean and saw a well-organized typhoon with a small eye.

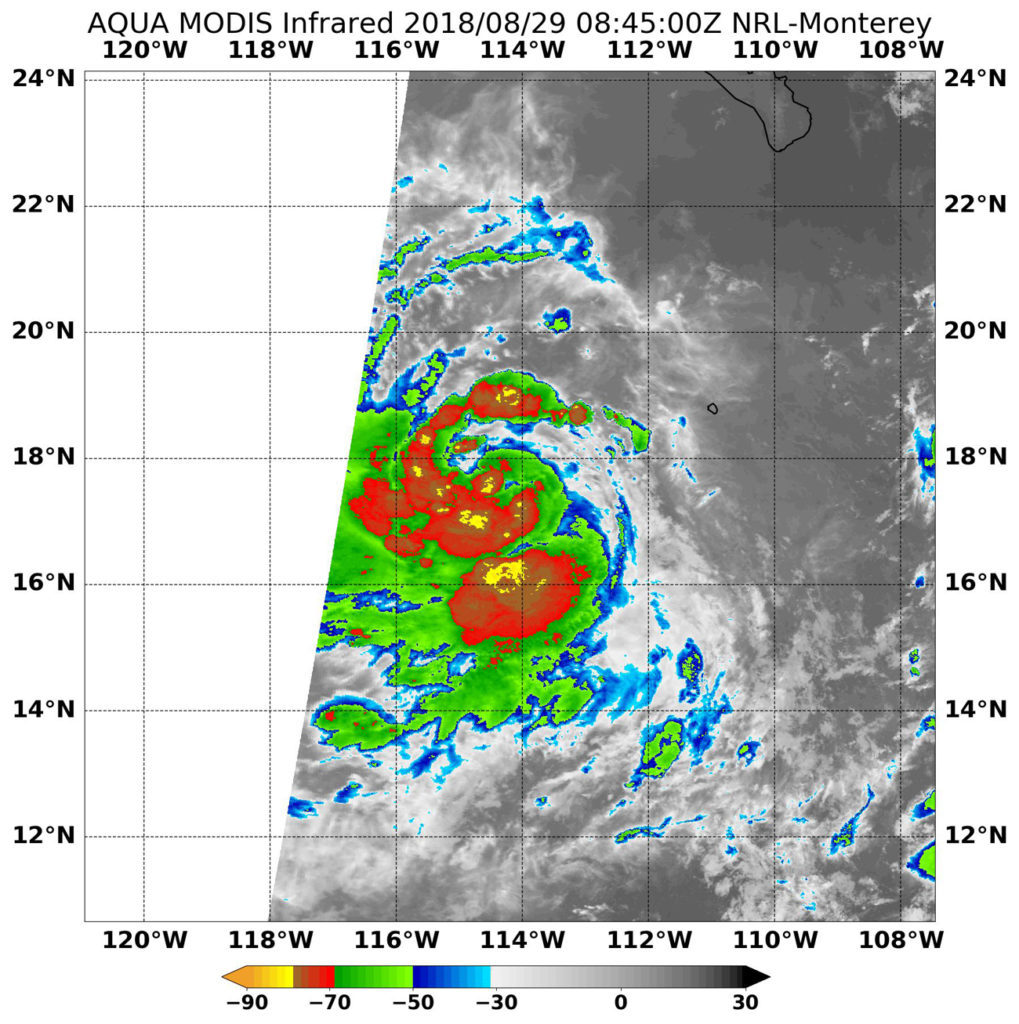
NASA’s Aqua satellite passed over Jebi on Aug. 29 at 11:53 p.m. EDT (Aug. 30 at 0353 UTC), the Atmospheric Infrared Sounder or AIRS instrument analyzed the storm in infrared and near visible light. Enhanced infrared satellite image showed deepening convection and colder cloud tops encircling the eye.
Forecasters at the Joint Typhoon Warning Center noted “While the structure continues to improve, winds will lag slightly as the primary circulation catches up to the secondary circulation represented by convection. The environment remains favorable for continued intensification with warm sea surface temperatures, low vertical wind shear, and radial outflow.”
On Aug. 30 at 11 a.m. EDT (1500 UTC), the eye of Typhoon Jebi was located near latitude 17.8 degrees north and longitude 146.2 degrees west. That’s about 161 nautical miles north-northeast of Saipan.
Jebi was moving toward the west near 14 mph (12 knots/22kph). Maximum sustained winds have increased to near 126.6 mph (110 knots/203.7 kph) with higher gusts. Norman is a category 4 hurricane on the Saffir-Simpson Hurricane Wind Scale. Some additional strengthening is forecast during the next 12 to 24 hours.
Jebi is expected to strengthen and maintain that strength for one and one half days, before finally starting a weakening trend on Sept. 1. Jebi is forecast to pass to the south and west of Iwo To island on the way to the big island of Japan.
By Rob Gutro
NASA’s Goddard Space Flight Center
Aug. 29, 2018 – NASA’s GPM Satellite Sees Jebi as Another Tropical Threat To Japan
Japan has been afflicted by several tropical cyclones and other extreme weather this summer. GPM analyzed Typhoon Jebi as it was making its way toward Japan.

The Joint Typhoon Warning Center (JTWC) predicts that yet another typhoon called Jebi will be approaching the main islands of Japan early next week. Warm ocean temperatures and low vertical wind shear are providing a favorable environment for Jebi’s intensification. The JTWC predicts that the typhoon will have peak sustained winds of 115 knots (132 mph) as it moves over the northern Pacific Ocean toward Japan next week.
The Global Precipitation Measurement mission or GPM core observatory satellite passed above on August 28, 2018 at 2:16 p.m. EDT (1816 UTC) when Jebi was still a tropical storm. The GPM satellite’s Microwave Imager (GMI) and Dual-Frequency Precipitation Radar (DPR) instruments collected data in a swath that was centered west of tropical storm Jebi’s center of circulation. The most powerful convective storms scanned by the satellite’s radar were found in an intense feeder band of thunderstorms south of Jebi’s center of circulation. GPM’s radar (DPR Ku Band) measured precipitation falling at a rate of over 87 mm (3.4 inches) per hour in that line of storms.
The GPM core observatory satellite passed above on August 28, 2018 at 2:16 p.m. EDT (1816 UTC) when Jebi was still a tropical storm. GPM found in an intense feeder band of thunderstorms south of Jebi’s center where precipitation was falling at a rate of over 87 mm (3.4 inches) per hour. This view looking toward the southwest, reveals that downpours in the feeder band south of Jebi’s center were found by the satellite to reach heights above 13.4 km (8.3 miles). Credit: NASA/JAXA, Hal Pierce
At NASA’s Goddard Space Flight Center in Greenbelt, Md. GPM’s radar data (DPR Ku Band) was used here to show a simulated 3D view of tropical storm Jebi’s radar reflectivity values. This DPR view, looking toward the southwest, reveals that downpours in the feeder band south of Jebi’s center were returning radar reflectivity values of over 52 dBZ to the satellite. A few of these powerful storms were found by the satellite to reach heights above 13.4 km (8.3 miles).
GPM is a joint mission between NASA and the Japan Aerospace Exploration Agency, JAXA.
On Aug. 29 at 11 a.m. EDT (1500 UTC), Jebi’s maximum sustained winds were near 80 mph (70 knots/129.6 kph). Jebi was centered near 17.4 degrees north latitude and 150.5 degrees east longitude. Typhoon Jebi was located approximately 330 nautical miles east-northeast of Saipan, and was moving to the west.
Jebi is forecast to move west and stay well north of Guam then curve to the west of Iwo To and head north toward Japan.
By Rob Gutro
NASA’s Goddard Space Flight Center
Aug. 28, 2018 – NASA Finds a Comma-Shaped Tropical Storm Jebi in Water Vapor
When NASA’s Terra satellite analyzed water vapor within Tropical Storm Jebi in the Northwestern Pacific Ocean on Aug. 28 found the storm had taken on the classic comma-shape of an organized storm.

Because the storm has strengthened and is now threatening populated areas, a Typhoon Watch is in effect for Agrihan, Pagan and Alamagan in the in the CNMI. The CNMI is the Northern Mariana Islands, officially the Commonwealth of the Northern Mariana Islands. A Typhoon Watch means destructive winds of 74 mph or more are possible within the next 48 hours.
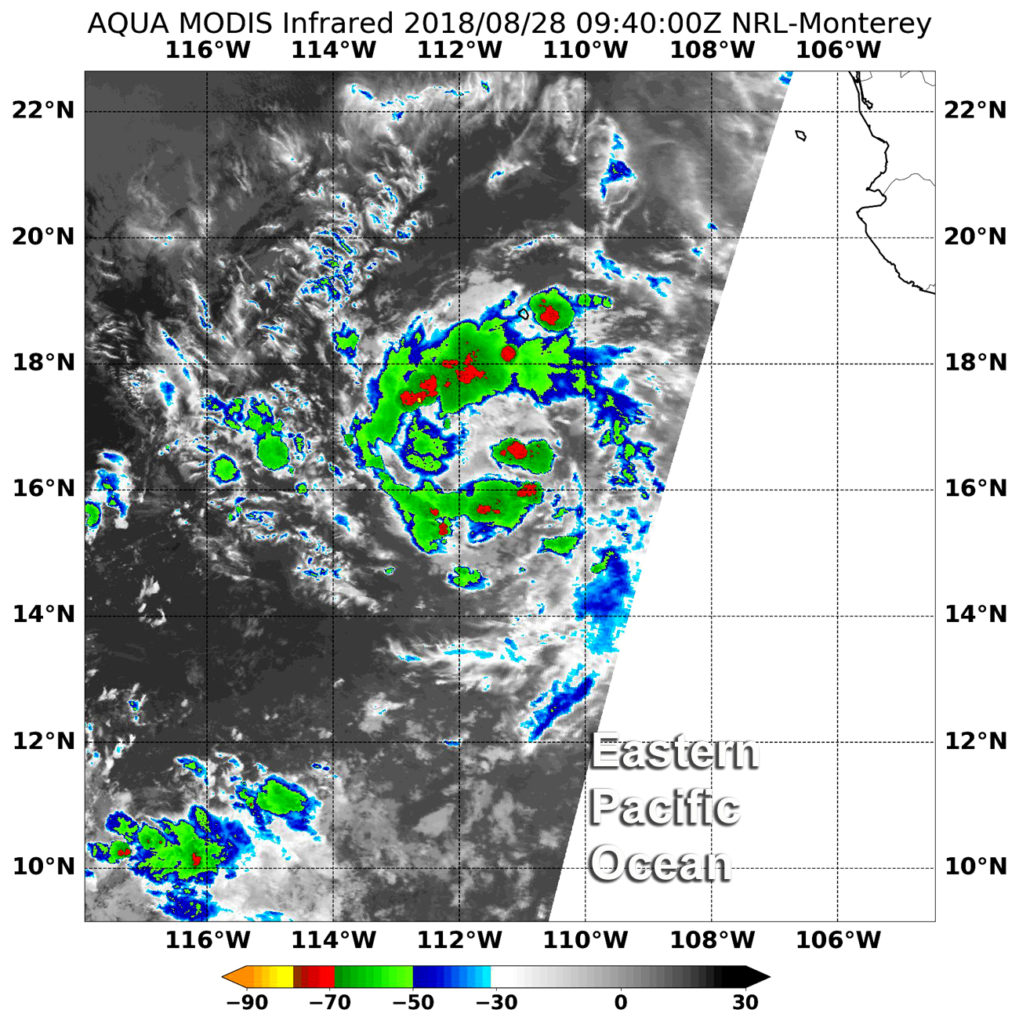
Tropical Depression 25W strengthened into a tropical storm on Aug. 28 and was renamed Jebi. NASA’s Terra satellite passed over Jebi on Aug. 28 at 7:55 a.m. EDT (1155 UTC) and the Moderate Resolution Imaging Spectroradiometer or MODIS instrument gathered water vapor content and temperature information.
Water vapor analysis of tropical cyclones tells forecasters how much potential a storm has to develop. Water vapor releases latent heat as it condenses into liquid. That liquid becomes clouds and thunderstorms that make up a tropical cyclone. Temperature is important when trying to understand how strong storms can be. The higher the cloud tops, the colder and the stronger they are.
MODIS saw coldest cloud top temperatures were as cold as minus 70 degrees Fahrenheit (minus 56.6 degrees Celsius) around the center of circulation and in a thick band of thunderstorms spiraling into the center from the east and southeast. Storms with cloud top temperatures that cold have the capability to produce heavy rainfall.
The National Weather Service (NWS) in Tiyan, Guam noted at 11 a.m. EDT (1 a.m. CHST local time/1500 UTC) on Aug. 28, the center of Tropical Storm Jebi was located near latitude 16.8 degrees north and longitude 158.4 degrees East. That’s about 590 miles east of Alamagan and 600 miles east of Pagan.
Tropical Storm Jebi is moving toward the northwest at 10 mph. It is expected to make a turn toward the west with a slight increase in forward speed over the next 24 hours.
Maximum sustained winds have increased to 45 mph. Tropical Storm Jebi is forecast to intensify through Thursday, Aug. 30.
For local effects in the CNMI, visit: https://forecast.weather.gov/product.php?issuedby=PQ1&product=HLS&site=nws&format=txt
For updated forecasts from the National Weather Service in Tiyan, Guam: http://www.prh.noaa.gov/guam/cyclone.php
By Rob Gutro
NASA’s Goddard Space Flight Center
Aug. 27, 2018 – NASA Looks at Water Vapor Concentration in Tropical Depression 25W
When NASA’s Terra satellite passed over the Northwestern Pacific Ocean on Aug. 27 it analyzed water vapor within newly formed Tropical Depression 25W and revealed three areas of strong concentrations.
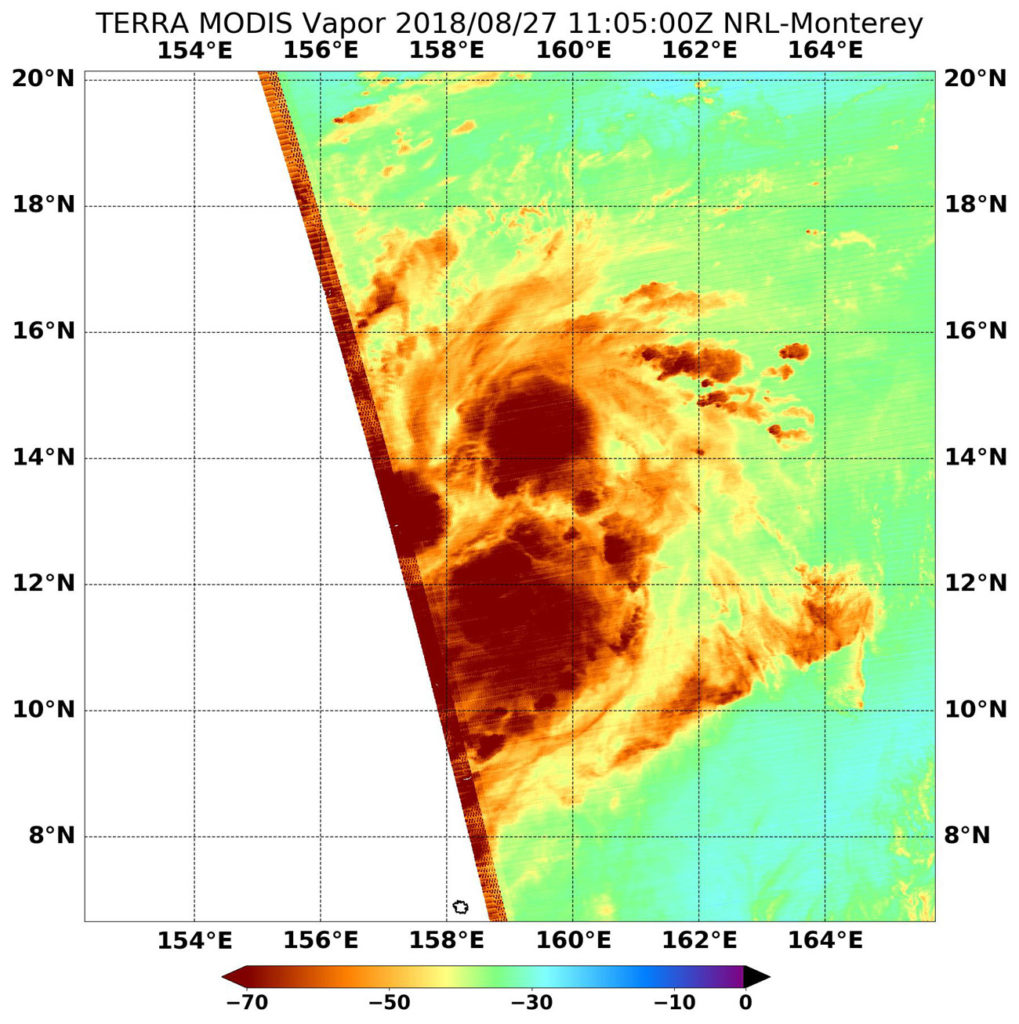
The low pressure area previously known as System 94W strengthened and consolidated enough to be re-classified as a depression. NASA’s Terra satellite passed over 25W on Aug. 27 at 7:05 a.m. EDT (1105 UTC) and the Moderate Resolution Imaging Spectroradiometer or MODIS instrument gathered water vapor content and temperature information.
Water vapor analysis of tropical cyclones tells forecasters how much potential a storm has to develop. Water vapor releases latent heat as it condenses into liquid. That liquid becomes clouds and thunderstorms that make up a tropical cyclone. Temperature is important when trying to understand how strong storms can be. The higher the cloud tops, the colder and the stronger they are.
MODIS saw coldest cloud top temperatures were as cold as minus 70 degrees Fahrenheit (minus 56.6 degrees Celsius) in three areas around the center of circulation. Storms with cloud top temperatures that cold have the capability to produce heavy rainfall.
The National Weather Service (NWS) in Tiyan, Guam noted at 11 a.m. EDT (1 a.m. CHST local time/1500 UTC) on Aug. 27, the center of Tropical Depression 25W was located near Latitude 14.5 degrees North and Longitude 158.4 degrees East. That’s about 345 miles northwest of Enetewak, and about 525 miles north of Pohnpei.
There are no watches or warnings in effect. NWS said “Residents of the Northern Marianas Islands…including Agrihan, Pagan and Alamagan should carefully monitor the progress of Tropical Depression 25W.”
Tropical Depression 25W is moving toward the north-northwest at 10 mph. It is expected to make a turn toward the northwest with little change in forward speed during the next 24 hours.
Maximum sustained winds have increased to 35 mph. Tropical Depression 25W is forecast to intensify through Wednesday possibly becoming a tropical storm.
For updated forecasts from the National Weather Service in Tiyan, Guam: http://www.prh.noaa.gov/guam/cyclone.php