Kammuri – Northwestern Pacific Ocean

Nov. 28, 2019 – NASA-NOAA Satellite Analyzes a Strengthening Typhoon Kammuri

NASA-NOAA’s Suomi NPP satellite provided forecasters with infrared and nighttime views of Typhoon Kammuri that showed the storm continued to strengthen. Satellite imagery provided a look at the clouds and storms over the storm’s developing eye.

Suomi NPP infrared image of Kammuri
The Visible Infrared Imaging Radiometer Suite (VIIRS) instrument aboard NASA-NOAA’S Suomi NPP provided an infrared image of Kammuri on Nov. 28 at 1:39 p.m. EST (1639 UTC) that shows it is consolidating and strengthening. The circulation center was obscured by the central dense overcast. Credit: NASA/NOAA/UWM-SSEC-CIMSS, William Straka III

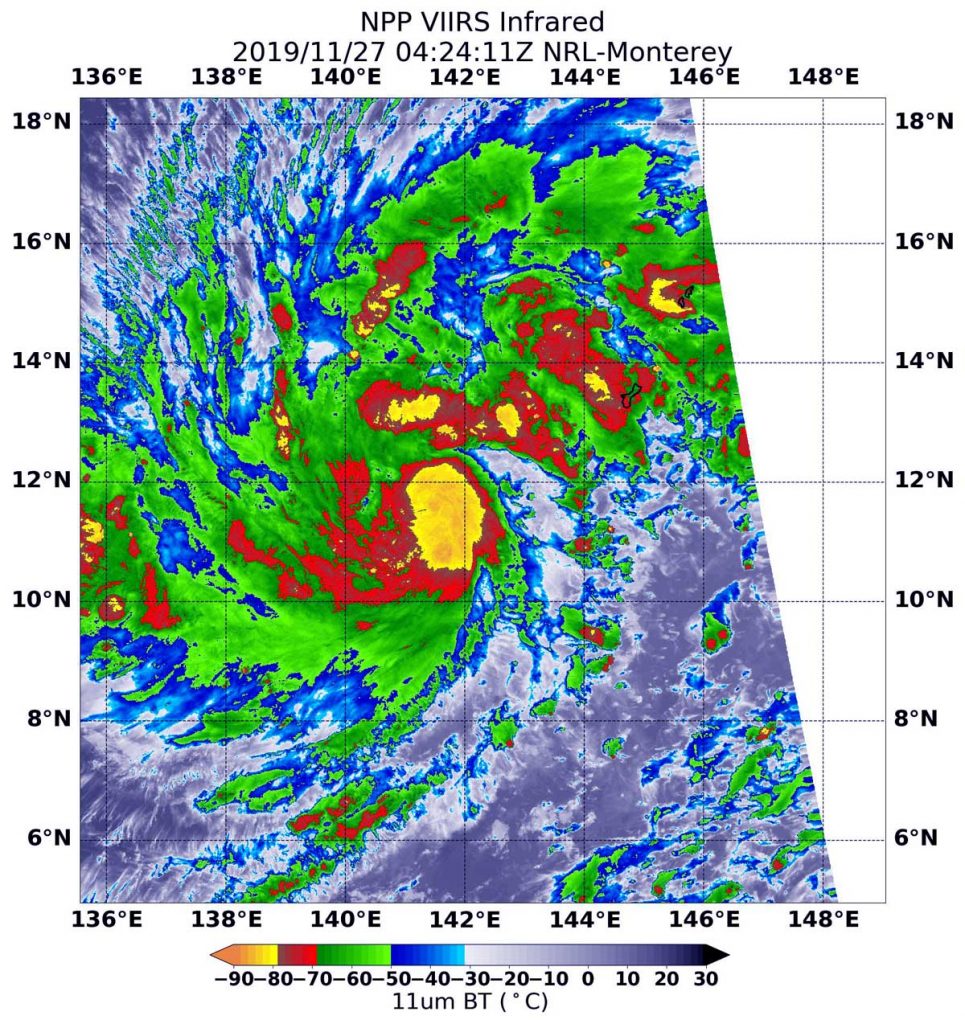
Visible, infrared and microwave imagery from NASA satellites help forecasters understand if a storm is organizing or weakening. The Visible Infrared Imaging Radiometer Suite (VIIRS) instrument aboard NASA-NOAA’S Suomi NPP provided an infrared and nighttime image of Kammuri on Nov. 28 at 1:39 p.m. EST (1639 UTC) that shows it is consolidating and strengthening. The circulation was obscured by the central dense overcast or CDO. CDO is a large central area of thunderstorms surrounding its circulation center, caused by the formation of its eyewall. It can be round, angular, oval, or irregular in shape.

Suomi NPP found a noticeable increase in the size of the CDO, perhaps an indication of some strengthening of the storm.

William Straka III, a researcher at the University of Wisconsin, Madison, Space Science and Engineering Center’s Cooperative Institute for Meteorological Satellite Studies used the satellite data to create imagery. Straka said, “Collocated observations of the location of the CDO and microwave imagery are important to help measure the intensity of a tropical cyclone, by seeing how far the center of circulation is within the storm and the temperature difference in the cloud tops in the CDO. Since microwave imagers can see ‘into the cloud,’ this helps in determining the location of the tropical system.”

Suomi NPP nighttime imagery of Kammuri
The Visible Infrared Imaging Radiometer Suite (VIIRS) instrument aboard NASA-NOAA’S Suomi NPP provided a night-time image of Kammuri on Nov. 28 at 1:39 p.m. EST (1639 UTC). Credit: NASA/NOAA/UWM-SSEC-CIMSS, William Straka III

Straka also noted “However, an important thing to note is that the circulation in one satellite channel is not completely surrounded by the convection.”

 At 7 p.m. CHST, local time, Guam (4 a.m. EST/0900 UTC) on Nov. 29, the National Weather Service in Tiyan, Guam noted that the center of typhoon Kammuri was located near latitude 14.5 degrees north and longitude 137.3 degrees east. That puts the eye of Kammuri about 350 miles north-northwest of Ulithi, 350 miles north of Yap, 395 miles north-northwest of Fais and 505 miles west of Guam.

Kammuri is moving west-northwest at 7 mph. It is expected to make a turn toward the west-southwest with a slight increase in forward speed over the next 24 hours. Maximum sustained winds have increased to 85 mph. Kammuri is forecast to maintain this intensity through Saturday, Nov. 30. Typhoon force winds extend outward from the center up to 35 miles. Tropical storm force winds extend outward from the Center up to 145 miles.

The forecast track for Kammuri takes the storm due west toward the Philippines. The forecast from Joint Typhoon Warning Center has Kammuri intensifying to about 125 knots (144 mph/232 kph) by December 1, 2019, which would be the equivalent to a Category 4 storm in the Atlantic. The storm is expected to make landfall in the central and northern Philippines on Dec. 3.

Typhoons and hurricanes are the most powerful weather event on Earth. NASA’s expertise in space and scientific exploration contributes to essential services provided to the American people by other federal agencies, such as hurricane weather forecasting.

For updated forecasts. Visit: https://www.weather.gov/gum/Cyclones

By Rob Gutro 
NASA’s Goddard Space Flight Center

Kammuri – Northwestern Pacific Ocean

Nov. 27, 2019 – NASA-NOAA Satellite Finds Tropical Storm Kammuri Strengthening

NASA-NOAA’s Suomi NPP satellite passed over Tropical Storm Kammuri in the Northwestern Pacific Ocean and found several areas of very strong thunderstorms.

Suomi NPP image of Kammuri
NASA-NOAA’s Suomi NPP satellite passed over Tropical Storm Kammuri in the Northwestern Pacific Ocean and the VIIRS instrument aboard captured this image of the storm on Nov. 27 at 0424 UTC (Nov. 26 at 11:24 p.m. EST). There were several areas (yellow) within where cloud top temperatures were as cold as minus 80 degrees Fahrenheit (minus 62.2 Celsius), indicating powerful storms. Credit: NASA/NRL

The Visible Infrared Imaging Radiometer Suite (VIIRS) instrument aboard Suomi NPP provided an infrared image of the storm on Nov. 27 at 0424 UTC (Nov. 26 at 11:24 p.m. EST). Infrared imagery reveals cloud top temperatures, and the higher the cloud top, the colder it is, and the stronger the storm.

The VIIRS instrument found several areas within where cloud top temperatures were as cold as minus 80 degrees Fahrenheit (minus 62.2 Celsius), indicating powerful storms. Kammuri continued to strengthen and consolidate. The most powerful thunderstorms were located around the center of circulation and in a fragmented band of thunderstorms north of the center. Storms with cloud tops that cold have been found to generate heavy rainfall.

At 4 a.m. EST (0900 UTC7 p.m. CHST, Guam local time) on Nov. 27,  the National Weather Service in Tiyan, Guam noted the center of Tropical Storm Kammuri was located near latitude 11.7 degrees north and longitude 140.6 degrees east. Kammuri is centered about 130 miles north-northeast of Ulithi, 135 miles north of Fais, 230 miles northeast of Yap and about 310 miles west-southwest of Guam.

Guam, Rota, Tinian, and Saipan are no longer under a Tropical Storm Warning. However, a flash flood watch remains in effect for Guam and the Northern Marianas.

Kammuri is moving west at 16 mph. It is expected to make a turn toward the north-northwest with a decrease in forward speed over the next 24 hours. Maximum sustained winds remain at 65 mph. Tropical storm force winds extend outward from the center up to 240 miles to the northeast and up to 155 miles elsewhere.

Kammuri is forecast to intensify through Thursday possibly becoming a typhoon. It is also forecast to turn north and then head west after two days toward the Philippines.

Typhoons and hurricanes are the most powerful weather event on Earth. NASA’s expertise in space and scientific exploration contributes to essential services provided to the American people by other federal agencies, such as hurricane weather forecasting.

For updated forecasts, visit:  https://www.weather.gov/gum/

By Rob Gutro 
NASA’s Goddard Space Flight Center

Kammuri – Northwestern Pacific Ocean

Nov. 26, 2019 – Satellite Tracking Guam’s Tropical Storm Kammuri

The National Weather Service in Guam has posted warnings as Tropical Storm Kammuri lingers nearby. The NOAA-20 satellite provided forecasters with an image of the storm.

NOAA-20 image of Kammuri
NOAA-20 provided a visible image of Kammuri on Nov. 26 at 0354 UTC (Nov. 25 at 10:54 p.m. EST) that shows it is consolidating and strengthening. The image showed bands of thunderstorms wrapping into its low level center. Credit: NOAA /NRL

Tropical Depression 29W formed on Nov. 25, and when it strengthened into a tropical storm on Nov. 26 it was renamed Kammuri.

Visible imagery from NASA satellites help forecasters understand if a storm is organizing or weakening. The Visible Infrared Imaging Radiometer Suite (VIIRS) instrument aboard NOAA-20 provided a visible image of Kammuri on Nov. 26 at 0354 UTC (Nov. 25 at 10:54 p.m. EST) that shows it is consolidating and strengthening.  The image showed bands of thunderstorms wrapping into its low level center.

On Nov. 26 (and Nov. 27 local time), a tropical storm warning remains in effect for Guam, Rota, Tinian and Saipan. Tropical storm conditions, including winds of 39 mph or more, are occurring and will persist through noon (local time on Nov. 27) today.

On Nov. 26 at 10 a.m. EST (1500 UTC/1 a.m. CHST on Nov. 27) The National Weather Service in Tiyan, Guam noted that the “center of Tropical Storm Kammuri was located near latitude 11.4 degrees north and longitude 144.4 degrees east. Kammuri is moving west at 24 mph. Kammuri will maintain this motion through tonight [Wed. Nov. 27 local time], then turn toward the northwest on Thursday. Kammuri will decrease in forward speed tonight. Maximum sustained winds have increased to 45 mph. Kammuri is forecast to intensify in the next few days and could become a typhoon on Thursday. Kammuri will be well west of the Marianas.” The storm is at its closest to Guam now.

Kammuri is forecast to move west-northwest, later northwest and strengthen into a typhoon.

NASA launched JPSS-1 in Nov. 2017. JPSS-1 reached polar orbit on Saturday, November 18, and it officially became known as NOAA-20. JPSS-1 joined the NOAA/NASA Suomi NPP satellite in the same polar orbit, and will also provide scientists with observations of atmospheric temperature and moisture, clouds, sea-surface temperature, ocean color, sea ice cover, volcanic ash, and fire detection.

Typhoons and hurricanes are the most powerful weather event on Earth. NASA’s expertise in space and scientific exploration contributes to essential services provided to the American people by other federal agencies, such as hurricane weather forecasting.

For updated forecasts. visit: https://www.weather.gov/gum/Cyclones

By Rob Gutro 
NASA’s Goddard Space Flight Center

Rita – Southern Pacific Ocean

Nov. 26, 2019 – NASA Finds Heavy Rain Potential in Tropical Storm Rita

NASA analyzed the cloud top temperatures in Tropical Storm Rita using infrared light to determine the strength of the storm. Rita has triggered warnings in the island nation of Vanuatu.

AIRS image of Rita
On Nov. 26 at 0224 UTC (Nov. 25 at 9:24 p.m. EST) NASA’s Aqua satellite analyzed Tropical Storm Rita’s clouds using the AIRS instrument. AIRS showed the strongest storms southeast of the center where the coldest cloud top temperatures as cold as or colder than 210 Kelvin (purple) minus 81 degrees Fahrenheit (minus 63.1 degrees Celsius) around the center. Credit: NASA JPL/Heidar Thrastarson

One of the ways NASA researches tropical cyclones is using infrared data that provides temperature information. Cloud top temperatures identify where the strongest storms are located. The stronger the storms, the higher they extend into the troposphere, and the colder the cloud top temperatures.

On Nov. 26 at 0224 UTC (Nov. 25 at 9:24 p.m. EST) NASA’s Aqua satellite analyzed the storm using the Atmospheric Infrared Sounder or AIRS instrument. The AIRS imagery showed the strongest storms were southeast of the center. In those areas, AIRS found coldest cloud top temperatures as cold as or colder 210 Kelvin minus 81 degrees Fahrenheit (minus 63.1 degrees Celsius). NASA research has shown that cloud top temperatures that cold indicate strong storms that have the capability to create heavy rain.

Animated enhanced infrared satellite imagery shows that convection (rising air that forms the thunderstorms that make up a tropical cyclone) is rapidly decaying. That means that thunderstorms cannot form easily. The bulk of the clouds and showers are being pushed to the southeast of the low-level center of circulation by northwesterly winds.

Tropical cyclones do not always have uniform strength, and some sides have stronger sides than others, so knowing where the strongest sides of the storms are located helps forecasters. NASA then provides data to tropical cyclone meteorologists so they can incorporate it in their forecasts.

At 10 a.m. EST (1500 UTC), the Joint Typhoon Warning Center (JTWC) noted that Rita was located near latitude 14.4 degrees south and longitude 169.6 degrees east, about 212 nautical miles north-northeast of Port Vila, Vanuatu. Rita was moving to the south-southwest and had maximum sustained winds of 35 knots (40 mph/65 kph). Rita was moving to the southeast and away from the islands of Vanuatu.

The National Disaster Management Office (NDMO) advises that a Yellow Alert is in effect for people in Penama and Malampa provinces.  Strong to gale force winds may be expected to the east of Penama, Malampa and Shefa Provinces.

On Wednesday, Nov. 27, 2019, the Vanuatu Meteorology and Geo-Hazards Department (VMGD), Port Vila, Vanuatu, said, “Heavy rainfalls are expected over the eastern parts of Penama, Malampa and Shefa province tonight and continuing tomorrow. A Marine strong wind warning for all coastal waters is current. High Seas warning is also current for open waters of Vanuatu close to the system.”

The JTWC expects Rita will dissipate over the next day.

Typhoons and hurricanes are the most powerful weather event on Earth. NASA’s expertise in space and scientific exploration contributes to essential services provided to the American people by other federal agencies, such as hurricane weather forecasting.

The AIRS instrument is one of six instruments flying on board NASA’s Aqua satellite, launched on May 4, 2002.

For updated forecasts from the VMGD website: www.vmgd.gov.vu

By Rob Gutro
NASA’s Goddard Space Flight Center  

Rita – Southern Pacific Ocean

Nov. 25, 2019 –  NASA Spots First Tropical Cyclone of Southern Pacific Season

The tropical cyclone season in the Southern Pacific Ocean has kicked off with Tropical Cyclone Rita, and NASA’s Aqua satellite passed over the storm and analyzed it in infrared light for temperature data.

Aqua image of Rita
On Nov. 25 at 9:05 a.m. EST (1405 UTC), the MODIS instrument aboard NASA’s Aqua satellite gathered temperature information. MODIS found a large area of powerful thunderstorms (yellow) circling Rita’s center with cloud top temperatures as cold as or colder than minus 80 degrees Fahrenheit (minus 62.2 Celsius). Cloud top temperatures that cold indicate strong storms with the potential to generate heavy rainfall. Vanuatu is seen to the southwest of the storm. Credit: NASA/NRL

Rita developed on Nov. 24 as Tropical Cyclone 1P, 452 miles north of Port Vila, Vanuatu. By 10 a.m. EST (1500 UTC) on Nov. 24, Tropical Cyclone 1P strengthened into a tropical storm and was named Rita.

NASA’s Aqua satellite used infrared light to analyze the strength of storms in newly developed Rita. Infrared data provides temperature information, and the strongest thunderstorms that reach high into the atmosphere have the coldest cloud top temperatures. On Nov. 25 at 9:05 a.m. EST (1405 UTC), the Moderate Resolution Imaging Spectroradiometer or MODIS instrument gathered that temperature information. MODIS found a large area of powerful thunderstorms circling Rita’s center with cloud top temperatures as cold as or colder than minus 80 degrees Fahrenheit (minus 62.2 Celsius). Cloud top temperatures that cold indicate strong storms with the potential to generate heavy rainfall.

At the time of the MODIS image, Rita was located northeast of Vanuatu. Because of Rita’s close proximity, there are Vanuatu warnings in effect on Nov. 26. Those warnings include a Red alert is in effect for the Torba province and a Yellow Alert applies to Penama and Sanma provinces.

On Nov. 26 at 10 a.m. EST (1500 UTC), Tropical Cyclone Rita was located near latitude 12.6 degrees south and longitude 170.3 degrees east. That is about 344 nautical miles north-northeast of Port Vila, Vanuatu. Rita was moving to the south-southeast at 3 knots. Maximum sustained winds 60 knots (69 mph/96 kph).

Rita is forecast to move south-southeast. The storm is weakening and is expected to dissipate within three days.

Typhoons and hurricanes are the most powerful weather event on Earth. NASA’s expertise in space and scientific exploration contributes to essential services provided to the American people by other federal agencies, such as hurricane weather forecasting.

By Rob Gutro
NASA’s Goddard Space Flight Center

Sebastien – Atlantic Ocean

Nov. 25, 2019 – NASA Tracking Extra-Tropical Storm Sebastien towards the U.K.

NASA’s Aqua satellite passed over eastern North Atlantic Ocean and captured an infrared view of what is now Extra-tropical cyclone Sebastien. Sebastien transitioned from a tropical storm to an extra-tropical storm on Nov. 24. It has coupled with a cold front and is now headed for the United Kingdom.

Aqua image of Sebastien
On Nov. 25 at 0400 UTC (Nov. 24 at 11 p.m. EST) the MODIS instrument that flies aboard NASA’s Aqua satellite revealed that Extra-tropical cyclone Sebastien’s strongest storms had cloud tops as cold as or colder than minus 50 degrees Fahrenheit (minus 45.5 Celsius). Credit: NASA/NRL

Sebastien’s Final Advisory

At 10 p.m. EST on Sunday, Nov. 24 (0300 UTC Nov. 25), NOAA’s National Hurricane Center (NHC) issued the final advisory on Sebastien. At that time, the center of Post-Tropical Cyclone Sebastien was located near latitude 41.0 degrees north and longitude 28.9 degrees west. It was centered 230 miles (370 km) north-northwest of the Azores Islands. Sebastien was moving toward the northeast near 40 mph (65 kph) and this motion is expected to continue for the next day or so. Maximum sustained winds are near 60 mph (95 kph) with higher gusts. Post-tropical cyclone Sebastien should maintain its intensity before merging with another low during the next day or two. The estimated minimum central pressure is 993 millibars. 

NHC’s Forecaster Latto noted “Sebastien has lost its tropical characteristics this evening. The deep convection has decoupled from the low-level circulation, and these features are now separated by a distance of 100 nautical miles and increasing. Two [satellite] passes revealed that the surface low is becoming stretched out, and there is some evidence of a boundary, possibly a front, extending northeast from the center. Furthermore, recent observations from the Azores indicated a slight temperature decrease as the center passed by to the north of those islands, suggesting that a weak cold front is associated with the cyclone. Based on all of these data, there is high confidence that Sebastien has transitioned to an extratropical cyclone.”

What does Extra-tropical Mean?

When a storm becomes extra-tropical, it means that a tropical cyclone has lost its “tropical” characteristics. The National Hurricane Center defines “extra-tropical” as a transition that implies both poleward displacement (meaning it moves toward the north or south pole) of the cyclone and the conversion of the cyclone’s primary energy source from the release of latent heat of condensation to baroclinic (the temperature contrast between warm and cold air masses) processes. It is important to note that cyclones can become extratropical and still retain winds of hurricane or tropical storm force.

NASA’s Infrared View of Sebastien

NASA’s Aqua satellite used infrared light to analyze the strength of storms in Sebastien. Infrared data provides temperature information, and the strongest thunderstorms that reach high into the atmosphere have the coldest cloud top temperatures. On Nov. 25 at 0400 UTC (Nov. 24 at 11 p.m. EST), Aqua passed over the storm after it had become associated with a cold front. The coldest cloud top temperatures were near minus 50 degrees Fahrenheit or minus 45.5 degrees Celsius. The infrared imagery revealed that the strongest precipitation had become elongated, resembling a frontal system.

Sebastien Headed to the U.K.

The United Kingdom Meteorological Service noted that rains from Sebastien are headed toward the U.K. by Tuesday. The storm is forecast to affect southern England and then move northeast. The Met Office warned that flood-ravaged areas may be affected by more heavy rain over the next several days. The U.K. Met Service issued several yellow weather warnings in southwest and northeast England as torrential showers are expected from Sebastien’s remnants. For updated forecasts, visit: https://www.metoffice.gov.uk/

Hurricanes are the most powerful weather event on Earth. NASA’s expertise in space and scientific exploration contributes to essential services provided to the American people by other federal agencies, such as hurricane weather forecasting.

By Rob Gutro
NASA’s Goddard Space Flight Center

Fung-Wong – Northwestern Pacific Ocean

Nov. 22, 2019 – NASA Examines Tropical Storm Fung-Wong’s Rainfall

NASA analyzed Tropical Storm Fung-Wong’s rainfall and found two small areas of moderate to heavy rainfall, despite being battered by strong wind shear.

GPM image of Fung-Wong
The GPM core satellite passed over Tropical Storm Fung-Wong on Nov. 22 at 3:08 a.m. EST (0808 UTC). Heaviest rainfall (pink) was north of the center falling at a rate of 1.6 inches (40 mm) per hour. Another area far north of the center showed rainfall (red) occurring at a rate of 1 inch (25 mm) per hour. Light rain (blue) was found throughout the rest of the storm. Credit: NASA/JAXA/NRL

NASA has the unique capability of peering under the clouds in storms and measuring the rate at which the rain is falling. Global Precipitation Measurement mission or GPM core passed over Fung-Wong from its orbit in space and measured rainfall rates throughout the storm on Nov. 22 at 3:08 a.m. EST (0808 UTC).

Heaviest rainfall was being pushed north of the center where it was falling at a rate of 1.6 inches (40 mm) per hour. Another area far north of the center showed heavy rainfall occurring at a rate of 1 inch (25 mm) per hour. Light rain was found throughout the rest of the storm.

In general, wind shear is a measure of how the speed and direction of winds change with altitude. Tropical cyclones are like rotating cylinders of winds. Each level needs to be stacked on top each other vertically in order for the storm to maintain strength or intensify. Wind shear occurs when winds at different levels of the atmosphere push against the rotating cylinder of winds, weakening the rotation by pushing it apart at different levels. Winds from the south were pushing against the storm and displacing the heaviest rainfall north of the center.

Seven hours later by 10 a.m. EST, the Joint Typhoon Warning Center noted that Fung-Wong had become devoid of the heavy rainfall that GPM found earlier. That’s an indication that the storm is continuing to weaken under the wind shear.

On Nov. 22 at 10 a.m. EST (1500 UTC), despite the wind shear, Tropical Storm Fung-Wong was holding onto tropical storm status with maximum sustained winds near 35 knots (40 mph/65 kph). Fung-Wong was located near latitude 24.8 degrees north and longitude 125.3 degrees east about 169 miles southwest of Kadena Air Base, Okinawa Island, Japan.

Fung-Wong is moving north-northeast and is expected to dissipate within 24 hours.

Typhoons and hurricanes are the most powerful weather event on Earth. NASA’s expertise in space and scientific exploration contributes to essential services provided to the American people by other federal agencies, such as hurricane weather forecasting.

Both the Japan Aerospace Exploration Agency, JAXA and NASA manage GPM.

By Rob Gutro
NASA’s Goddard Space Flight Center

Sebastien – Atlantic Ocean

Nov. 22, 2019 – NASA’s Infrared Analysis of Tropical Storm Sebastien Sees Wind Shear

Tropical Storm Sebastian continued to move in a northeasterly direction through the North Atlantic Ocean as NASA’s Aqua satellite passed overhead. Infrared imagery from an instrument aboard Aqua revealed very high, powerful storms with very cold cloud top temperatures in the southwestern quadrant of the storm.  It also revealed that the storm was being sheared apart by outside winds.

Aqua image of Sebastien
On Nov. 22 at 1:15 a.m. EST (0515 UTC) the MODIS instrument that flies aboard NASA’s Aqua satellite showed on area in Sebastien’s southwestern corner where cloud top temperatures were as cold as or colder than (in yellow) minus 80 degrees Fahrenheit (minus 62.2 Celsius). Credit: NASA/NRL

Tropical cyclones are made of up hundreds of thunderstorms and infrared data can show where the strongest storms are located. They can do that because infrared data provides temperature information, and the strongest thunderstorms that reach highest into the atmosphere have the coldest cloud top temperatures.

On Nov. 22 at 1:15 a.m. EST (0515 UTC), the Moderate Resolution Imaging Spectroradiometer or MODIS instrument that flies aboard NASA’s Aqua satellite used infrared light to analyze the strength of storms within the tropical cyclone. MODIS found those strongest storms only in the southwestern side of the storm where cloud top temperatures were as cold as or colder than minus 80 degrees Fahrenheit (minus 62.2 Celsius). NASA research has found that cloud top temperatures that cold indicate strong storms with the potential to generate heavy rainfall.

The reason the strongest storms were happening only in that quadrant is that outside winds from the southwest are pushing the bulk of clouds and precipitation to the northeast. In general, wind shear is a measure of how the speed and direction of winds change with altitude. Tropical cyclones are like rotating cylinders of winds. Each level needs to be stacked on top each other vertically in order for the storm to maintain strength or intensify. Wind shear occurs when winds at different levels of the atmosphere push against the rotating cylinder of winds, weakening the rotation by pushing it apart at different levels.

At 11 a.m. EST (1500 UTC), the center of Tropical Storm Sebastien was located near latitude 25.2 degrees north and longitude 55.3 degrees west about 695 miles (1,120 km) northeast of the Northern Leeward Islands.

Sebastien is moving toward the east-northeast near 15 mph (24 kph). An east-northeastward or northeastward motion at a similar forward speed is expected through the weekend of Nov. 23 and 24. Maximum sustained winds have decreased to near 50 mph (85 kph) with higher gusts.  The estimated minimum central pressure is 1,000 millibars.

The National Hurricane Center said that strong wind shear is expected to prevent Sebastien from getting better organized, so gradual weakening is anticipated. Sebastien is forecast to dissipate by early next week.

Hurricanes are the most powerful weather event on Earth. NASA researches these storms to determine how they rapidly intensify, develop and behave. NASA’s expertise in space and scientific exploration contributes to essential services provided to the American people by other federal agencies, such as hurricane weather forecasting.

By Rob Gutro
NASA’s Goddard Space Flight Center

Fung-Wong – Northwestern Pacific Ocean

Nov. 21, 2019 – NASA Tracks a Weaker Tropical Storm Fung-Wong  

NASA’s Terra satellite captured an image of Tropical Storm Fung-Wong as it continued weakening in the Northwestern Pacific Ocean.

Terra image of Fung-Wong
On Nov. 20, 2019, the MODIS instrument that flies aboard NASA’s Terra satellite provided a visible image of Tropical Storm Fung-Wong near Taiwan. Credit: NASA Worldview

In the Philippines, tropical cyclone warning Signal #1 was in effect for the Luzon province of Batanes on Nov. 21 as the storm tracks northward and away from the Philippines. The storm is expected to stay to the east of Taiwan and affect the northeastern part of the country.

On Nov. 21, the Moderate Resolution Imaging Spectroradiometer or MODIS instrument that flies aboard NASA’s Terra satellite provided a visible image of Fung-Wong. The MODIS image showed strong thunderstorms around the low-level center of circulation. The Joint Typhoon Warning Center noted, “A microwave image that depicts tight shallow banding wrapping into a defined low level circulation center with deep convection (strong rising air that forms the clouds and storms that make up a tropical cyclone) sheared to the northeast due to strong southwesterly flow aloft.”

At 10 a.m. EST (1500 UTC) on Nov. 21, Tropical Storm Fung-Wong was located near latitude 21.1 degrees north and longitude 124.2 degrees east which is 379 nautical miles south-southwest of Kadena Air Base, Okinawa Island, Japan. Fung-Wong is moving to the north and had maximum sustained winds of 55 knots (63 mph/102 kph).

The Central Weather Bureau of Taiwan issued an “Extremely Heavy Rain Advisory” for the extreme northeastern part of the country. That includes Keelung North Coast, New Taipei City Mountain Area, and the Taipei City Mountain Area and Yilan County.

A Strong Wind Advisory was also issued for Keelung North Coast, New Taipei City, Taoyuan City, Hsinchu City, Hsinchu County, Miaoli County, Taichung City, Changhua County, Yunlin County, Chiayi County, Tainan City, Hengchun Peninsula, Yilan County, Hualien County, Taitung County, Lanyu and Ludao Islands, Penghu County, Kinmen Area, and the Matsu Area.

Fung-Wong is moving north and weakening rapidly.

NASA’s Terra satellite is one in a fleet of NASA satellites that provide data for hurricane research.

Typhoons and hurricanes are the most powerful weather event on Earth. NASA’s expertise in space and scientific exploration contributes to essential services provided to the American people by other federal agencies, such as hurricane weather forecasting.

For forecast updates from Taiwan’s Central Weather Bureau, visit: https://www.cwb.gov.tw/eng/

By Rob Gutro
NASA’s Goddard Space Flight Center

Sebastien – Atlantic Ocean

Nov. 21, 2019 – NASA Found Atlantic’s Sebastien Was Fighting Wind Shear

NASA’s Terra satellite captured a visible image of Tropical Storm Sebastien that showed wind shear had pushed the bulk of its clouds and showers to the southeast of the center.

Terra image of Sebastien
On Nov. 20, 2019, the MODIS instrument that flies aboard NASA’s Terra satellite provided a visible image of Tropical Storm Sebastien in the Atlantic Ocean. Puerto Rico can be seen to the left of the storm. Credit: NASA Worldview

In general, wind shear is a measure of how the speed and direction of winds change with altitude. Tropical cyclones are like rotating cylinders of winds. Each level needs to be stacked on top each other vertically in order for the storm to maintain strength or intensify. Wind shear occurs when winds at different levels of the atmosphere push against the rotating cylinder of winds, weakening the rotation by pushing it apart at different levels.

On Nov. 20, the Moderate Resolution Imaging Spectroradiometer or MODIS instrument that flies aboard NASA’s Terra satellite provided a visible image of Tropical Storm Sebastien. The MODIS image showed the center of circulation appeared to be surrounded by wispy clouds, and that northwesterly wind shear had pushed the bulk of Sebastien’s clouds and showers southeast of the center. In addition, the low-level center of circulation was exposed to outside winds.

On Nov. 21, the National Hurricane Center Sebastien said that the storm continues to produce a large area of deep convection over the eastern semicircle of the circulation, but the banding features are not very well defined.

On Nov. 21 at 10 a.m. EST (1500 UTC), the center of Tropical Storm Sebastien was located near latitude 23.5 degrees north and longitude 60.5 degrees west about 405 miles (650 km) north-northeast of the Northern Leeward Islands.

Sebastien is moving toward the north-northeast near 8 mph (13 kph).  A faster northeastward motion is expected during the next few days. The estimated minimum central pressure is 999 millibars.

Maximum sustained winds are near 60 mph (95 kph) with higher gusts. Sebastien is forecast to become a hurricane by tonight, but a weakening trend is expected to begin by late Friday. The system is likely to become an extratropical cyclone by Saturday when it is forecast to become embedded in a frontal zone.

NASA’s Terra satellite is one in a fleet of NASA satellites that provide data for hurricane research.

Hurricanes and typhoons are the most powerful weather event on Earth. NASA’s expertise in space and scientific exploration contributes to essential services provided to the American people by other federal agencies, such as hurricane weather forecasting.

By Rob Gutro
NASA’s Goddard Space Flight Center