Visible from NASA’s Aqua satellite revealed the effects of wind shear on Tropical Cyclone Riley in the Southern Indian Ocean.
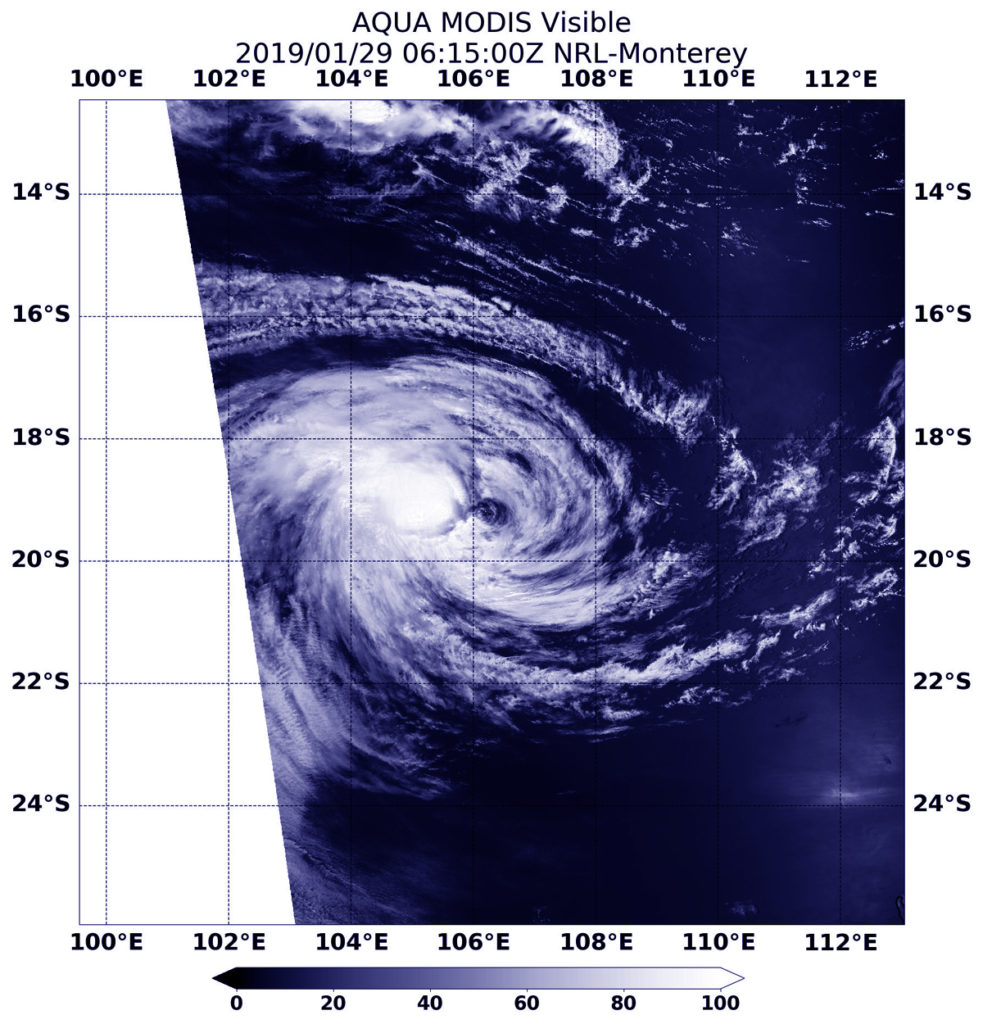
On Jan. 29, 2019, the MODIS instrument aboard NASA’s Aqua satellite looked at Tropical Cyclone Riley far to the west of Western Australia. Wind shear pushed the bulk of clouds and storms west of the center. Credit: NASA/NRL
On Jan. 29, 2019, the Moderate Resolution Imaging Spectroradiometer or MODIS instrument aboard NASA’s Aqua satellite captured a visible image of Tropical Cyclone Riley, located far to the west of Western Australia. Easterly wind shear pushed the bulk of clouds and storms west of the center.
At 4 a.m. EDT (0900 UTC) on Jan. 29, Riley was located near 19.4 degrees south latitude and 105.8 east longitude, approximately 475 nautical miles west-northwest of Learmonth, Australia. Rile was moving to the west-southwestward. Maximum sustained winds were near 35 knots (40 mph/65 kph).
Forecasters at the Joint Typhoon Warning Center expect Riley to maintain its west-southwestward track until it dissipates later in the day.
Jan. 28, 2019 – Satellite Sees Tropical Cyclone Riley Pushing Further from Australia
Tropical Cyclone Riley continued to move west in the Southern Indian Ocean, and move away from Western Australia. NASA-NOAA’s Suomi NPP satellite provided a visible image of the storm.
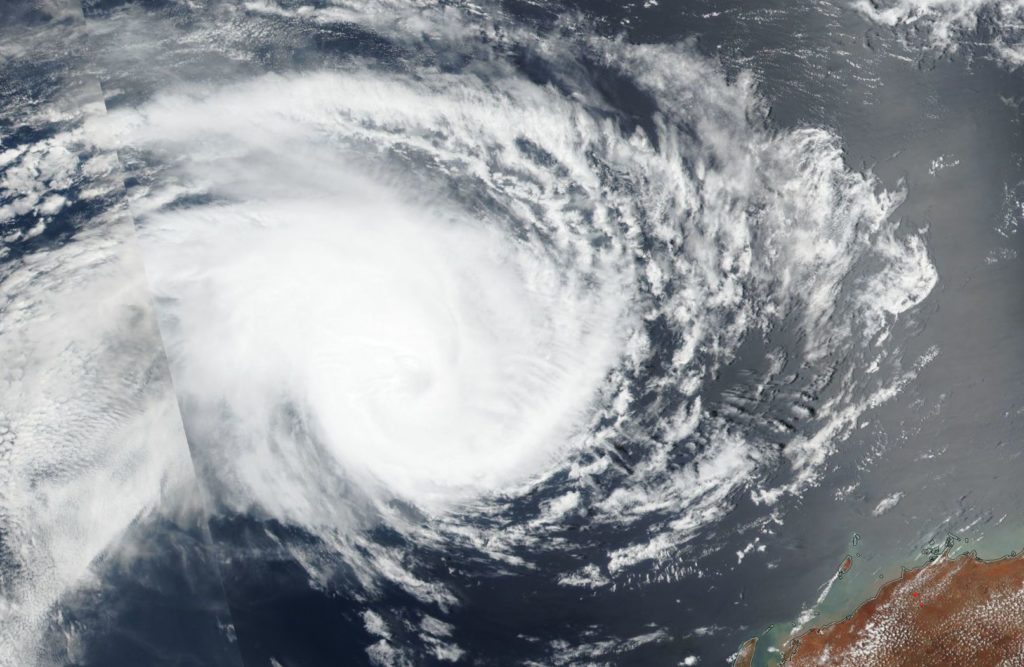
NASA-NOAA’s Suomi NPP satellite passed over the Southern Indian Ocean and captured a visible image of Tropical Cyclone Riley on Jan. 28, 2019. Credit: NASA Worldview, Earth Observing System Data and Information System (EOSDIS).
Suomi NPP passed over Riley on Jan. 28 and the Visible Infrared Imaging Radiometer Suite (VIIRS) instrument provided a visible image of the storm. The VIIRS image showed a rounded area of storms in the northwestern quadrant of the storm. The Joint Typhoon Warning Center (JTWC) noted “A microwave image indicated the bulk of the deep convection is confined to the northwest quadrant with tightly-curved shallow banding wrapping into a defined low-level circulation center.”
On January 28, the Australian Bureau of Meteorology noted that “Tropical Cyclone Riley lies over open waters well to the northwest of the west Pilbara coast. Riley is forecast to move towards the west southwest over the coming days, continuing on its path away from the Western Australia mainland.” At 10 a.m. EDT (1500 UTC), Riley was near 18.4 degrees south longitude and 108.9 east latitude, about 375 nautical miles northwest of Learmonth, Western Australia. Maximum sustained winds were near 60 knots
Forecasters at the Joint Typhoon Warning Center noted that Riley will track west-southwest and will continue to weaken. Riley is expected to dissipate within 3 days.
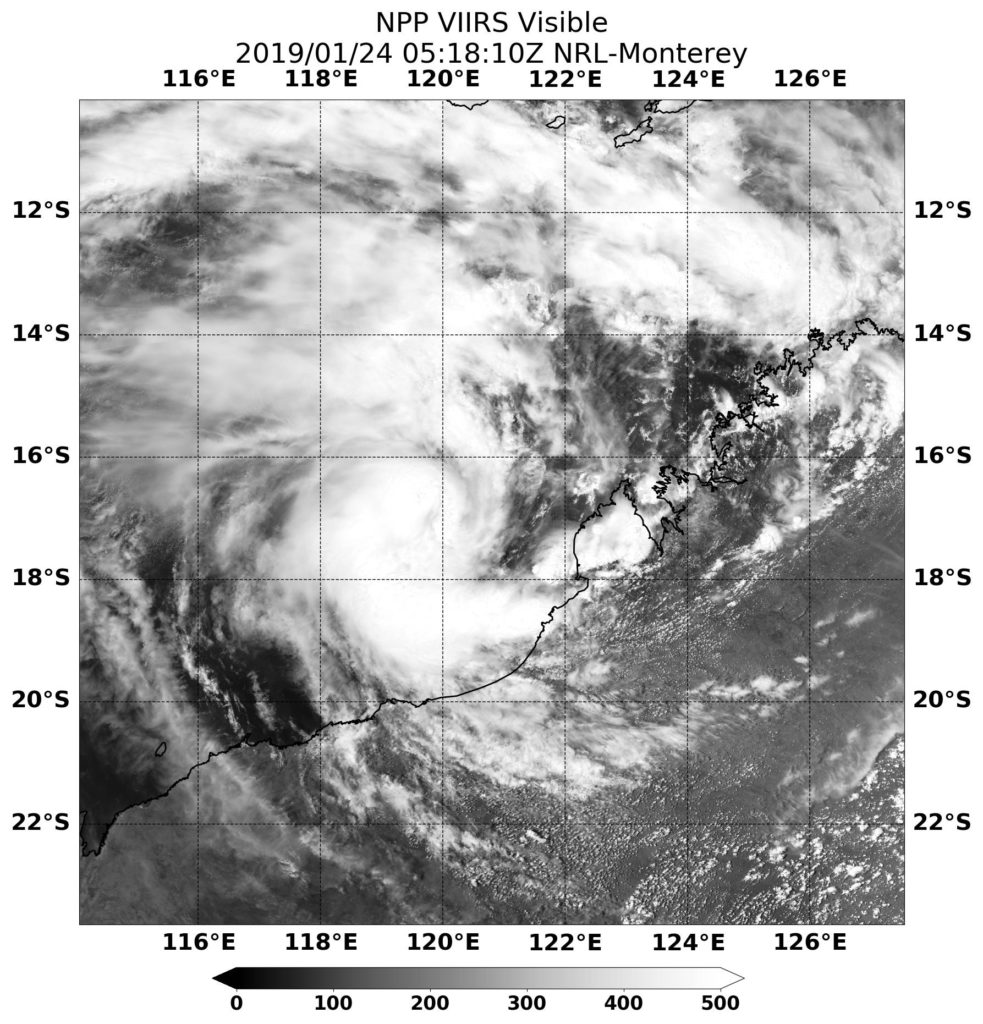
System 94S developed about 240 miles west-northwest of Darwin, Australia on Jan. 22, 2019. The next day, it had strengthened into a tropical cyclone, and was named Riley. NASA-NOAA’s Suomi NPP satellite provided a look at Riley when it was closest to Australia.
On Jan. 24, 2018, NASA-NOAA’s Suomi NPP satellite passed over Riley on Jan. 23 at 1:18 a.m. EST (0518 UTC). The VIIRS instrument aboard captured a visible image that showed the storm off the northwest coast of Western Australia. The storm had taken on the comma shape of a developed storm, and the southern quadrant of the storm was lashing the coast.
When it developed on Jan. 22, the low pressure area known as System 94S had sustained winds near 35 kilometers per hour. The Australian Bureau of Meteorology (ABM) posted a Cyclone Watch for the northwest Kimberley coast on that day.
On January 23, the ABM said Tropical Cyclone Riley continues tracking west, away from Kimberley coast. But the Tropical Cyclone Watch continued for the Pilbara coast. There was also a Blue Alert in effect for people between Whim Creek and Onslow including the towns of Roebourne, Wickham, Point Samson, Karratha, Dampier and Onslow.
On Jan 23, Riley had maximum sustained winds near 85 kph. It was centered near 17.0 degrees South and 119.5 degrees East, approximately 310 kilometers west northwest of Broome and it was moving west.
ABM said at the time “Tropical Cyclone Riley is expected to continue moving west southwest over open water, parallel to the Pilbara coast, throughout Friday and during the weekend. The cyclone may intensify to Category 2 overnight, and possibly to Category 3 on Friday to the north of the Pilbara coast. If the system takes a more southerly track then gales may develop along the Pilbara coast from Saturday morning.”
Jan. 20 – 21, 2019 – NASA Analyzes Water Vapor in Tropical Storm Desmond Near Mozambique
NASA’s Aqua satellite provided a look at the water vapor content within Tropical Storm Desmond as it was approaching landfall in Mozambique from the Mozambique Channel.
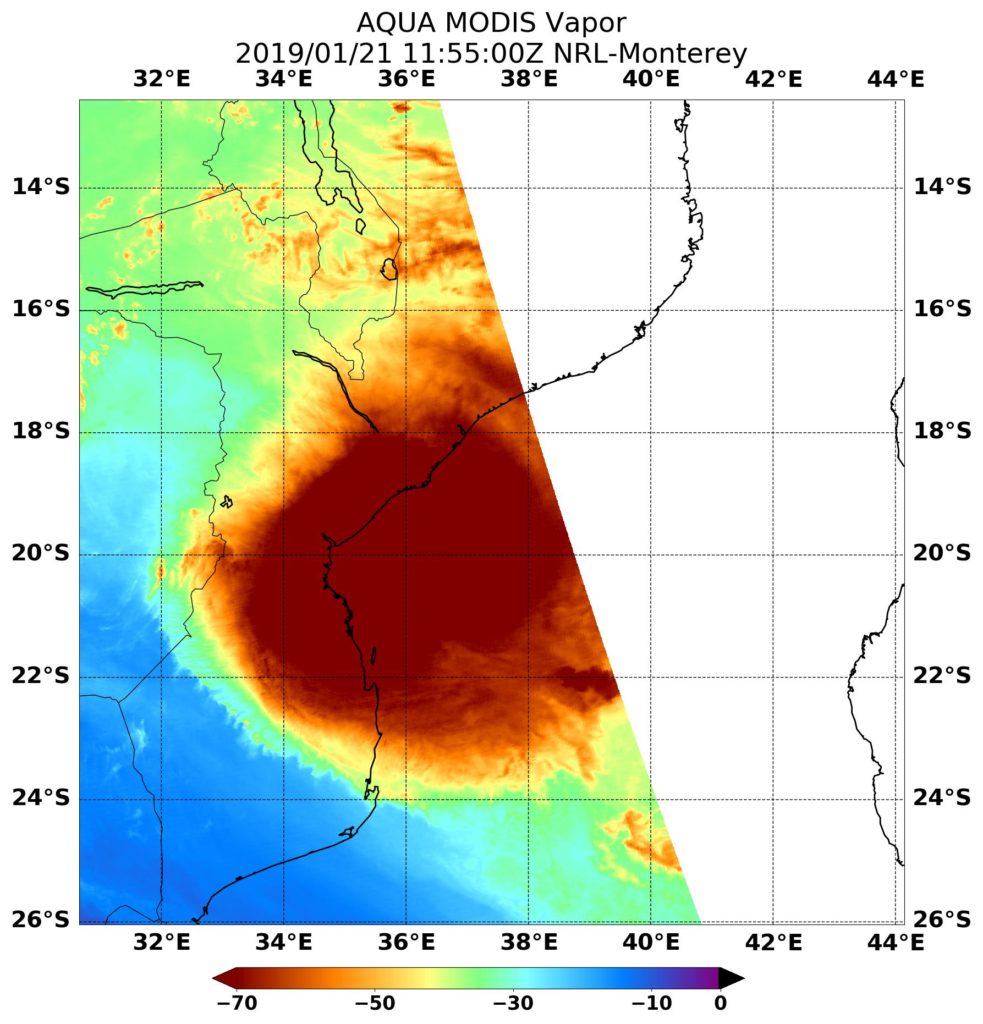
NASA’s Aqua satellite passed over Tropical Storm Desmond in the Southern Indian Ocean on Jan. 21 and highest concentrations of water vapor (brown) and coldest cloud top temperatures were around the center and storms were already affecting Mozambique. Credits: NASA/NRL
Tropical Cyclone Desmond formed in the Southern Indian Ocean on January 20, 2019 as Tropical Depression 10S. It strengthened into a tropical storm later that day.
On January 21 at 4 a.m. EST (0900 UTC) Tropical cyclone Desmond was located near 20.1 degrees south latitude and 38.1 degrees east longitude, about 172 miles northwest of Europa Island. It was moving to the north-northwest and had maximum sustained winds near 35 knots (40 mph/65 kph). Desmond is moving toward Mozambique.
On Jan. 21 at 6:55 a.m. EST (1155 UTC) the MODIS instrument aboard NASA’s Aqua satellite captured imagery of water vapor within Desmond. MODIS saw coldest cloud top temperatures were as cold as minus 70 degrees Fahrenheit (minus 56.6 degrees Celsius) in those areas. Storms with cloud top temperatures that cold have the capability to produce heavy rainfall.
Water vapor analysis of tropical cyclones tells forecasters how much potential a storm has to develop. Water vapor releases latent heat as it condenses into liquid. That liquid becomes clouds and thunderstorms that make up a tropical cyclone. Temperature is important when trying to understand how strong storms can be. The higher the cloud tops, the colder and the stronger they are.
The image showed that the western side of Desmond was already bringing rain and gusty winds over the coast of Mozambique as it moved toward a landfall.
Desmond moved northwest in the Mozambique Channel and made landfall in central Mozambique on Jan. 21 around 4 p.m. EDT (2100 UTC).
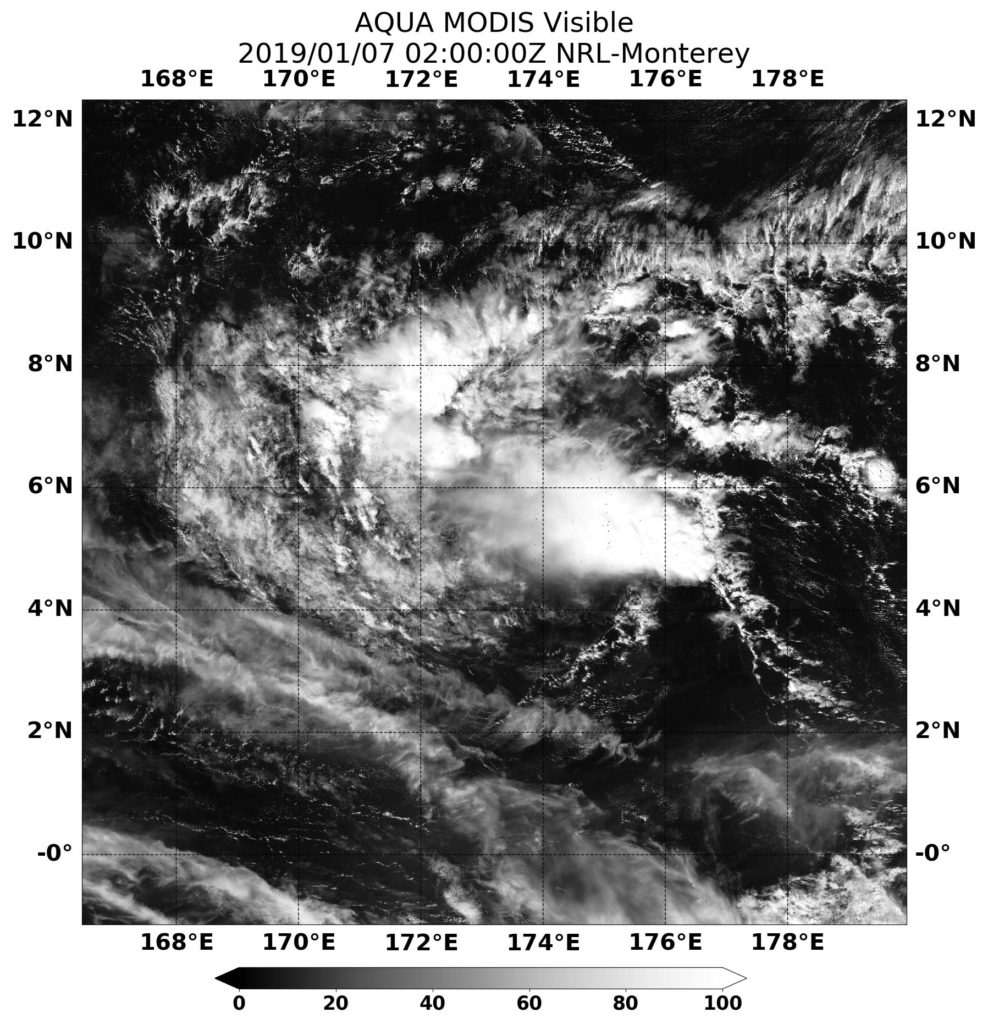
Satellite imagery showed that Tropical depression 01 fizzled on January 6 after triggering a tropical storm watch on Jan. 5 for Mili, Ailinglaplap, Majuro, Kwajalein and Jaluit.
On Jan. 7 at 0200 UTC (Jan. 6 at 9 p.m. EST), the MODIS instrument aboard NASA’s Aqua satellite captured a visible image of the dissipating storm. Credit: NASA/NRL
Tropical Depression 01W formed on Jan. 4 near 4.8 degrees north latitude and 174.0 east longitude, about 217 miles southeast of Majuro, Marshall Islands.
On Jan. 6 at 10 a.m. EST (1500 UTC) the Joint Typhoon Warning Center issued their final bulletin on 01W. At that time it was near 5.6 north latitude and 173.6 east longitude, about 169 miles east-southeast of Majuro. Maximum sustained winds dropped to 20 knots as it neared the Marshall Islands.
01W had weakened and no longer qualified as a tropical cyclone.
On Jan. 7 at 0200 UTC (Jan. 6 at 9 p.m. EST), the MODIS instrument aboard NASA’s Aqua satellite captured a visible image of the dissipating storm.
On January 8, the storm was reduced to a remnant low pressure area located 190 miles south of Majuro. 01W continued to linger in the Northwestern Pacific as a low pressure area, struggling to regenerate. A week later, on January 15, the low pressure area was still hanging around! The Joint Typhoon Warning Center still gave 01W a medium chance to regenerate. On that date, it was located about 160 miles south of Chuuk.
Five days later, 01W was still hanging around and was 305 nautical miles east-northeast of Manila, Philippines. It was close enough to the country that it was given the name Amang, and triggered warnings. At 4 a.m. EST (0900 UTC) warnings were posted for the remnants of tropical cyclone 01W.
Tropical cyclone warning signal #1 was in effect for the Visayas provinces of Northern and Eastern Samar, Samar, Biliran, Leyte. Signal #1 was also in effect for the Luzon provinces of Sorsogon and Masbate, including Ticao Island. On Jan. 22, the warnings had been dropped and the remnants from System 01W were near 12.0 degrees north latitude and 125.5 degrees east longitude, about 302 nautical miles east-southeast of Manila.
Jan. 01 – 05, 2019 – NASA Caught Tropical Storm Pabuk in the Gulf of Thailand
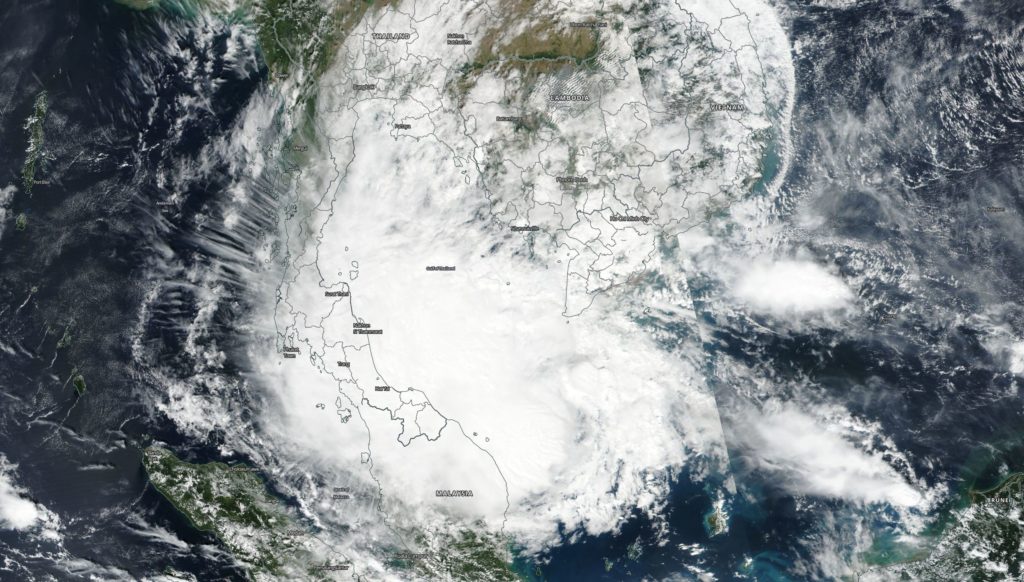
Tropical Storm Pabuk formed and faded in the Northwestern Pacific Ocean. Pabuk was captured by NASA-NOAA’s Suomi NPP Satellite when it was a tropical storm in the Gulf of Thailand.
NASA-NOAA’s Suomi NPP satellite captured a visible image of Tropical Storm Pabuk on Jan. 3, 2019 in the Gulf of Thailand. Credit: NASA Worldview, Earth Observing System Data and Information System (EOSDIS).
Tropical depression 36W formed 354 miles southeast Ho Chi Minh, Vietnam on Jan 1. By January 3 it strengthened into a tropical storm and was renamed “Tropical Storm Pabuk.”
NASA-NOAA’s Suomi NPP satellite captured a visible image of Tropical Storm Pabuk on Jan. 3, 2019 in the Gulf of Thailand. The image, taken from the VIIRS instrument showed the center of Pabuk’s circulation in the central Gulf as its western quadrant extended over the Malay Peninsula, while the eastern quadrant brought clouds over southwestern Cambodia.
On Jan. 3 at 4 a.m. EST (0900 UTC) Tropical Storm Pabuk was centered near 6.0 degrees north latitude and 104.8 degrees east longitude. It was about 287 miles south of Ho Chi Minh, Vietnam and moving to the west. Maximum sustained winds were 35 knots (40 mph/65 kph). At that time, Pabuk was forecast to move west, later northwest into the Gulf of Thailand, and will peak at 50 knots (57 mph/92 kph).
On Jan. 4, Pabuk was approaching landfall on the Malay Peninsula. The storm traversed the Malay Peninsula, and dissipated in the Bay of Bengal on Jan. 5.
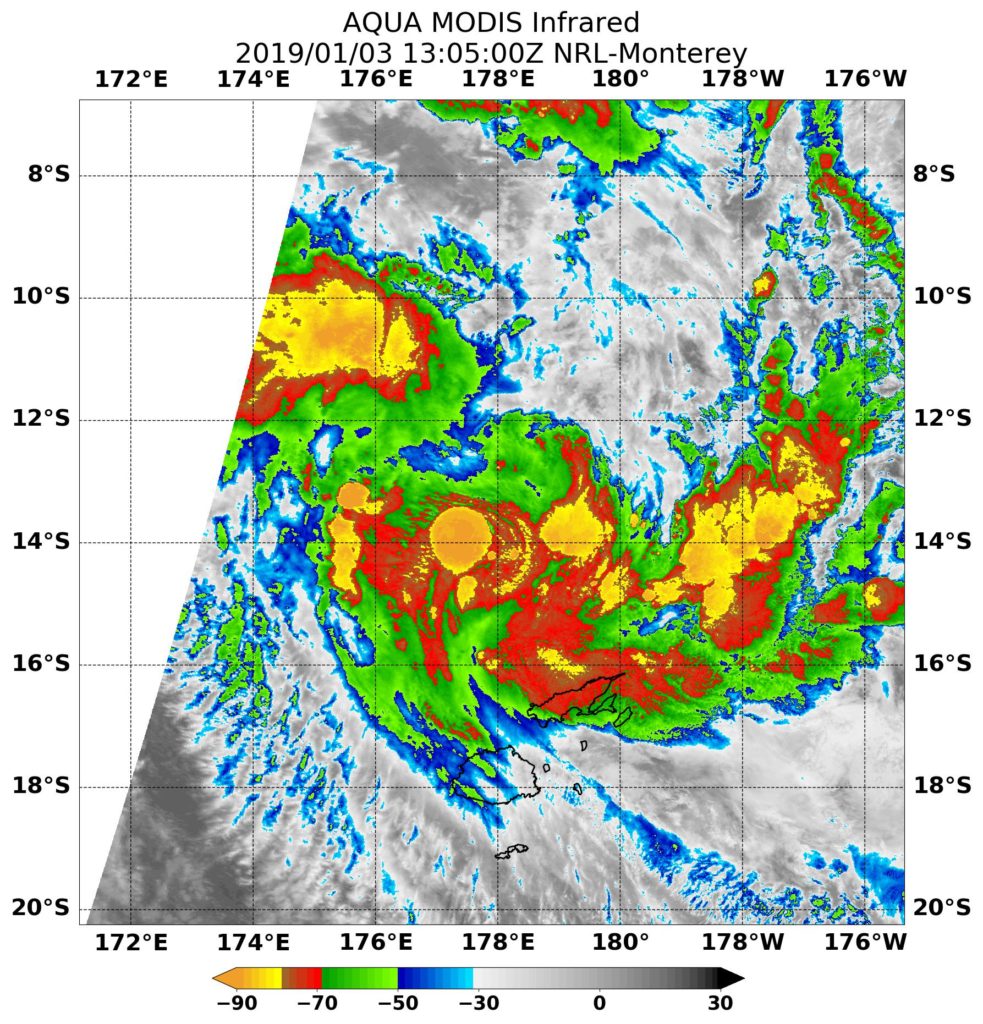
Jan. 03 – 07, 2019 – NASA Caught Tropical Cyclone Mona Near Fiji
Tropical Cyclone Mona formed north of Fiji and triggered warnings. NASA’s Aqua satellite captured an infrared image of the storm providing cloud top temperatures.
On Jan. 3, 2019 at 12 a.m. EST (0500 UTC) NASA’s Aqua satellite passed over the Southern Pacific Ocean and the MODIS instrument captured an infrared image of Tropical Cyclone Mona. MODIS found some very powerful thunderstorms with cloud tops as cold as minus 90 degrees Fahrenheit (green). Credit: NASA/NRL
On Jan. 3, 2019, Regional warnings went into effect. A tropical cyclone alert was in force for Vanua Levu, Taveuni, Lau and Lomaiviti group of islands.
On Jan. 3 at 4 a.m. EST (0900 UTC), Tropical cyclone Mona was located near 12.6 degrees south latitude and 178.2 degrees east longitude, about 330 miles north of Suva, Fiji. Mona was moving to the south and had maximum sustained winds near 35 knots (40 mph/65 kph). Mona is threatening Fiji.
On Jan. 3, 2019 at 12 a.m. EST (0500 UTC) NASA’s Aqua satellite passed over the Southern Pacific Ocean and the MODIS instrument captured an infrared image of Tropical Cyclone Mona. MODIS found some very powerful thunderstorms with cloud tops as cold as minus 90 degrees Fahrenheit.
On Jan. 4, Mona continued tracking toward Fiji and a tropical cyclone alert remained in place for the Yasawa group, Vanua Levu, Taveuni and the rest of Fiji.
On Jan. 7, a tropical cyclone alert was in force for Vatoa and Ono-I-Lau. Mona’s maximum sustained winds were near 40 knots. At that time, the Joint Typhoon Warning Center noted that Mona is veering round to the southwest, through the eastern parts of the Fijian archipelago. The system dissipated later that day.
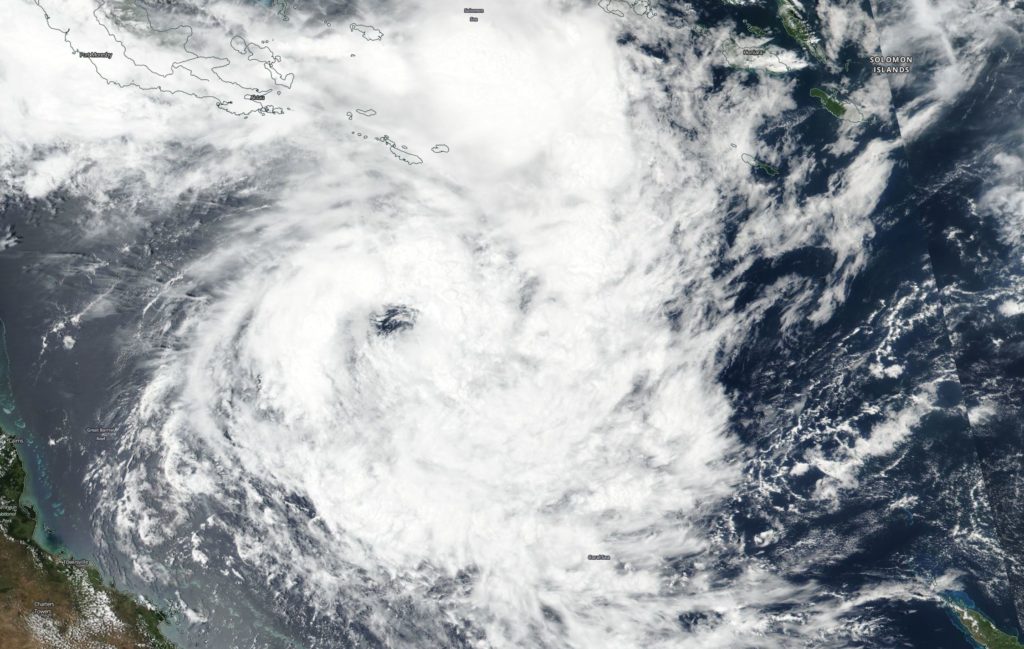
Late Dec. 2018 – Jan. 08, 2019 – Tropical Storm Penny Tracked Through Southwestern Pacific Ocean
Several satellites provided imagery on Tropical Storm Penny in the Southwestern Pacific Ocean. NASA-NOAA’s Suomi NPP satellite captured a visible image of the storm after it developed an eye.
On January 3, 2019 Suomi NPP captured an image of Tropical Cyclone Penny in the Southwestern Pacific Ocean. Penny had developed an eye. Credit: NASA Worldview, Earth Observing System Data and Information System (EOSDIS)
Tropical cyclone Penny / 08P formed in late December, 2018 and It strengthened into a tropical storm. By January 3, 2019 at 4 a.m. EST (0900 UTC) Penny had strengthened to 40 knots. It was located near 15.0 degrees south latitude and 153.7 degrees east longitude, about 470 miles east-northeast of Cairns, Australia. Penny was moving to the east-southeast.
On January 3, 2019 Suomi NPP captured an image of Tropical Cyclone Penny in the Southwestern Pacific Ocean. Penny had developed an eye as it was moving across the Coral Sea.
The next day at 4 a.m. EST (0900 UTC) Penny’s maximum sustained winds increased to 50 knots. By January 7, at 10 a.m. EST (1500 UTC) Penny was 347 miles east-southeast of Cairns, Australia and winds had decreased to 50 knots. Penny was moving west across the Coral Sea and on January 8, the Joint Typhoon Warning Center issued the final warning on the system as it was dissipating.
Dec. 26 – 29, 2018 – NASA Finds Soaking Storms in 35W that Affected the Philippines
Tropical Depression 35W brought heavy rainfall and flooding to the Bicol and Eastern Visayas regions of the Philippines in late December 2018. Infrared imagery from NASA’s Aqua satellite found very cold cloud top temperatures in 35W, indicating powerful rain-making storms.
On Dec. 26, 2018 at 12:10 p.m. EST (1710 UTC) NASA’s Aqua satellite passed over the Northwestern Pacific Ocean and the MODIS instrument captured an infrared image of Tropical Depression 36W. MODIS found some very powerful thunderstorms with cloud tops as cold as minus 90 degrees Fahrenheit (green). Credit: NASA/NRL
Locally in the Philippines, Tropical Depression 35W was known as Usman. On Dec. 26, Tropical Depression 35W had triggered warnings in the Philippines. Tropical cyclone warning signal #1 was in force in Eastern Samar in the Visayas region. At 10 a.m. EST (1500 UTC) 35W was located near 10.0 degrees north latitude and 130.6 degrees east longitude, about 627 miles east-southeast of Manila, Philippines. 35W was moving to the west and at that time had maximum sustained winds near 25 knots (28.7 mph/46.3 kph).
On Dec. 26, 2018 at 12:10 p.m. EST (1710 UTC) NASA’s Aqua satellite passed over the Northwestern Pacific Ocean and the MODIS instrument captured an infrared image of Tropical Depression 35W. MODIS found some very powerful thunderstorms with cloud tops as cold as minus 90 degrees Fahrenheit (minus 67.7 degrees Celsius). NASA research has shown that cloud tops with temperatures that cold can generate very heavy rainfall.
On Dec. 27 at 4 a.m. EST (0900 UTC), Tropical Depression 35W was about 579 nautical miles east-southwest of Manila, Philippines. It was centered near 10.4 degrees north latitude and 129.9 degrees east longitude. 35W was moving west-northwest and maintained maximum sustained winds near 25 knots (28.7 mph/46.3 kph).
Philippines warnings were expanded on Dec. 27 to include: Tropical cyclone warning signal # in the Luzon provinces of Romblon, Catanduanes, Camarines Sur, Albay, Sorsogon, Masbate and Ticao Island; in the Visayas provinces of Eastern and Northern Samar as well as Samar, Biliran, Leyte, Southern Leyte and northern Cebu including Camotes Islands, Aklan, Capiz, northern Iloilo and northern Negros Occidental; and in the Mindanao province of Dinagat Island
35W moved west and made landfall on Dec. 29. It crossed the central Philippines where it dropped heavy rainfall, and created flooding and landslides. 61 people were reported killed from the flooding on Dec. 31. Tropical Depression 35W moved into the South China Sea where it dissipated.