Mar. 20, 2020 – NASA Finds Herold a Fading Ex-Tropical Cyclone
Former Tropical Cyclone Herold is now a fading area of low-pressure in the Southern Indian Ocean and NASA’s Aqua satellite provided forecasters with a visible image.
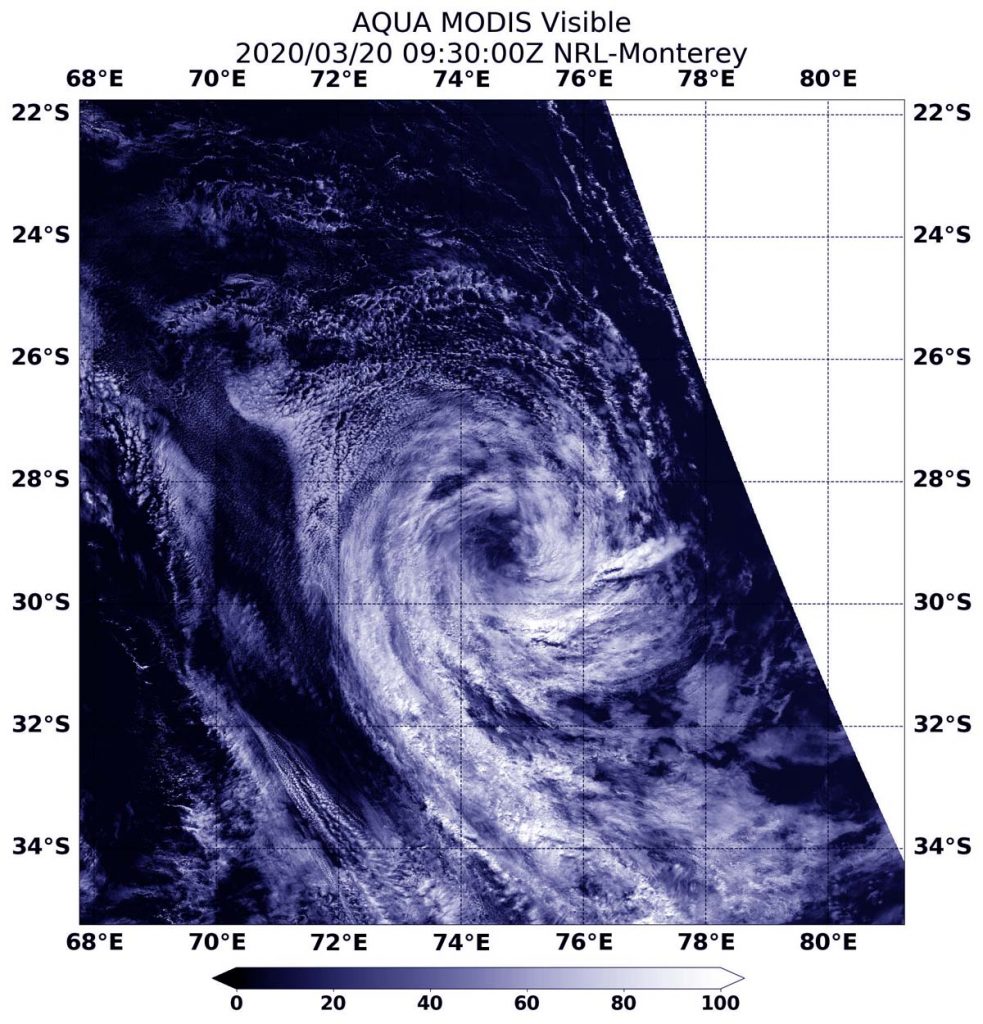
On Mar. 20, 2020, the MODIS instrument that flies aboard NASA’s Aqua satellite provided a visible image ex-tropical cyclone Herold in the Southern Indian Ocean. Credit: NASA Worldview
On Mar. 19 at 4 p.m. EDT (2100 UTC), the Joint Typhoon Warning Center issued their final bulletin on Herold. At that time, Herold’s center was located near latitude 26.6 degrees south and longitude 73.0 degrees east, approximately 948 nautical miles east-southeast of Port Louis, Mauritius. Herold’s maximum sustained winds at the time were near 30 knots (34.5 mph/55.5 kph) making it a tropical depression. It has since weakened.
On Mar. 20, the Moderate Resolution Imaging Spectroradiometer or MODIS instrument that flies aboard NASA’s Aqua satellite provided a visible image of the clouds circling Herold’s center. The clouds appeared wispy and devoid of heavy rainfall. The storm showed no strong convection (rising air that forms the thunderstorms that make up a tropical cyclone). Herold has moved over cooler waters which have sapped thunderstorm development.
Herold is expected to dissipate later in the day on Mar. 20.
NASA’s Aqua satellite is one in a fleet of NASA satellites that provide data for hurricane research.
Tropical cyclones/hurricanes are the most powerful weather events on Earth. NASA’s expertise in space and scientific exploration contributes to essential services provided to the American people by other federal agencies, such as hurricane weather forecasting.
Mar. 19, 2020 – NASA Finds Little Strength Left in Tropical Cyclone Herold
Wind shear pushed former Tropical Cyclone Herold apart and infrared imagery from NASA’s Aqua satellite showed the system with very little strength remaining.
On March 19, 2020, the MODIS instrument that flies aboard NASA’s Aqua satellite gathered infrared data on Herold. MODIS showed minimal associated strong convection (rising air that forms the thunderstorms that make up tropical cyclones). Strongest thunderstorms had cloud top temperatures (blue) as cold as minus 50 degrees Fahrenheit (minus 45.5 Celsius). Credit: NASA/NRL
NASA’s Aqua satellite uses infrared light to analyze the strength of storms by providing temperature information about the system’s clouds. The strongest thunderstorms that reach high into the atmosphere have the coldest cloud top temperatures.
On March 19, 2020, the Moderate Resolution Imaging Spectroradiometer or MODIS instrument that flies aboard NASA’s Aqua satellite gathered infrared data on Herold. Animated multispectral satellite imagery showed Herold’s low-level circulation center is partially exposed and there is minimal associated strong convection (rising air that forms the thunderstorms that make up tropical cyclones). Strongest thunderstorms had cloud top temperatures as cold as minus 50 degrees Fahrenheit (minus 45.5 Celsius).
At 5 a.m. EDT (0900 UTC), the center of Tropical Storm Herold was located near latitude 25.4 degrees south and longitude 71.1 degrees east, about 827 nautical miles east-southeast of Port Louis, Mauritius. Maximum sustained winds were near 46 mph (40 knots/74 kph).
Vertical wind shear, that is winds outside of a tropical cyclone at different heights in the atmosphere (the troposphere), push against a tropical cyclone and tear it apart. Herold is in an area of high wind shear blowing between 25 to 30 knots (29 to 35 mph/46 to 56 kph)
The Joint Typhoon Warning Center (JTWC) forecast notes that Herold will continue moving southeast and weaken rapidly because it is moving into an area of increased vertical wind shear speeds and cooler sea surface temperatures. The storm will dissipate within 24 hours.
Tropical cyclones/hurricanes are the most powerful weather events on Earth. NASA’s expertise in space and scientific exploration contributes to essential services provided to the American people by other federal agencies, such as hurricane weather forecasting.
Mar. 18, 2020 – NASA Analyzes Tropical Cyclone Herold’s Water Vapor Concentration
When NASA’s Aqua satellite passed over the Southern Indian Ocean on Mar. 18, it gathered water vapor data that showed wind shear was adversely affecting Tropical Cyclone Herold.
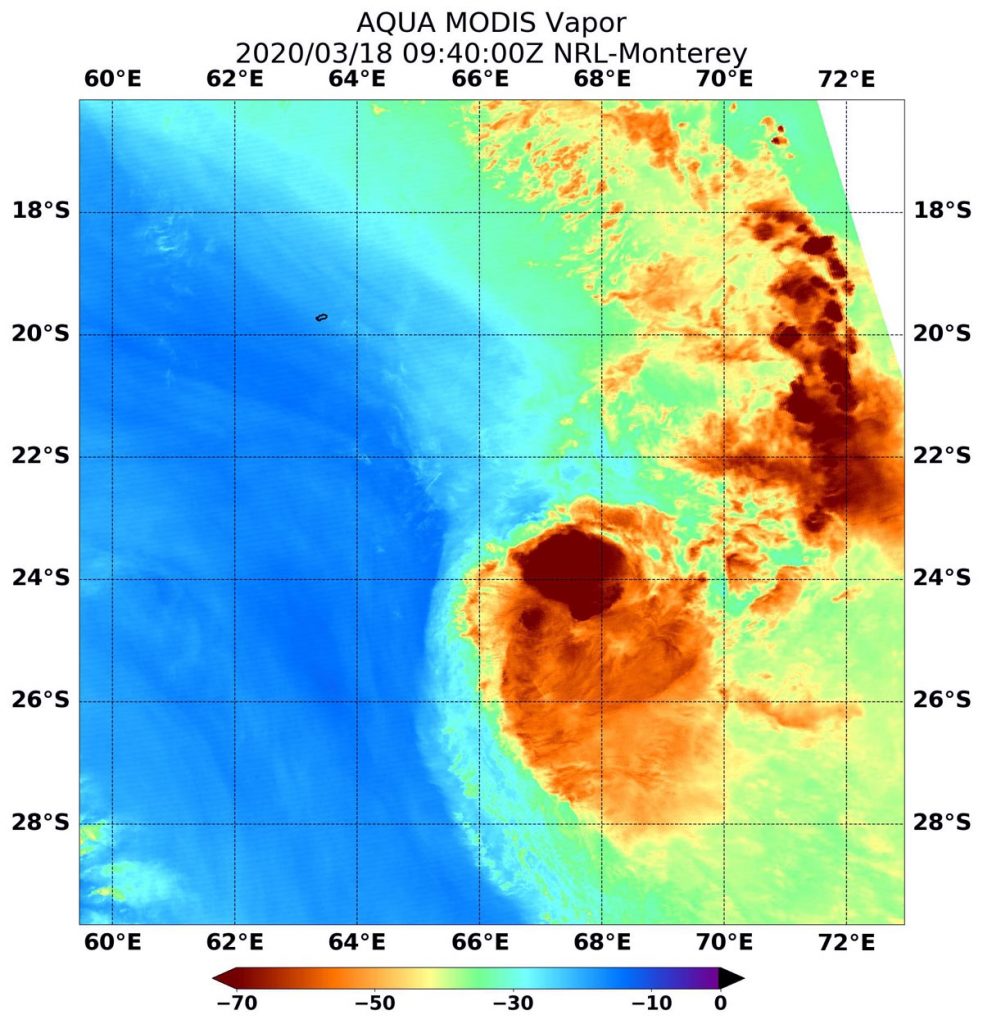
On Mar. 18 at 5:40 a.m. EDT (0940 UTC), NASA’s Aqua satellite passed over Tropical Cyclone Herold, located in the Southern Indian Ocean. Aqua found highest concentrations of water vapor (brown) and coldest cloud top temperatures were south of the center. Credits: NASA/NRL
In general, wind shear is a measure of how the speed and direction of winds change with altitude. Tropical cyclones are like rotating cylinders of winds. Each level needs to be stacked on top each other vertically in order for the storm to maintain strength or intensify. Wind shear occurs when winds at different levels of the atmosphere push against the rotating cylinder of winds, weakening the rotation by pushing it apart at different levels. Strong wind shear from the northwest is battering Herold and pushing the strongest storms away from the center of circulation. Northwesterly winds affecting the storm are estimated between 25 and 30 knots (29 to 35 mph /46 to 56 kph)
What Water Vapor Reveals
NASA’s Aqua satellite passed over Tropical Cyclone Herold on Mar. 18 at 5:40 a.m. EDT (0940 UTC) and the Moderate Resolution Imaging Spectroradiometer or MODIS instrument gathered water vapor content and temperature information. The MODIS data showed highest concentrations of water vapor and coldest cloud top temperatures were pushed about 48 nautical miles southeast of the center of circulation.
MODIS data showed coldest cloud top temperatures were as cold as or colder than minus 70 degrees Fahrenheit (minus 56.6 degrees Celsius) in those storms. Storms with cloud top temperatures that cold have the capability to produce heavy rainfall.
Water vapor analysis of tropical cyclones tells forecasters how much potential a storm has to develop. Water vapor releases latent heat as it condenses into liquid. That liquid becomes the clouds and thunderstorms that make up a tropical cyclone. Temperature is important when trying to understand how strong storms can be. The higher the cloud tops, the colder and the stronger the storms.
Herold’s Status
On Wednesday, March 18, 2020 at 5 a.m. EDT (0900 UTC), the Joint Typhoon Warning Center or JTWC noted that Herold’s maximum sustained winds had dropped significantly since the previous 24 hours and the storm weakened from hurricane-force to tropical storm force. Maximum sustained winds were near 55 knots. Herold was centered near latitude 22.7 degrees south and longitude 66.1 degrees east, about 516 nautical miles east-southeast of Port Louis, Mauritius. Herold was moving to the southeast.
JTWC forecasters expect Herold to continue moving southeast and further away from land areas while continuing to weaken. Forecasters noted that the storm is becoming subtropical but could dissipate within a day or two before it completes that transition.
What is a Sub-tropical Storm?
According to the National Oceanic and Atmospheric Administration, a sub-tropical storm is a low-pressure system that is not associated with a frontal system and has characteristics of both tropical and extratropical cyclones. Like tropical cyclones, they are non-frontal that originate over tropical or subtropical waters, and have a closed surface wind circulation about a well-defined center.
Unlike tropical cyclones, subtropical cyclones derive a significant proportion of their energy from baroclinic sources (atmospheric pressure), and are generally cold-core in the upper troposphere, often being associated with an upper-level low-pressure area or an elongated area or trough of low pressure.
NASA’s Aqua satellite is one in a fleet of NASA satellites that provide data for hurricane research.
Tropical cyclones/hurricanes are the most powerful weather events on Earth. NASA’s expertise in space and scientific exploration contributes to essential services provided to the American people by other federal agencies, such as hurricane weather forecasting.
Mar. 17, 2020 – Tropical Cyclone Herold’s Eye Opens Further on NASA Satellite Imagery
As Tropical Cyclone Herold intensified, its eye appeared more defined in imagery taken by NASA’s Terra satellite.
On March 17, the MODIS instrument that flies aboard NASA’s Terra satellite took this image of Tropical Cyclone Herold and showed a well-developed hurricane which is maintaining a clearer eye. Credit: NASA Worldview
A Tropical Cyclone Warning class 3 was in force for Rodrigues Island on March 17. Rodrigues is an autonomous outer island of the Republic of Mauritius in the Southern Indian Ocean. It is about 42 square miles (108 square kilometers). Rodrigues Island is located about 350 miles (560 kilometers) east of Mauritius.
On March 17 at 5 a.m. EDT (0900 UTC), forecasters at the Joint Typhoon Warning Center (JTWC) noted “Infrared satellite imagery indicates a sharp intensification trend over the past 12 hours as the system formed an irregular 13-nautical mile wide eye.”
The Moderate Resolution Imaging Spectroradiometer or MODIS instrument that flies aboard NASA’s Terra satellite confirmed that intensification. MODIS provided forecasters with a visible image of Tropical Cyclone Herold that revealed a much clearer eye than on March 16. The eye was no longer obscured by high clouds, and the Terra view was able to see down to the ocean’s surface through the eye. Powerful bands of thunderstorms circled the eye.
At 5 a.m. EDT (0900 UTC) on March 17, the center of Tropical Cyclone Herold was located near latitude 19.1 degrees south and longitude 60.4 degrees east, about 185 nautical miles east-southeast of Port Louis, Mauritius. Maximum sustained winds had increased to 100 knots (115 mph/185 kph).
The JTWC noted that Herold is moving southeast and is at peak intensity, while it is passing just west of Rodrigues. The storm is now expected to begin weakening before it becomes subtropical.
Tropical cyclones/hurricanes are the most powerful weather events on Earth. NASA’s expertise in space and scientific exploration contributes to essential services provided to the American people by other federal agencies, such as hurricane weather forecasting.
Mar. 17, 2020 – NASA Finds Ex-Tropical Cyclone Gretel’s Center North of New Zealand
NASA’s Terra Satellite passed over the Southern Pacific Ocean and provided forecasters with a visible image of ex-Tropical Cyclone Gretel although north of New Zealand, it was still large enough to continue causing warnings.
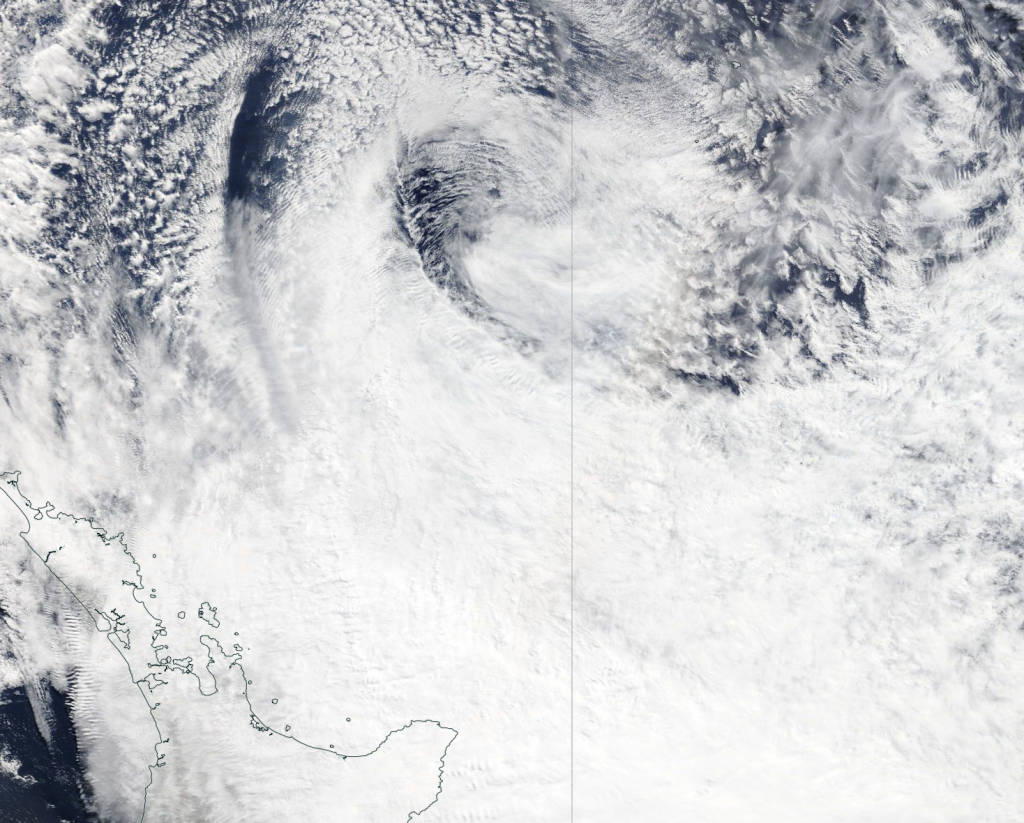
NASA’s Terra satellite found ex-tropical cyclone Gretel’s center north of New Zealand. The storm was still large enough to trigger warnings. Credit: NASA Worldview, Earth Observing System Data and Information System (EOSDIS)
On March 17 at 6:51 a.m. New Zealand local time (March 16 at 6:51 p.m. EDT/2251 UTC), the Meteorological Service of New Zealand (MSNZ) reported that the convection associated with ex-Tropical Cyclone Gretel dissipated early this morning (local time), over the relatively cool seas to the northeast of New Zealand. As a result, Gretel is no longer a tropical cyclone and has been reclassified as an extra-tropical low-pressure system.
Ex-Tropical Cyclone Gretel’s center was located near latitude 31.2 degrees south and longitude 178.4 east, about 550 kilometers (342 miles) northeast of Northland, moving southeast. The Northland region of New Zealand extends from Auckland to the very top of New Zealand.
MSNZ noted that “Severe gales possible for eastern Bay of Plenty and parts of Gisborne. A deep low (ex-Tropical Cyclone Gretel) lying to the northeast of the North Island Tuesday afternoon is forecast to continue moving east-southeast Tuesday night. This system continues to bring southerly gales to parts of eastern Bay of Plenty and Gisborne, possibly approaching severe gale strength at times until early Wednesday morning.”
Early on March 17, the Moderate Resolution Imaging Spectroradiometer or MODIS instrument aboard Terra provided a visible image of ex-Tropical Cyclone Gretel that showed the center devoid of thunderstorms and precipitation. In the MODIS image, the layers of clouds around the low-level center appear like a wall of threaded clouds. The largest area of clouds associated with the system were in the southern quadrant and extended over northern New Zealand.
Gretel is expected to move southeast over waters to the north and east of New Zealand over the next few days, while remaining a deep extra-tropical low-pressure area.
Tropical cyclones/hurricanes are the most powerful weather events on Earth. NASA’s expertise in space and scientific exploration contributes to essential services provided to the American people by other federal agencies, such as hurricane weather forecasting.
Mar. 16, 2020 – NASA Finds Gretel Becoming Extra-Tropical
NASA’s Terra satellite passed over the Southern Pacific Ocean and captured an image of Tropical Storm Gretel as it was transitioning into an extra-tropical cyclone, northwest of New Zealand.
On March 16, the MODIS instrument that flies aboard NASA’s Terra satellite took this image of Tropical Cyclone Gretel and showed a transitioning storm northwest of New Zealand. Credit: NASA Worldview
Tropical Cyclone 23P formed on March 14 at 4 p.m. EDT (2100 UTC) between Australia and New Caledonia. Once it intensified into a tropical storm, it was renamed Gretel.
On March 16, the Moderate Resolution Imaging Spectroradiometer or MODIS instrument that flies aboard NASA’s Terra satellite provided forecasters with a visible image of Tropical Cyclone Gretel. The bulk of Gretel’s clouds and storms were south and southeast of the center of circulation. Clouds associated with Gretel extended to northern New Zealand, despite the storm’s center being hundreds of miles away.
At 11 p.m. EDT on March 15 (0300 UTC on March 16), the Joint Typhoon Warning Center or JTWC issued the final warning on Gretel. At that time, the center of Tropical Cyclone Gretel was located near latitude 26.6 degrees south and longitude 169.7 degrees east, about 675 nautical miles north-northwest of Auckland, New Zealand. Maximum sustained winds were near 50 knots (58 mph/93 kph) and Gretel was speeding southeast at 25 knots (29 mph/46 kph).
The Joint Typhoon Warning Center or JTWC noted that Gretel will continue to move southeast and is now becoming extra-tropical.
Often, a tropical cyclone will transform into an extra-tropical cyclone as it recurves toward the poles (north or south, depending on the hemisphere the storm is located in). An extra-tropical cyclone is a storm system that primarily gets its energy from the horizontal temperature contrasts that exist in the atmosphere.
Tropical cyclones have their strongest winds near the earth’s surface, while extra-tropical cyclones have their strongest winds near the tropopause – about 8 miles (12 km) up. Tropical cyclones, in contrast, typically have little to no temperature differences across the storm at the surface and their winds are derived from the release of energy due to cloud/rain formation from the warm moist air of the tropics.
Tropical cyclones/hurricanes are the most powerful weather events on Earth. NASA’s expertise in space and scientific exploration contributes to essential services provided to the American people by other federal agencies, such as hurricane weather forecasting.
Mar. 16, 2020 – NASA Sees Tropical Cyclone Herold’s Eye
NASA’s Aqua satellite passed over the Southern Indian Ocean and captured an image of a well-developed Tropical Cyclone Herold at hurricane strength, east of Madagascar.
On March 16, the MODIS instrument that flies aboard NASA’s Aqua satellite took this image of Tropical Cyclone Herold and showed a well-developed hurricane with a visible eye. Credit: NASA Worldview
Herold formed on March 13 as Tropical Cyclone 22S and once it intensified into a tropical storm, it was renamed Herold. Herold continued to strengthen and is now at hurricane-force.
On March 16, the Moderate Resolution Imaging Spectroradiometer or MODIS instrument that flies aboard NASA’s Aqua satellite provided forecasters with a visible image of Tropical Cyclone Herold and showed a well-developed hurricane with a visible eye, although slightly obscured by high clouds. Powerful bands of thunderstorms circled the eye.
At 5 a.m. EDT (0900 UTC) on March 16, the center of Tropical Cyclone Herold was located near latitude 15.7 degrees south and longitude 54.2 degrees east, about 295 nautical miles north-northwest of St. Denis, La Reunion Island. Maximum sustained winds were near 80 knots (92 mph/148 kph).
The Joint Typhoon Warning Center or JTWC noted that Herold is forecast to turn to the southeast, passing just west of Rodrigues. The storm will strengthen to 90 knots (104 mph/167 kph) later today before becoming subtropical.
Tropical cyclones/hurricanes are the most powerful weather events on Earth. NASA’s expertise in space and scientific exploration contributes to essential services provided to the American people by other federal agencies, such as hurricane weather forecasting.
Mar. 13, 2020 – NASA’s Terra Satellite Observes Development of Tropical Storm 22S
NASA’s Terra satellite passed over the Southern Indian Ocean and provided forecasters with a visible image of newly formed Tropical Storm 22S, located near northeastern Madagascar.
NASA’s Terra satellite captured the formation of Tropical Storm 22S near northeastern Madagascar on March 13, 2020. Credit: NASA Worldview, Earth Observing System Data and Information System (EOSDIS)
The Moderate Resolution Imaging Spectroradiometer or MODIS instrument aboard Terra provided a visible image of Tropical Cyclone 22S that revealed strong thunderstorms had circled the center of circulation and western quadrant. A banding of thunderstorms on the western side were bringing rainfall and gusty winds to northeastern Madagascar. Satellite imagery also shows the storm consolidating.
At 0900 UTC, (5 a.m. EDT) Tropical Cyclone 22S was located near latitude 14.3 degrees south and longitude 52.4 degrees east, about 447 nautical miles north-northwest of Port Louis, Mauritius. 22S was moving to the west-southwest and had maximum sustained winds near 35 knots (40 mph/65 kph).
The Joint Typhoon Warning Center (JTWC) expects 22S to curve to the southeast and pass between Mauritius and Rodrigues. The storm will strengthen to 90 knots (104 mph/167 kph) before becoming subtropical.
Tropical cyclones/hurricanes are the most powerful weather events on Earth. NASA’s expertise in space and scientific exploration contributes to essential services provided to the American people by other federal agencies, such as hurricane weather forecasting.
Mar. 12, 2020 – NASA Finds Ex-Tropical Cyclone 21S Affecting Australia’s Pilbara Coast
NASA’s Terra satellite passed over the Southern Indian Ocean and provided forecasters with a visible image of Ex-Tropical Cyclone 21S. Although no longer a tropical cyclone, the system has triggered warnings for heavy rainfall and winds.
On Mar. 12, 2020, the MODIS instrument that flies aboard NASA’s Terra satellite provided a visible image of Ex-Tropical Cyclone 21S, affecting Western Australia’s Pilbara coast. Credit: NASA Worldview
Tropical cyclone 21S was along the Pilbara coast. The Pilbara Coast is also known as the northwest coast of Western Australia.
The final warning from the Joint Typhoon Warning Center (JTWC) on 21S as a tropical system came on Mar. 11 at 5 p.m. EDT (2100 UTC). At the time, it had maximum sustained winds near 35 knots (64 kph/40 mph) and was moving to the southwest and toward the coast of Western Australia.
On March 12, the Moderate Resolution Imaging Spectroradiometer or MODIS instrument that flies aboard NASA’s Terra satellite provided a visible image of 21S that showed the storm affecting the states of Gascoyne and Pilbara. The image showed the low-level circulation center still offshore and the bulk of clouds and precipitation over Western Australia.
The Australian Bureau of Meteorology (ABM) issued warnings. ABM said, “Severe Weather events are forecast to affect Exmouth, Onslow, Barrow Island and Coral Bay. Along the northwest Pilbara coast between Mardie and Coral Bay, sustained gales are possible from late this evening until Friday morning. The weather system may also cause damaging wind gusts to 100 kilometers per hour that could result in damage to homes and property in or near thunderstorms. Heavy rainfall that may lead to flash flooding is possible with isolated falls of 50 to 100mm [`2 to 4 inches].”
At 4:00 p.m. AWST (4 a.m. EST) on Mar. 12, the ABM said ex-tropical cyclone 21S was located about 150 km (93 miles) north of Onslow, moving south southwest. ABM forecasters indicated the low-pressure area is expected to reach the coast later on Thursday or early Friday and may travel parallel to the Gascoyne coast. The tropical low-pressure area is not expected to intensify into a tropical cyclone but is likely to cause a period of heavy rainfall and squally winds.
NASA’s Terra satellite is one in a fleet of NASA satellites that provide data for hurricane research.
Tropical cyclones/hurricanes are the most powerful weather events on Earth. NASA’s expertise in space and scientific exploration contributes to essential services provided to the American people by other federal agencies, such as hurricane weather forecasting.
Mar. 11, 2020 – NASA-NOAA Satellite Catches Development of Tropical Storm 21S
NASA-NOAA’s Suomi NPP satellite passed over the Southern Indian Ocean and provided forecasters with a visible image of newly formed Tropical Storm 21S.
NASA-NOAA’s Suomi NPP satellite passed over the Southern Indian Ocean and captured a visible image of newly formed Tropical Storm 21S off the coast of Western Australia. Credit: NASA Worldview, Earth Observing System Data and Information System (EOSDIS)
The Visible Infrared Imaging Radiometer Suite (VIIRS) instrument aboard Suomi NPP provided a visible image of Tropical Cyclone 21S that revealed strong thunderstorms circling the center of circulation. Strong storms were also in the southeastern quadrant of the storm which extended to the coast of Western Australia.
At 0900 UTC, (5 a.m. EDT) Tropical Cyclone 21S was located near latitude 16.4 degrees south and longitude 116.9 degrees east, about 253 nautical miles north-northwest of Port Hedland, Australia. 21S was moving to the south and had maximum sustained winds near 35 knots (40 mph/65 kph). The storm is not expected to strengthen much before it makes landfall in Western Australia.
The Joint Typhoon Warning Center (JTWC) expects 21S to move south-southeast and pass over Exmouth as a tropical storm. Exmouth is a town located on the tip of the North West Cape in Western Australia. JTWC forecasters expect that 21S will dissipate after two days.
Tropical cyclones/hurricanes are the most powerful weather events on Earth. NASA’s expertise in space and scientific exploration contributes to essential services provided to the American people by other federal agencies, such as hurricane weather forecasting.