Kenneth (Southern Indian Ocean)

Apr. 23, 2019 – NASA Catches Formation of Tropical Cyclone Kenneth Near Aldabra

Visible satellite imagery from NASA’s Aqua satellite revealed the formation of Tropical Storm Kenneth in the Southern Indian Ocean. Kenneth formed north of Madagascar and east of the Aldabra Atoll.
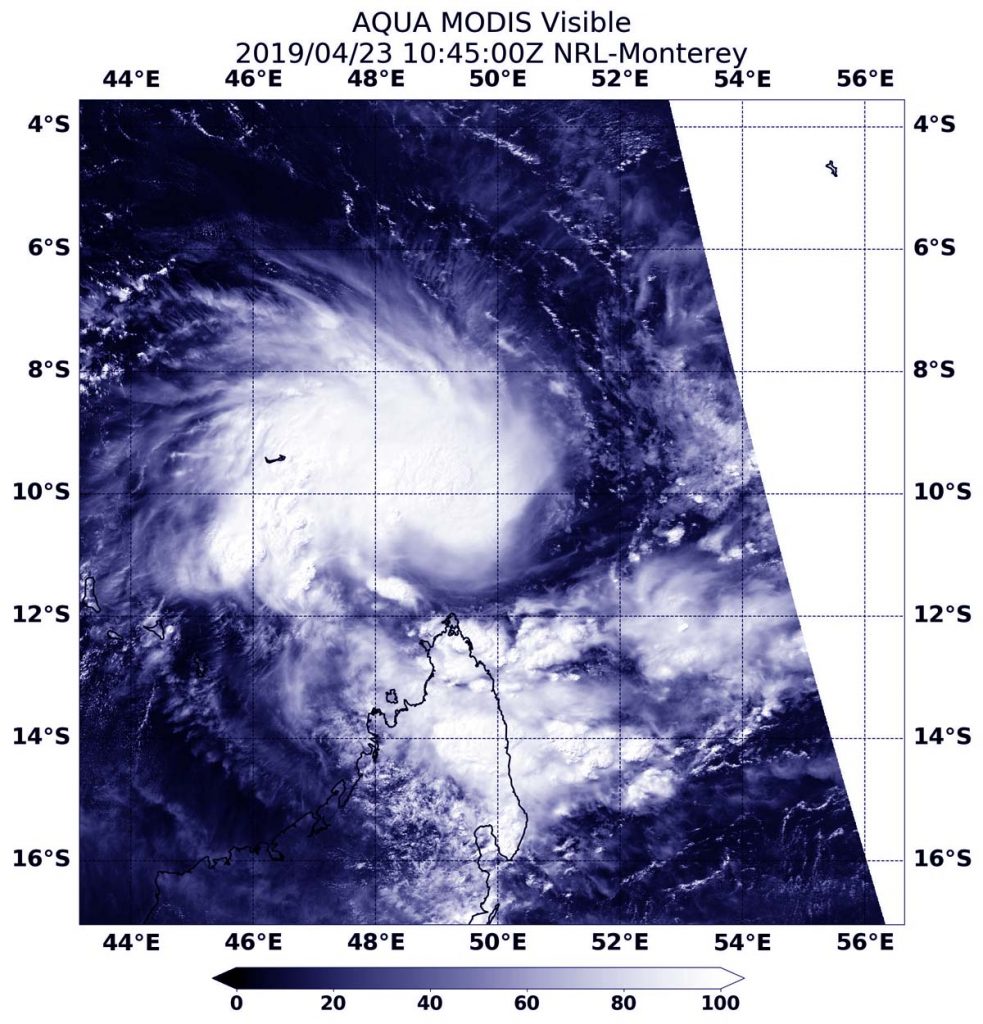
MODIS image of Kenneth
At 6:45 a.m. EDT (1045 UTC) on April 23, the MODIS instrument aboard Aqua captured a visible image of newly formed Tropical Storm Kenneth north of Madagascar and east of the Aldabra Atoll. Credit: NASA/NRL

An atoll is a ring shaped coral reef. The Aldabra is the world’s second-largest coral atoll. It is part of the Aldabra Group of islands and part of the Outer Islands of the Seychelles.

At 6:45 a.m. EDT (1045 UTC) on April 23, 2019, the Moderate Resolution Imaging Spectroradiometer or MODIS instrument aboard Aqua captured a visible image of Kenneth. The Joint Typhoon Warning Center or JTWC forecasters noted “Satellite imagery shows deep convection (rising air that forms thunderstorms that make up a tropical cyclone) beginning to wrap symmetrically around a low-level circulation center and forming the early stages of a central dense overcast.”

At 5 a.m. EDT (0900 UTC) on April 23, Tropical Storm Kenneth had maximum sustained winds near 35 knots (40 mph/65 kph). At that time, Kenneth was centered near 10.4 degrees south latitude and 49.4 degrees east longitude, approximately 727 nautical miles northwest of Port Louis, Mauritius. Kenneth was tracking to the west-southwest.

Kenneth is expected to move toward the border of Mozambique and Tanzania. The area in which the storm is forecast to track, has very warm sea surface temperatures that will allow the storm to strengthen over the next couple of days. Kenneth is forecast to make landfall in extreme northern Mozambique on April 25.

Residents along the Mozambique/Tanzania border should make preparations for storm surge along the coasts, heavy rainfall and hurricane-force winds.

On April 22, the Tanzania Meteorological Agency issued a broadcast about the development of Tropical Storm Kenneth and its possible effects: https://youtu.be/7_bROK_3RbQ.

For updates from the Tanzania Meteorological Agency, visit: http://meteo.go.tz/

By Rob Gutro
NASA’s Goddard Space Flight Center

Wallace (Southern Indian Ocean)

Apr. 10, 2019 – NASA-NOAA Satellite Sees Tropical Cyclone Wallace Dissipating

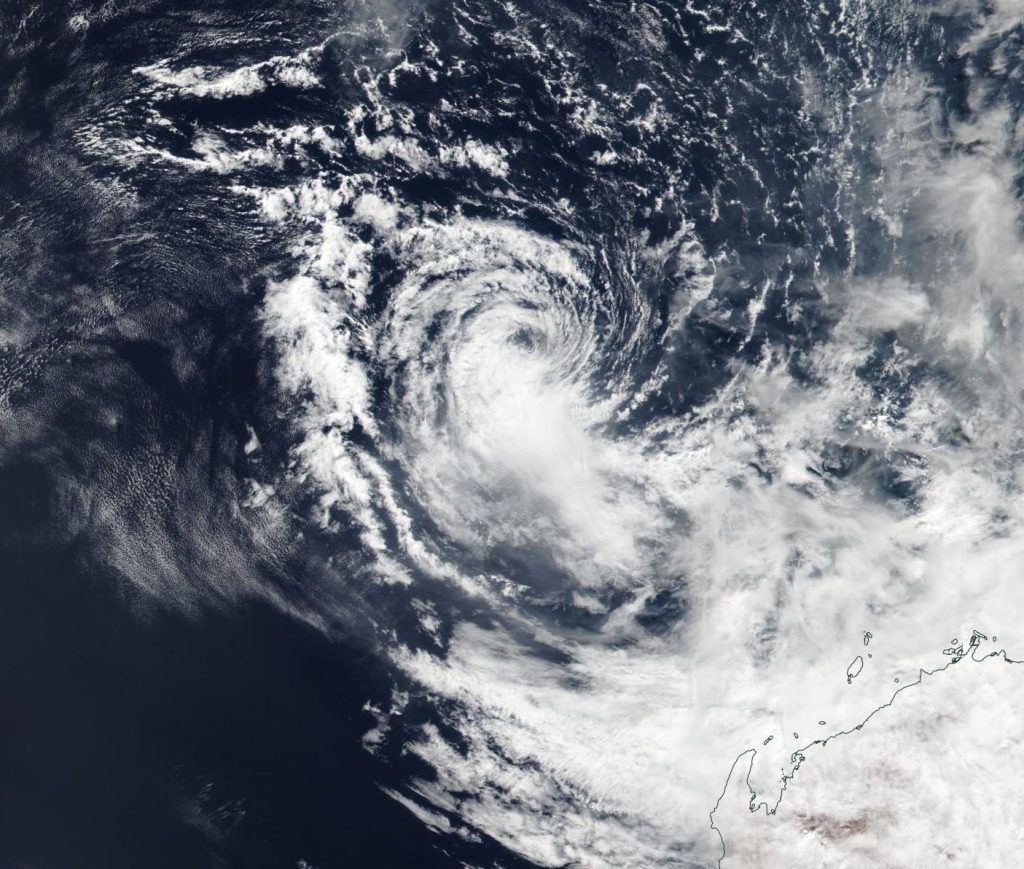
Tropical Cyclone Wallace was dissipating in the Southern Indian Ocean when NASA-NOAA’s Suomi NPP satellite passed overhead.  Wallace was located off the northwestern coast of Western Australia.

Suomi NPP image of Wallace
NASA-NOAA’s Suomi NPP satellite passed over the Southern Indian Ocean and captured a visible image of Tropical Cyclone Wallace on April 10 as it continued to dissipate off the coast of Western Australia. Credit: NASA Worldview, Earth Observing System Data and Information System (EOSDIS).

The Australian Bureau of Meteorology or ABM noted that a Strong Wind Warning was in effect for the Esperance Coast and Eucla Coast on April 10 as Wallace continued weakening far off the coast of Western Australia.

NASA-NOAA’s Suomi NPP satellite passed over Wallace on April 10 and the Visible Infrared Imaging Radiometer Suite (VIIRS) instrument provided a visible image of the storm. The VIIRS image showed wind shear has pushed the bulk of the system’s clouds southeast of the center, and was tearing the storm apart.

At 11 p.m. EDT on April 9 (0300 UTC on April 10), the Joint Typhoon Warning Center issued the final bulletin on Tropical Cyclone Wallace. At that time, maximum sustained winds were near 35 knots (40 mph/65 kph). Wallace was centered near 16.9 degrees south latitude and 111.9 east longitude. That’s about 344 nautical miles north-northwest of Learmonth. Wallace was moving to the west.

Wind shear is forecast to increase over April 10 and Wallace is expected to dissipate by April 11.

By Rob Gutro 
NASA’s Goddard Space Flight Center

Wallace (Southern Indian Ocean)

Apr. 09, 2019 – NASA Imagery Shows Winds Tearing Tropical Cyclone Wallace

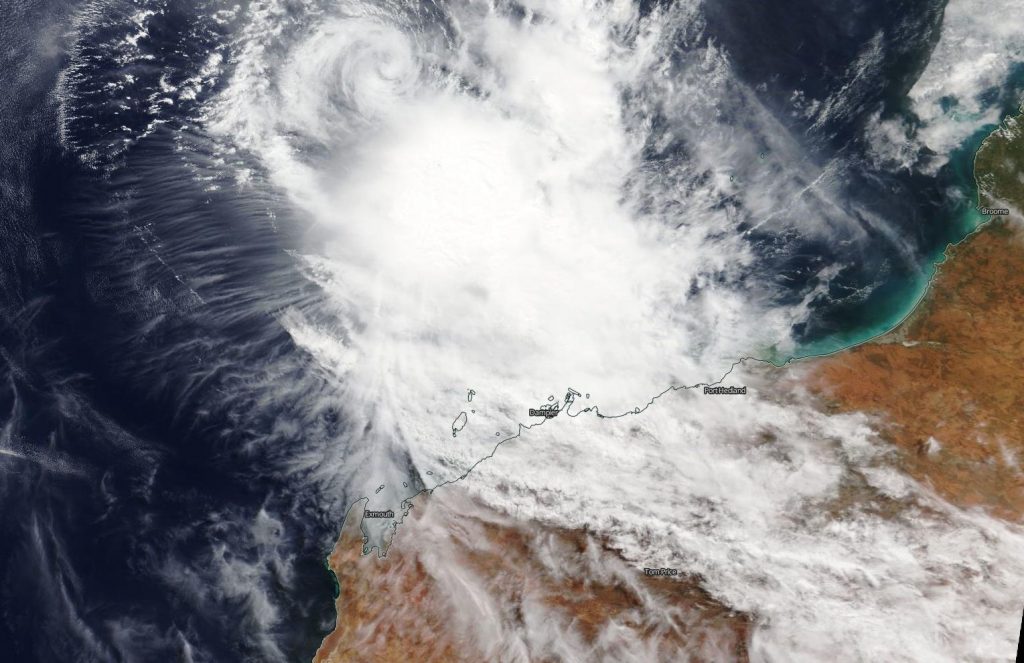
Visible imagery from NASA’s Terra satellite showed Tropical Cyclone Wallace being sheared apart from strong northwesterly winds. Clouds from Wallace stretched far inland over a well-known wilderness area.

Terra image of Wallace
On April 9, 2019, the MODIS instrument aboard NASA’s Terra satellite provided a visible image of Tropical Cyclone Wallace in the Southern Indian Ocean, off the coast of Western Australia. Credit: NASA Worldview, Earth Observing System Data and Information System (EOSDIS)

In general, wind shear is a measure of how the speed and direction of winds change with altitude. Tropical cyclones are like rotating cylinders of winds. Each level needs to be stacked on top each other vertically in order for the storm to maintain strength or intensify. Wind shear occurs when winds at different levels of the atmosphere push against the rotating cylinder of winds, weakening the rotation by pushing it apart at different levels.

On April 9, the Moderate Resolution Imaging Spectroradiometer or MODIS instrument aboard NASA’s Terra satellite provided a visible image of Wallace. Wallace’s center was over the Southern Indian Ocean and well off the Pilbara coast of Western Australia. Northwesterly winds were pushing the bulk of Wallace’s clouds southeast of its center.

Wallace’s southeastern quadrant was spreading clouds along the Pilbara coastline of northern Western Australia from Exmouth north to Port Hedland. Clouds were being pushed far inland and were streaming over Karijini National Park. The park is a large wilderness area in the Hamersley Range of Western Australia.

At 8 a.m. EDT (8:00 p.m. AWST local time), the Australian Bureau of Meteorology or ABM reported that Tropical Cyclone Wallace was located near 16.5 degrees south latitude and 113.9 east longitude. That is 560 km north-northwest of Karratha and 610 km north of Exmouth. Wallace was moving west-southwest at 7 kilometers per hour. Maximum sustained winds were near 45 knots (52 mph/83 kph).

ABM said “Tropical Cyclone Wallace will continue to weaken as it tracks westwards.

Wallace is forecast to be below tropical cyclone intensity by Wednesday [April 10] afternoon.

For updated forecasts from the Australian Bureau of Meteorology, visit: http://www.bom.gov.au

By Rob Gutro
NASA’s Goddard Space Flight Center

Wallace (Southern Indian Ocean)

Apr. 08, 2019 – NASA-NOAA Satellite Finds a More Circular Tropical Cyclone Wallace

NASA-NOAA’s Suomi NPP satellite passed over the Southern Indian Ocean and captured a visible image of what appeared to be a more organized Tropical Cyclone Wallace, off the coast of Western Australia.

Suomi NPP image of Wallace
NASA-NOAA’s Suomi NPP satellite passed over the Southern Indian Ocean and captured a visible image of Tropical Cyclone Wallace, on April 8, as it continued to move away from the coast of Western Australia. Credit: NASA Worldview, Earth Observing System Data and Information System (EOSDIS).

The Australian Bureau of Meteorology or ABM noted that only a High Seas Warning was in effect off the coast of Western Australia, as Wallace continues to track away from the coast.

NASA-NOAA’s Suomi NPP satellite passed over Wallace on April 8 and the Visible Infrared Imaging Radiometer Suite (VIIRS) instrument provided a visible image of the storm. The VIIRS image showed bands of thunderstorms from the western to the southern quadrants.

ABM noted on April 8 “An eye is starting to emerge on the most recent imagery with the system adopting a more circular appearance.” At 5:43 a.m. EDT (0943 UTC) satellite imagery showed strong convection (rising air that forms thunderstorms that make up a tropical cyclone) partially wrapping around the center to the west and south of the center.

At 8:41 a.m. EDT (8:41 pm WST local time, Western Australia) on April 8, Tropical Cyclone Wallace near 15.8 degrees south latitude and 115.8 east longitude. That’s about 560 km (348 miles) north northwest of Karratha. Wallace was moving southwest at 17 kilometers (10.5 miles) per hour. Maximum sustained winds were near 60 knots (69 mph/110 kph).

ABM stated that Wallace is forecast to strengthen over the next day or two before weakening below tropical cyclone intensity Wednesday [April 10] afternoon or evening.

A strong mid-level elongated area of high pressure or a ridge, located to Wallace’s southeast, will steer the system to the southwest overnight and then a more westerly track during Tuesday and Wednesday. Wallace is expected to remain well offshore from the Western Australian coastline and is not expected to affect the coast of Western Australia.

For updated forecasts, visit the ABM website: http://www.bom.gov.au/cyclone/index.shtml

By Rob Gutro 
NASA’s Goddard Space Flight Center

Wallace (Southern Indian Ocean)

Apr. 05, 2019 – Warnings Up in Western Australia as Suomi NPP Satellite Views Tropical Cyclone 23S

Tropical Cyclone 23S has developed north of the Kimberley coast, and generated warnings. NASA-NOAA’s Suomi NPP satellite passed overhead as the low pressure area consolidated into a tropical cyclone.

Suomi NPP Image of 23S (Wallace)
NASA-NOAA’s Suomi NPP satellite passed over the Southern Indian Ocean and captured a visible image of Tropical Cyclone 23S or Wallace, on April 5, as skirted the coast of Western Australia. Credit: NASA Worldview, Earth Observing System Data and Information System (EOSDIS).

23S is expected to be renamed Tropical Storm Wallace as it falls in Australia’s area of responsibility, and follows their naming list.

The Australian Bureau of Meteorology or ABM posted warnings from Kalumburu to Beagle Bay, not including Derby.

NASA-NOAA’s Suomi NPP satellite passed over 23S on April 5 and the Visible Infrared Imaging Radiometer Suite (VIIRS) instrument provided a visible image of the storm. The VIIRS image showed an elongated storm. The southeastern quadrant of 23S was over the Kimberly coast. The Joint Typhoon Warning Center or JTWC noted “animated multispectral satellite imagery which depicts isolated, deep central convection and shallow rain bands.”

JTWC stated at 5 a.m. EDT (0900 UTC) that 23S was located near 12.0 south latitude and 127.4 east longitude, about 207 nautical miles (238 miles/383 km) west of Darwin, Australia. 23S was moving to the west-southwest and had maximum sustained winds near 35 knots (40 mph/65 kph), making it tropical-storm force.

Tropical Storm 23S is forecast to move west-southwest while intensifying over the next four days as it moves parallel to the coast of Western Australia. The ABM noted “there remains a slight risk that the cyclone could approach the west Pilbara coast next week.”

For updated forecasts, visit the ABM website: http://www.bom.gov.au/cyclone/index.shtml

By Rob Gutro 
NASA’s Goddard Space Flight Center

Joaninha (Southern Indian Ocean)

Apr. 01, 2019 – NASA Finds Wind Shear Tearing Apart Subtropical Cyclone Joaninha

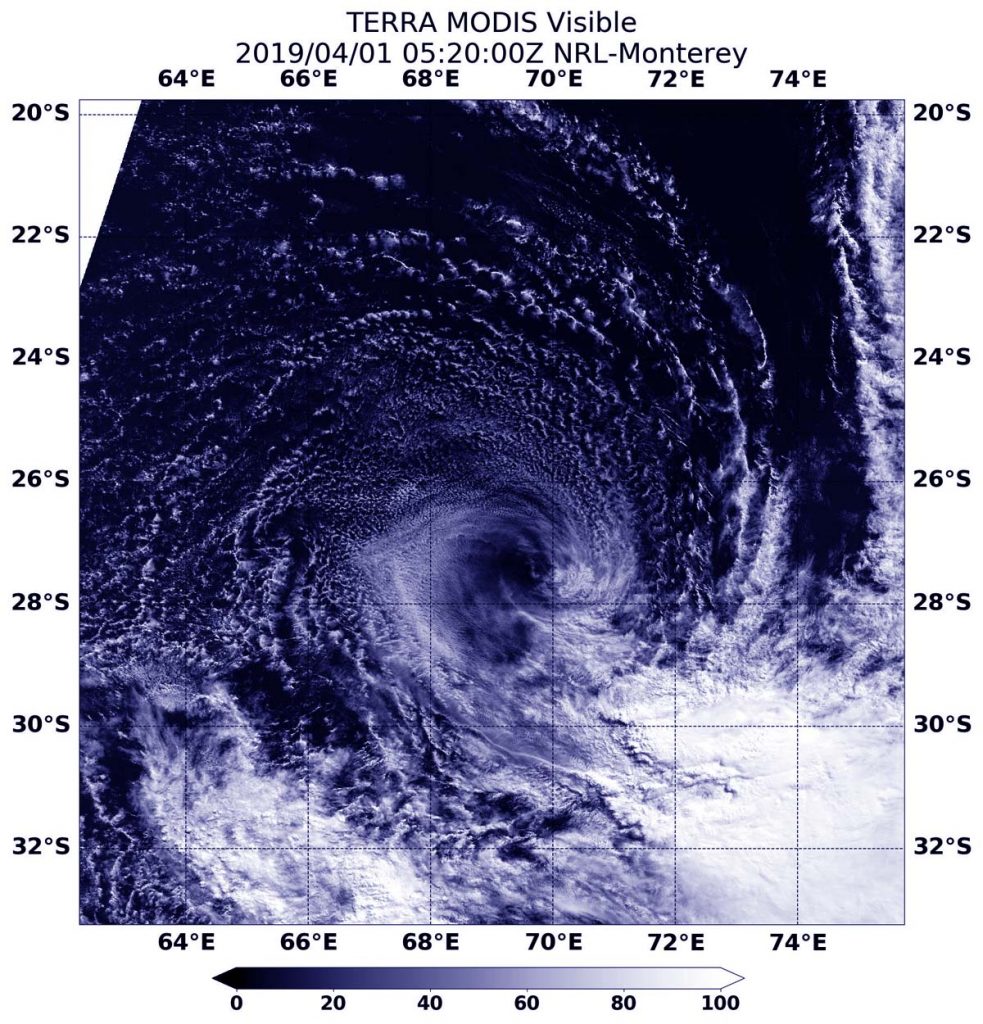
Visible imagery from NASA’s Terra satellite revealed that strong wind shear was adversely affecting Subtropical Cyclone Joaninha in the Southern Indian Ocean.

Terra image of Joaninha
On April 1 at 1:20 a.m. EDT (0520 UTC), the MODIS instrument aboard NASA’s Terra satellite provided a visible image of Subtropical Cyclone Joaninha that showed the storm was being adversely affected by vertical wind shear. Credit: NASA/NRL

On April 1 at 1:20 a.m. EDT (0520 UTC), the Moderate Resolution Imaging Spectroradiometer or MODIS instrument aboard NASA’s Terra satellite provided a visible image of Subtropical Cyclone Joaninha. Joaninha transitioned into a subtropical storm over the weekend of March 30 and 31. Joaninha’s center was surrounded by a swirl of clouds around its center with most of its clouds and thunderstorms pushed southeast of center. Strong westerly to northwesterly vertical wind shear were tearing the storm apart.

In general, wind shear is a measure of how the speed and direction of winds change with altitude. Tropical cyclones are like rotating cylinders of winds. Each level needs to be stacked on top each other vertically in order for the storm to maintain strength or intensify. Wind shear occurs when winds at different levels of the atmosphere push against the rotating cylinder of winds, weakening the rotation by pushing it apart at different levels.

On March 31 at 0300 GMT, March 31 (11pm EDT March 30), the Joint Typhoon Warning Center issued the final bulletin on Joaninha. At that time, Joaninha was located near 26.8 degrees south latitude and 69.8 degrees east longitude, about 796 miles east-southeast of Port Louis, Mauritius. It was moving south southwest. Maximum sustained winds at the time were near 35 knots (40 mph/65 kph) and it was weakening.

Joaninha continued to dissipate from adverse atmospheric conditions.

By Rob Gutro
NASA’s Goddard Space Flight Center