Mitag – Northwestern Pacific Ocean

Oct. 01, 2019 – NASA Satellite Shows Typhoon Mitag’s Large Reach Over East China Sea

The bulk of Typhoon Mitag’s clouds and precipitation has been pushed north of its center, extending its reach over the East China Sea. Mitag was centered just off the coast of China’s Zhejiang province when NASA-NOAA’s Suomi NPP satellite passed overhead, but the bulk of the clouds were pushed north of center to the Korean Peninsula and southern Japan.
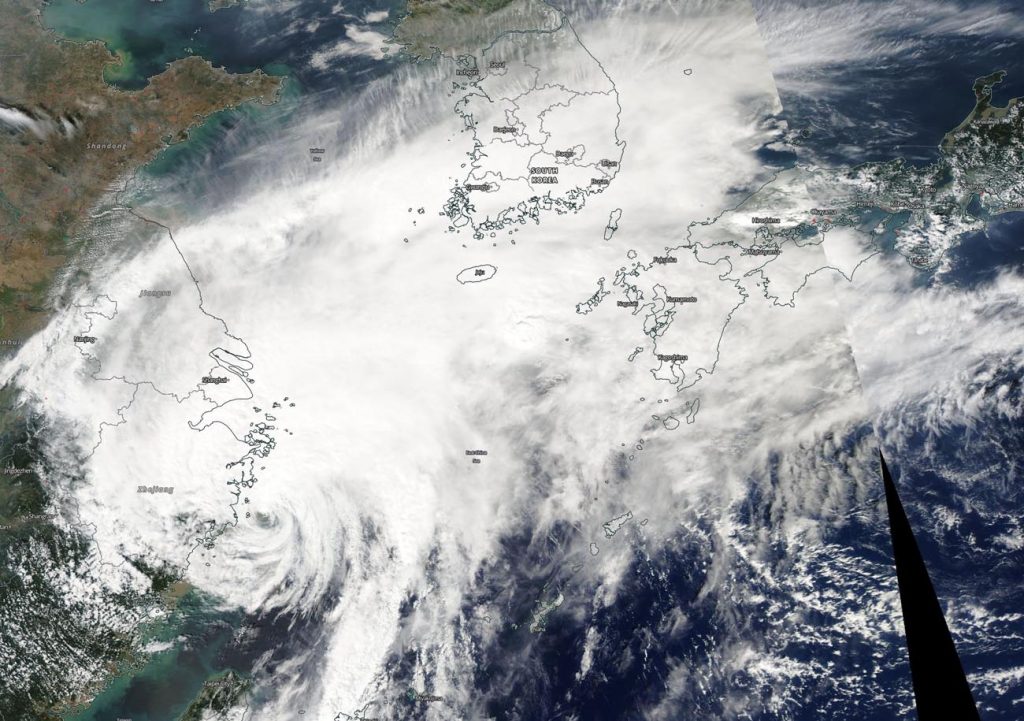
Suomi NPP image of Mitag
NASA-NOAA’s Suomi NPP satellite passed over Typhoon Mitag in the East China Sea just off the coast of China’s Zhejiang province. The image showed Mitag’s northern reach extended to the Korean peninsula and southern Japan. Credit: NASA Worldview, Earth Observing System Data and Information System (EOSDIS)

The Visible Infrared Imaging Radiometer Suite (VIIRS) instrument aboard Suomi NPP provided a visible image of Mitag on Oct. 1, showing its eye was just off the coast of China’s Zhejiang province in the East China Sea. The VIIRS image revealed some bands of thunderstorms wrapped around the partially-exposed, ragged low-level center of circulation off the China coast.

The main area of deep convection (rising air that forms thunderstorms that make up a tropical cyclone) and thunderstorms is located north of center and had decoupled from the center. That decoupled area of storms extended northeast to the Korean Peninsula and to Kyushu, the southwestern most of Japan’s main islands.

Visible imagery from NASA satellites helps forecasters understand if a storm is organizing or weakening. The shape of a tropical cyclone provides forecasters with an idea of its organization and strength. The more circular a storm appears, the stronger it can be. Because the bulk of Mitag’s clouds and showers are pushed north of the center, it appears to be weakening. The image was created by the NASA Worldview Earth Observing System Data and Information System (EOSDIS) at NASA’s Goddard Space Flight Center in Greenbelt, Md.

On Oct. 1, the China Meteorological Administration posted several warnings including Typhoon Warning, and warnings for heavy rain. Those warnings can be found at: http://www.cma.gov.cn/en2014/weather/Warnings/WarningSignals/201409/t20140919_261777.html

At 5 a.m. EDT (0900 UTC) on Oct. 1, Typhoon Mitag had maximum sustained winds near 65 knots (75 mph/120 kph). It was centered near 28.7 degrees north latitude and 122.3 degrees east longitude, about 156 nautical miles south-southeast of Shanghai, China. Mitag is moving north. Forecasters at the Joint Typhoon Warning Center expect Mitag will turn to the northeast and pass over South Korea while weakening. It is expected to become extra-tropical in the Sea of Japan.

Hurricanes are the most powerful weather event on Earth. NASA’s expertise in space and scientific exploration contributes to essential services provided to the American people by other federal agencies, such as hurricane weather forecasting.

By Rob Gutro 
NASA’s Goddard Space Flight Center

Lorenzo – Atlantic Ocean

Oct. 01, 2019 – NASA Satellite Sees a Large Hurricane Lorenzo Headed toward Azores

Hurricane Lorenzo was heading toward the Azores Islands when NASA-NOAA’s Suomi NPP satellite provided forecasters with an image of the storm. Satellite imagery revealed the large extent of the storm.

Suomi NPP image of Lorenzo
NASA-NOAA’s Suomi NPP satellite passed over Hurricane Lorenzo twice in the Northeastern Atlantic Ocean to obtain a full picture, stitched together, of the large storm. Credit: NASA Worldview, Earth Observing System Data and Information System (EOSDIS)

Visible imagery from NASA satellites help forecasters understand if a storm is organizing or weakening. The shape of a tropical cyclone provides forecasters with an idea of its organization and strength. The more circular a storm appears, the stronger it can be. The Visible Infrared Imaging Radiometer Suite (VIIRS) instrument aboard Suomi NPP provided a visible image of Lorenzo on Sept. 30 and revealed that Lorenzo has grown in size. In fact, it took two orbits of NASA-NOAA’s Suomi NPP satellite to capture the entire storm. Those two images were stitched together using the NASA Worldview, Earth Observing System Data and Information System (EOSDIS) at NASA’s Goddard Space Flight Center in Greenbelt, Md.

In the VIIRS imagery, Lorenzo’s eye had become less distinct on satellite images over Sept. 30 and Oct. 1, but the system remains very well organized with tightly curved convective bands.

Lorenzo is a very large tropical cyclone. NOAA’s National Hurricane Center or NHC noted that hurricane-force winds extend outward up to 90 miles (150 km) from the center and tropical storm-force winds extend outward up to 345 miles (555 km).

On Oct. 1, a Hurricane Warning was in effect for islands in the Azores that included Flores, Corvo, Faial, Pico, Sao Jorge, Graciosa, and Terceira. A Tropical Storm Warning is in effect for Sao Miguel, Santa Maria.

At 8 am EDT (1200 UTC) on Oct. 1, the center of Hurricane Lorenzo was located near latitude 34.3 degrees north and longitude 29.0 degrees west. It was centered about 555 miles (895 km) southwest of Flores in the Western Azores Islands. Lorenzo is moving toward the northeast near 22 mph (35 kph). Maximum sustained winds are near 100 mph (155 kph) with higher gusts.  Only slow weakening is expected during the next two days. The estimated minimum central pressure is 962 millibars.

Hurricanes are the most powerful weather event on Earth. NASA’s expertise in space and scientific exploration contributes to essential services provided to the American people by other federal agencies, such as hurricane weather forecasting.

On the forecast track, the center of Lorenzo is expected to pass near the western Azores early on Wednesday, Oct. 2.

For updated forecasts. Visit: www.nhc.noaa.gov

By Rob Gutro 
NASA’s Goddard Space Flight Center