Nov. 15, 2019 – NASA Looks at Tropical Depression Kalmaegi’s Water Vapor Concentration
When NASA’s Aqua satellite passed over the Philippine Sea, water vapor data provided information about the intensity of Tropical Depression Kalmaegi.
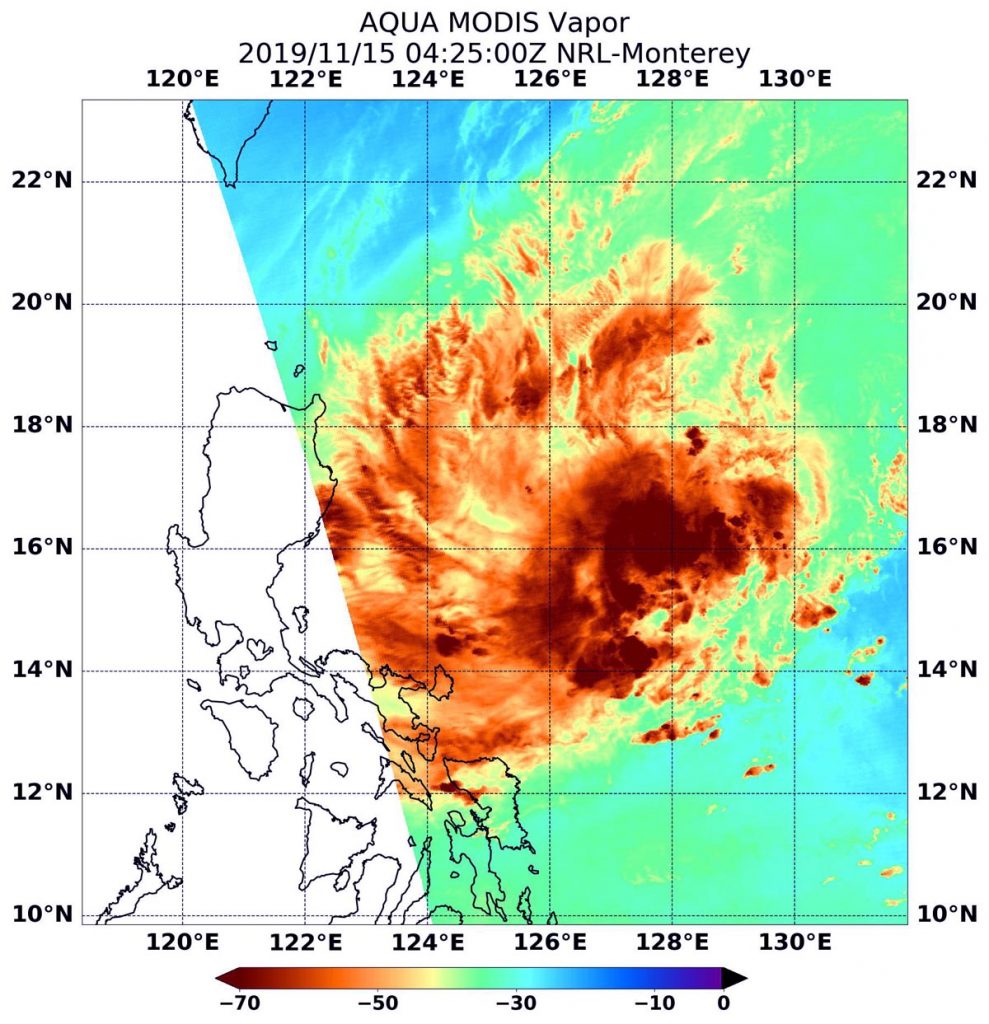
NASA’s Aqua satellite passed over the Philippine Sea and observed Tropical Storm Kalmaegi on Nov. 15 at 0425 UTC (Nov. 14 at 11:25 p.m. EST). The highest concentrations of water vapor (brown) and coldest cloud top temperatures were north and west of the center. Credits: NASA/NRL
NASA’s Aqua satellite passed Kalmaegi on Nov. 15 at 0425 UTC (Nov. 14 at 11:25 p.m. EST) and the Moderate Resolution Imaging Spectroradiometer or MODIS instrument gathered water vapor content and temperature information. The MODIS image showed highest concentrations of water vapor and coldest cloud top temperatures were north and west of the center. MODIS data also showed coldest cloud top temperatures were as cold as or colder than minus 70 degrees Fahrenheit (minus 56.6 degrees Celsius) in those storms. Storms with cloud top temperatures that cold have the capability to produce heavy rainfall.
Water vapor analysis of tropical cyclones tells forecasters how much development potential a storm has. Water vapor releases latent heat as it condenses into liquid. That liquid becomes the clouds and thunderstorms that make up a tropical cyclone. Temperature is important when trying to understand how strong storms can be. The higher the cloud tops, the colder and the stronger they are.
At 10 a.m. EDT (1500 UTC) on Nov. 15, Kalmaegi was located near latitude 15.8 degrees north and longitude 125.9 degrees east. Maximum sustained winds were near 30 knots (34.5 mph/55.5 kph). The depression was moving to the west.
Forecasters at the Joint Typhoon Warning Center expect the storm to strengthen into a tropical storm, make landfall in the northern Philippines and cross into the South China Sea by Nov. 19.
NASA’s Aqua satellite is one in a fleet of NASA satellites that provide data for hurricane research.
Typhoons and hurricanes are the most powerful weather event on Earth. NASA’s expertise in space and scientific exploration contributes to essential services provided to the American people by other federal agencies, such as hurricane weather forecasting.
Nov. 15, 2019 – NASA Gets an Eyeful of Typhoon Fengshen
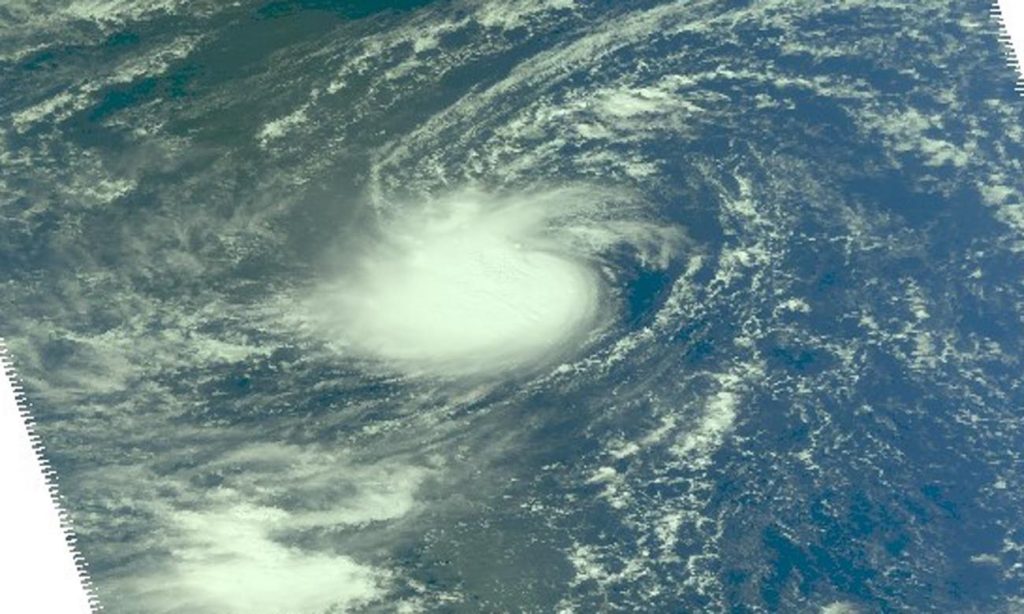
NASA’s Terra satellite captured an image of Typhoon Fengshen after its eye opened as Fengshen had strengthened from a tropical storm to a typhoon and developed an eye.
On Nov. 15, the MODIS instrument that flies aboard NASA’s Terra satellite provided a visible image of Typhoon Fengshen in the Northwestern Pacific Ocean after its eye opened. Credit: NASA Worldview
On Nov. 15, the Moderate Resolution Imaging Spectroradiometer or MODIS instrument that flies aboard NASA’s Terra satellite provided a visible image of Fengshen. The MODIS image showed the cyclone was producing a large area of deep convection and strong thunderstorms around the visible eye. MODIS imagery showed the eye is about 10 nautical miles in diameter. Bands of thunderstorms were wrapping into the eye.
At 5 a.m. EDT (0900 UTC), the center of Typhoon Fengshen was located near latitude 21.6 degrees north and longitude 142.3 degrees east. That is about 227 nautical miles south-southeast of Iwo To Island, Japan. Fengshen has tracked to the north-northwest. Maximum sustained winds were near 110 knots (127 mph/204 kph).
The Joint Typhoon Warning Center expects slight strengthening over the day on Nov. 15 before a weakening trend begins. The storm is expected to make a loop over the next five days and head toward the northwest by Nov. 19, passing to the northeast of Iwo To.
NASA’s Terra satellite is one in a fleet of NASA satellites that provide data for hurricane research.
Hurricanes are the most powerful weather event on Earth. NASA’s expertise in space and scientific exploration contributes to essential services provided to the American people by other federal agencies, such as hurricane weather forecasting.
Nov. 15, 2019 – NASA Identifies New Eastern Pacific Tropical Storm
NASA’s Terra satellite captured an image of developing Tropical Storm Raymond in the Eastern Pacific Ocean.
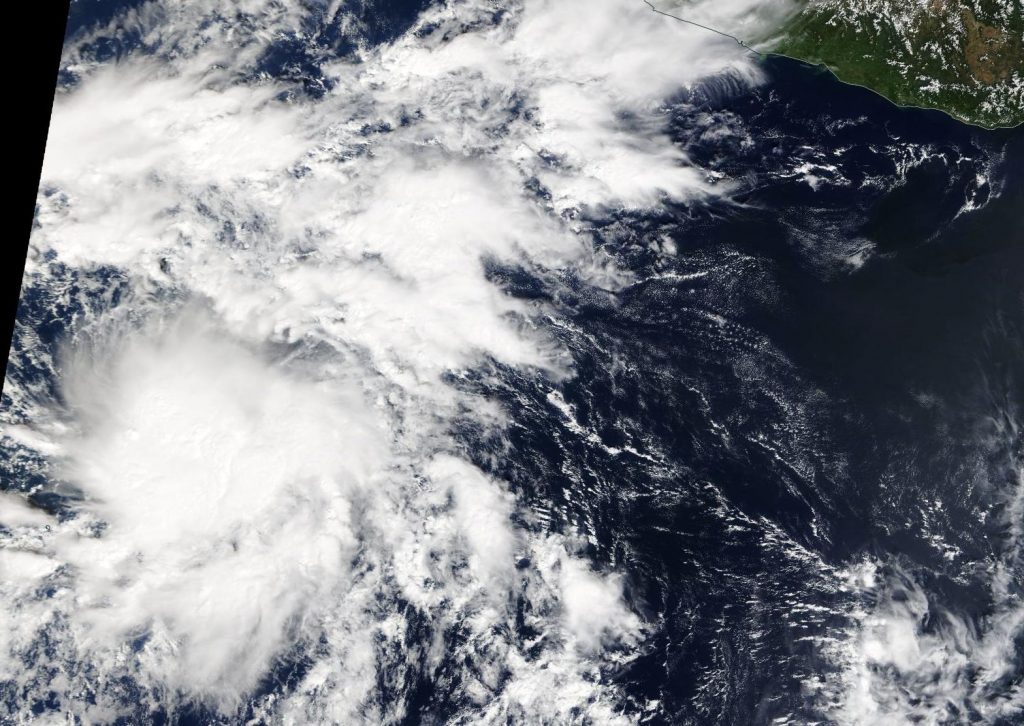
On Nov. 14, the MODIS instrument that flies aboard NASA’s Terra satellite provided a visible image of then Tropical Depression 20 in the Eastern Pacific. TD20 continued organizing and became Tropical Storm Raymond on Nov. 15. Credit: NASA Worldview
On Nov. 14, the MODIS or Moderate Resolution Imaging Spectroradiometer instrument that flies aboard NASA’s Terra satellite provided a visible image of then Tropical Depression 20 (TD20) in the Eastern Pacific. The image showed that the storm was being affected by outside winds, pushing much of the clouds and showers to the east of the center. Despite that wind shear, TD20 continued organizing and became Tropical Storm Raymond on Nov. 15.
In general, wind shear is a measure of how the speed and direction of winds change with altitude. Tropical cyclones are like rotating cylinders of winds. Each level needs to be stacked on top each other vertically in order for the storm to maintain strength or intensify. Wind shear occurs when winds at different levels of the atmosphere push against the rotating cylinder of winds, weakening the rotation by pushing it apart at different levels.
By Nov. 15 at 10 a.m. EST, TD20 had strengthened and organized into a tropical storm and was named Raymond. At that time, the cyclone was located several hundred miles south of the Baja California peninsula. NOAA’s National Hurricane Center (NHC) noted that the system is still sheared from the west; however, recent microwave and first-light visible imagery indicate that the center of the cyclone may be reforming closer to the stronger developing thunderstorms.
The center of Tropical Storm Raymond was located near latitude 14.1 degrees north and longitude 108.8 degrees west. That is about 610 miles (985 km) south of the southern tip of Baja California, Mexico. Raymond is moving toward the north-northwest near 7 mph (11 kph), and this general motion with a slight increase in forward speed is expected through today. A turn toward the north or north-northeast is forecast by late Saturday, Nov. 16.
The estimated minimum central pressure is 1005 millibars. Maximum sustained winds have increased to near 45 mph (75 kph) with higher gusts. Some additional strengthening is anticipated during the next day or so.
Weakening is forecast to occur by Sunday, and the system is predicted to degenerate into a remnant low by late Sunday or early Monday, Nov. 18.
NHC cautioned that interests in the southern Baja California peninsula should monitor the progress of Raymond. Raymond is expected to produce total rainfall accumulations of 2 to 4 inches across the southern portions of Baja California Sur. This rainfall could produce life-threatening flash floods.
NASA’s Terra satellite is one in a fleet of NASA satellites that provide data for hurricane research.
Hurricanes are the most powerful weather event on Earth. NASA’s expertise in space and scientific exploration contributes to essential services provided to the American people by other federal agencies, such as hurricane weather forecasting.
Nov. 14, 2019 – NASA-NOAA Satellite Finds Displaced Power in Tropical Cyclone Kalmaegi
Tropical Cyclone Kalmaegi is still experiencing wind shear and those winds have continued to displace the strongest storms north of the cyclone’s center. NASA-NOAA’s Suomi NPP satellite passed overhead and identified those strong storms using infrared light.
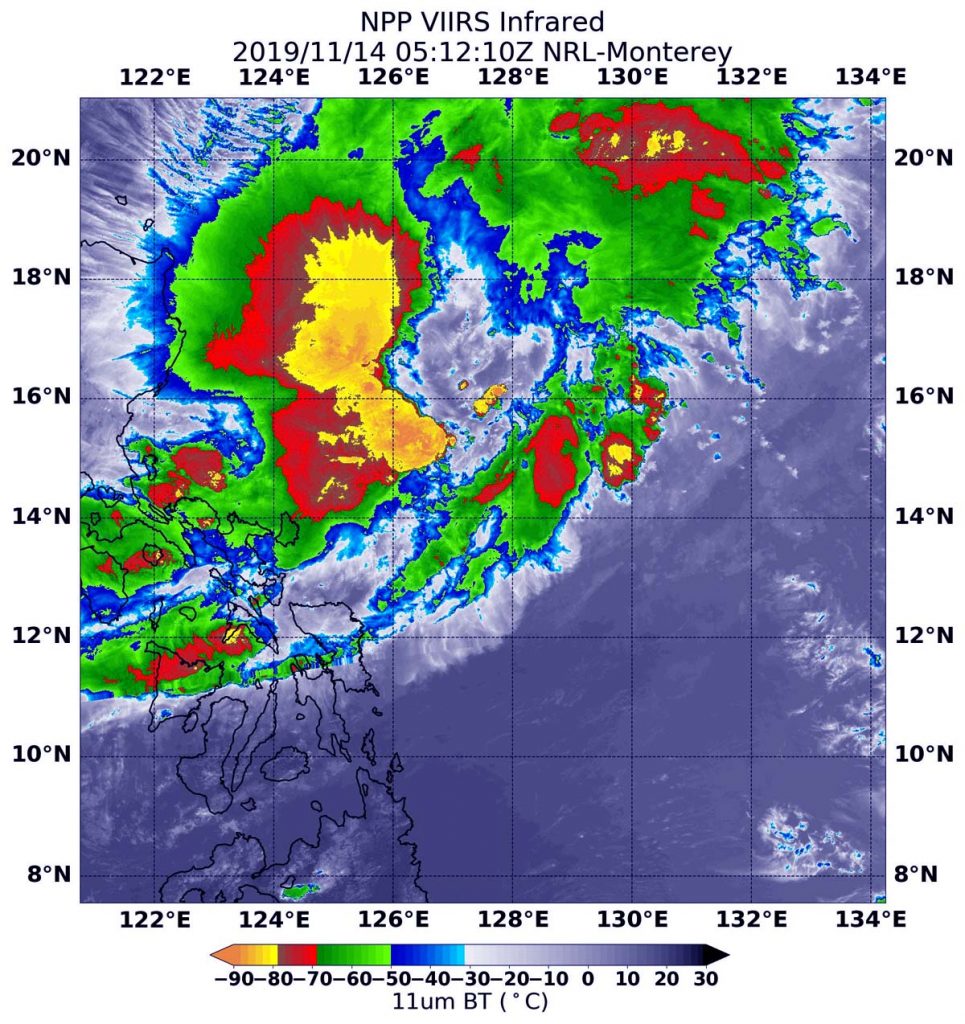
NASA-NOAA’s Suomi NPP satellite passed over Kalmaegi in the Northwestern Pacific Ocean and the VIIRS instrument aboard captured this image of the storm on Nov. 14 at 1:12 a.m. EST (0512 UTC). VIIRS showed strong storms in a large area (yellow/green) north and northwest of the center, where cloud top temperatures were as cold as minus 80 degrees Fahrenheit (minus 62.2 Celsius). Credit: NASA/NRL
The Visible Infrared Imaging Radiometer Suite (VIIRS) instrument aboard Suomi NPP provided an infrared image of the storm. Infrared imagery reveals cloud top temperatures, and the higher the cloud top, the colder it is, and the stronger the storm. The VIIRS instrument aboard captured an infrared image of the storm on Nov. 14 at 1:12 a.m. EST (0512 UTC). VIIRS showed strong storms in a large area north and northwest of the center, where cloud top temperatures were as cold as minus 80 degrees Fahrenheit (minus 62.2 Celsius). Storms with cloud tops that cold have been found to generate heavy rainfall.
Wind shear seems to be preventing Kalmaegi from consolidating, as the storm is still a tropical depression. In general, wind shear is a measure of how the speed and direction of winds change with altitude. Tropical cyclones are like rotating cylinders of winds. Each level needs to be stacked on top each other vertically in order for the storm to maintain strength or intensify. Wind shear occurs when winds at different levels of the atmosphere push against the rotating cylinder of winds, weakening the rotation by pushing it apart at different levels.
At 10 a.m. EDT (1500 UTC), the center of Kalmaegi was located near latitude 15.3 degrees north and longitude 125.8 degrees east. That is 286 nautical miles east of Manila, Philippines. Maximum sustained winds are near 30 knots (34.5 mph/55.5 kph).
Kalmaegi is moving toward the west-northwest toward a landfall in Luzon, Philippines in the northern part of the country. Landfall is expected in northeastern Luzon on Nov. 16.
Typhoons and hurricanes are the most powerful weather event on Earth. NASA’s expertise in space and scientific exploration contributes to essential services provided to the American people by other federal agencies, such as hurricane weather forecasting.
Nov. 14, 2019 – NASA Infrared Data Shows Strength in Fengshen
Tropical Storm Fengshen’s cold cloud top temperatures revealed that the storm was maintaining strength as a strong tropical storm. Forecasters expect Fengshen will continue strengthening and reach typhoon status.
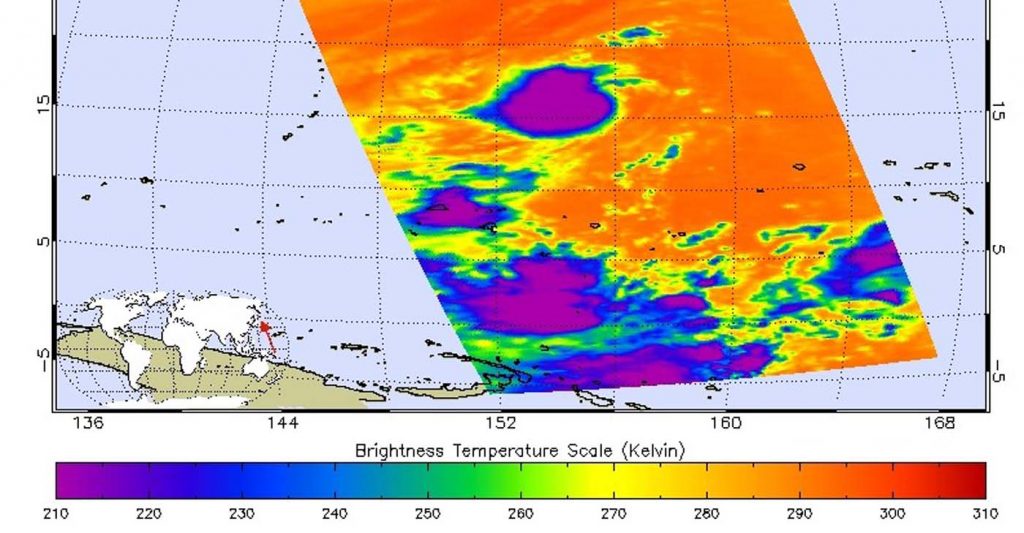
On Nov. 13 at 0259 UTC (Nov. 12 at 9:59 p.m. EST) NASA’s Aqua satellite analyzed Tropical Storm Fengshen using the Atmospheric Infrared Sounder or AIRS instrument. AIRS found coldest cloud top temperatures (purple) as cold as or colder than minus 63 degrees Fahrenheit (minus 53 degrees Celsius) north and east of Imelda’s center. Credit: NASA JPL/Heidar Thrastarson
One of the ways NASA researches tropical cyclones is by using infrared data that provides temperature information. The AIRS instrument aboard NASA’s Aqua satellite captured a look at the temperatures in Fengshen which gave insight into the storm’s strength.
Cloud top temperatures provide information to forecasters about where the strongest storms are located within a tropical cyclone. Tropical cyclones do not always have uniform strength, and some sides are stronger than others. The stronger the storms, the higher they extend into the troposphere, and the colder the cloud temperatures.
On Nov. 13 at 0259 UTC (Nov. 12 at 9:59 p.m. EST) NASA’s Aqua satellite analyzed Tropical Storm Fengshen in near infrared light, using the Atmospheric Infrared Sounder or AIRS instrument. Credit: NASA JPL/Heidar Thrastarson
On Nov. 13 at 0259 UTC (Nov. 12 at 9:59 p.m. EST) NASA’s Aqua satellite analyzed Tropical Storm Fengshen in near infrared light, using the Atmospheric Infrared Sounder or AIRS instrument. Credit: NASA JPL/Heidar ThrastarsonOn Nov. 13 at 0259 UTC (Nov. 12 at 9:59 p.m. EST) NASA’s Aqua satellite analyzed the storm using the Atmospheric Infrared Sounder or AIRS instrument. AIRS found coldest cloud top temperatures as cold as or colder than minus 63 degrees Fahrenheit (minus 53 degrees Celsius) around Fengshen’s center. NASA research has shown that cloud top temperatures that cold indicate strong storms that have the capability to create heavy rain.
By early Nov. 14, forecasters at the Joint Typhoon Warning Center noted, “Infrared imagery revealed that deep convection has re-built over the low-level circulation center with improved deep convective banding [of thunderstorms].” Microwave imagery also revealed an eye developing.
On Nov. 14, the National Weather Service (NWS) in Tiyan, Guam stated a Typhoon Warning remains in effect for Agrihan, Pagan, and Alamagan in the Commonwealth of the Northern Marianas. Damaging winds, including winds of 39 mph or more are expected after midnight with near typhoon conditions, shortly afterwards.
At 7 a.m. EDT (10 p.m. ChST, local time Guam/1200 UTC) on Nov. 14, the center of Tropical Storm Fengshen was located near latitude 17.5 degrees north and longitude 146.5 degrees east, moving west at 17 mph. That puts the center of Fengshen about 100 miles south-southeast of Agrihan, 65 miles southeast of Pagan and 45 miles east of Alamagan.
Maximum sustained winds remain near 65 mph. Fengshen is expected to intensify slowly tonight and Friday, and will likely be a typhoon by late Friday morning, after it has passed through the northern Marianas.
NWS said, “Fengshen is expected to gradually turn toward west-northwest later tonight [Nov. 14], passing very close to Alamagan Island early Friday morning [Nov. 15]. Fengshen will then turn slowly northwest on Friday as it moves away from the Marianas.”
Typhoons and hurricanes are the most powerful weather event on Earth. NASA’s expertise in space and scientific exploration contributes to essential services provided to the American people by other federal agencies, such as hurricane weather forecasting.
The AIRS instrument is one of six instruments flying on board NASA’s Aqua satellite, launched on May 4, 2002.
Nov. 13, 2019 – NASA Finds Heavy Rainfall Along Central Philippine Coast from Tropical Depression Kalmaegi
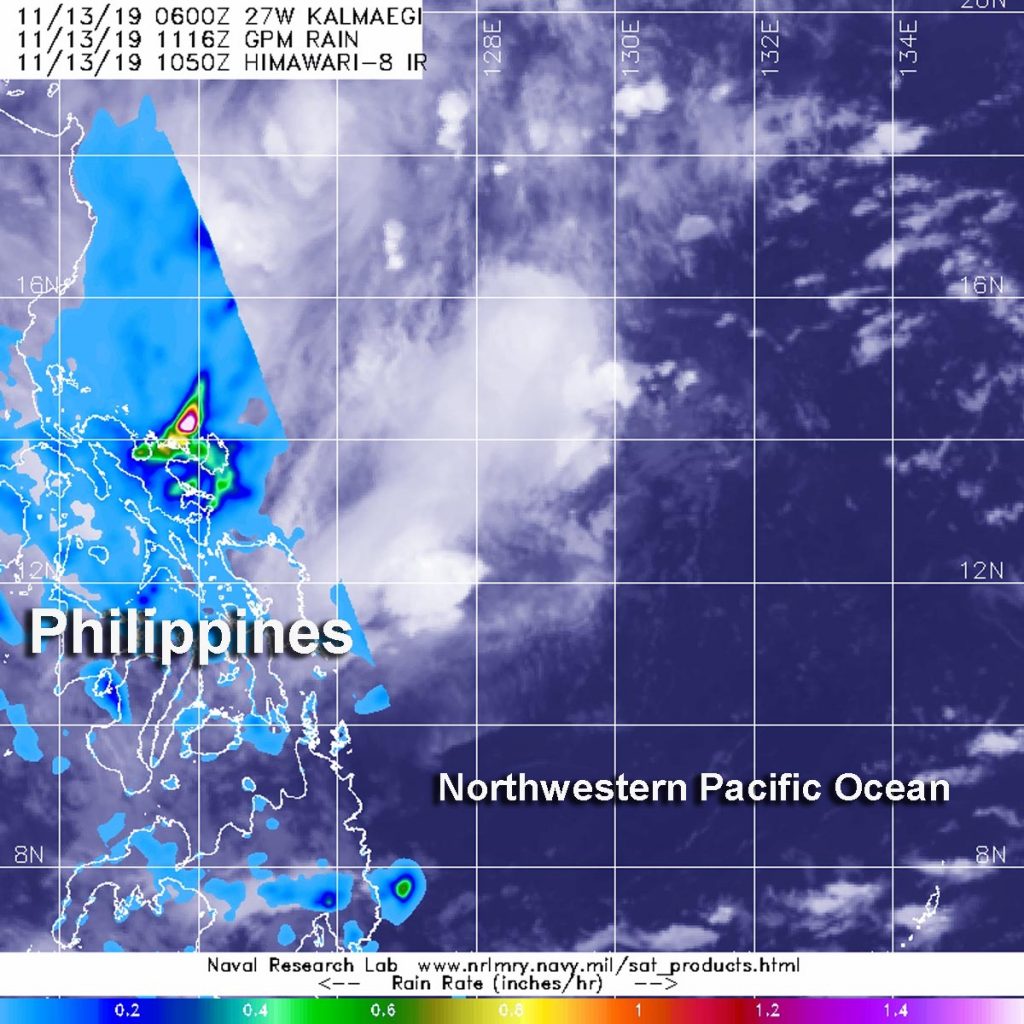
Tropical Depression Kalmaegi continues moving west through the Philippine Sea and toward a landfall in the east central Philippines. NASA provided forecasters with an analysis of rainfall rates occurring in the strengthening tropical cyclone.
The GPM core satellite passed over strengthening Tropical Depression Kalmaegi in the Philippine Sea, Northwestern Pacific Ocean on Nov. 13 at 6:16 a.m. EST (1116 UTC) and found the heaviest rainfall (pink) near the eastern coast of the Central Philippines, falling at a rate of over 40 mm (about 1.6 inch) per hour. Credit: NASA/JAXA/NRL
NASA has the unique capability of peering under the clouds in storms and measuring the rate at which rain is falling. Global Precipitation Measurement mission or GPM passed over Kalmaegi from its orbit in space and measured rainfall rates throughout the storm.
GPM passed over Kalmaegi in the Philippine Sea, Northwestern Pacific Ocean on Nov. 13 at 6:16 a.m. EST (1116 UTC) and found the heaviest rainfall near the eastern coast of the Central Philippines, falling at a rate of over 40 mm (about 1.6 inch) per hour. Forecasters incorporate the rainfall data into their forecasts. Animated enhanced infrared satellite imagery also shows that it is currently a disorganized system with deep and flaring convection pushed westward from the low-level circulation center which is where GPM found the heaviest rainfall.
At 10 a.m. EST (1500 UTC) on Nov. 13, the Joint Typhoon Warning Center or JTWC noted that Kalmaegi was located near latitude 13.5 degrees north and longitude 128.0 degrees east, about 439 nautical miles east of Manila, Philippines. The depression was moving to the west-northwest and had maximum sustained winds 30 knots (34.5 mph/55.5 kph).
Kalmaegi is moving west and is forecast to start weakening within 24 hours. The storm is then forecast to turn to the west-southwest while slowly weakening as it approaches the Gulf of Aden.
Typhoons and hurricanes are the most powerful weather event on Earth. NASA’s expertise in space and scientific exploration contributes to essential services provided to the American people by other federal agencies, such as hurricane weather forecasting.
Both the Japan Aerospace Exploration Agency, JAXA and NASA manage GPM.
Nov. 13, 2019 – NASA Provides an Infrared Analysis of Tropical Storm Fengshen
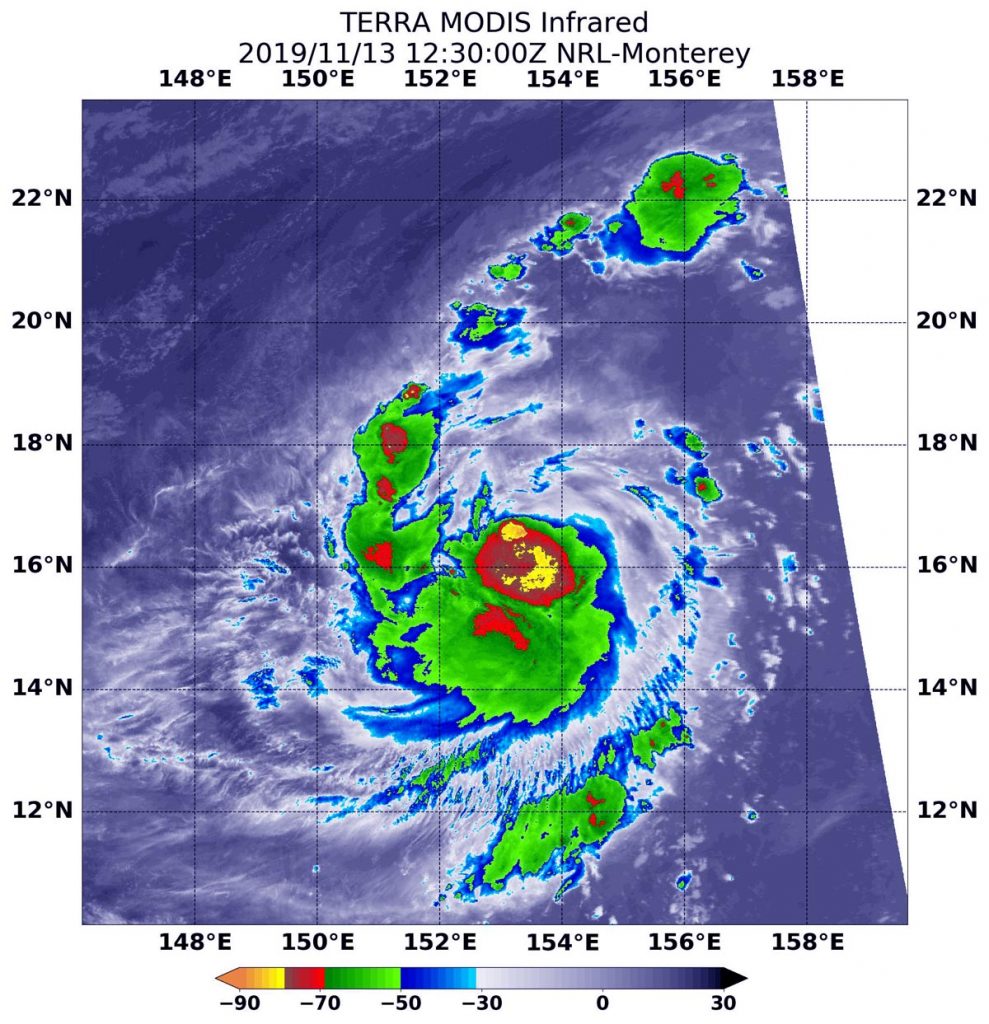
Tropical Storm Fengshen continued to strengthen in the Northwestern Pacific Ocean as NASA’s Terra satellite passed overhead. Infrared imagery from an instrument aboard Terra revealed very high, powerful storms with very cold cloud top temperatures circling the center.
On Nov. 13 at 7:30 a.m. EST (1230 UTC), the MODIS instrument that flies aboard NASA’s Terra satellite showed strongest thunderstorms with coldest cloud top temperatures (yellow) in a very large area from east to south of the center of circulation, where cloud top temperatures were as cold as or colder than minus 80 degrees Fahrenheit (minus 62.2 Celsius). Credit: NASA/NRL
Tropical cyclones are made of up hundreds of thunderstorms, and infrared data can show where the strongest storms are located. They can do that because infrared data provides temperature information, and the strongest thunderstorms that reach highest into the atmosphere have the coldest cloud top temperatures.
On Nov. 13 at 7:30 a.m. EST (1230 UTC), the Moderate Imaging Spectroradiometer or MODIS instrument that flies aboard NASA’s Terra satellite used infrared light to analyze the strength of storms within the tropical cyclone. MODIS found those strongest storms in a very large area stretching from east to south of the center of circulation. In that quadrant cloud top temperatures were as cold as or colder than minus 80 degrees Fahrenheit (minus 62.2 Celsius). NASA research has found that cloud top temperatures that cold indicate strong storms with the potential to generate heavy rainfall. Powerful thunderstorms also circled that area and the entire center of circulation and in a fragmented band extending north of center.
On Nov. 13 at 10 a.m. EST (1500 UTC) or 1 a.m. CHST local time (Guam) a typhoon watch remains in effect for Agrihan, Pagan, and Alamagan in the Commonwealth of the Northern Marianas.
At that time, the center of Tropical Storm Fengshen was located near latitude 17.0 degrees north and longitude 152.1 degrees east. That puts the center about 440 miles east-southeast of Agrihan. Fengshen is moving west at 20 mph. It is expected to make a gradual turn back toward the west-northwest with a slight decrease in forward speed over the next couple days. Maximum sustained winds remain at 50 mph. Fengshen is forecast to intensify through Friday possibly becoming a typhoon.
Hurricanes and typhoons are the most powerful weather event on Earth. NASA researches these storms to determine how they rapidly intensify, develop and behave. NASA’s expertise in space and scientific exploration contributes to essential services provided to the American people by other federal agencies, such as hurricane weather forecasting.
Nov. 12, 2019 – NASA Finds Heavy Rain in Tropical Storm Fengshen
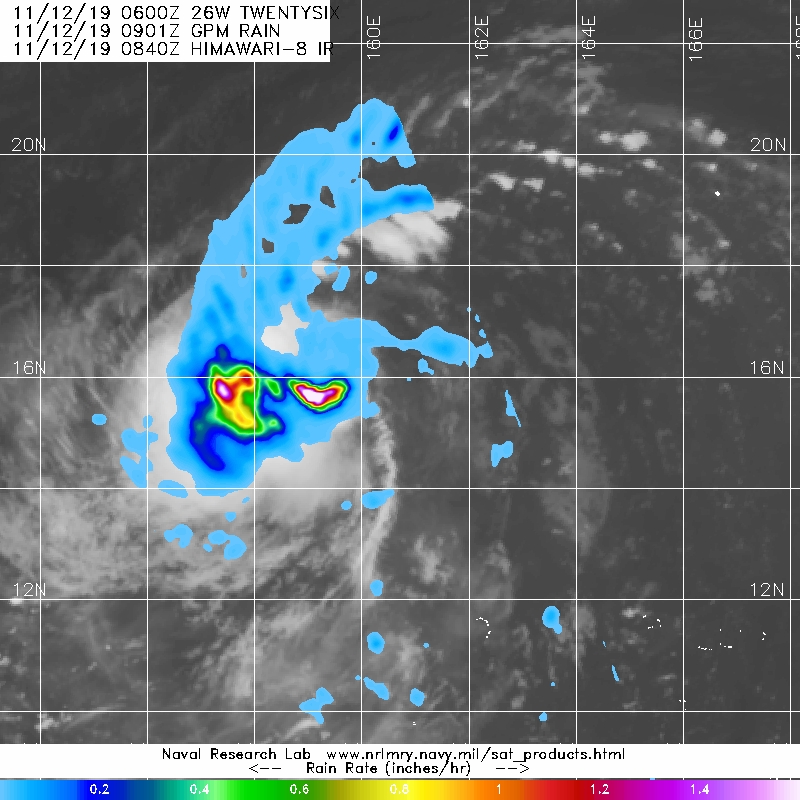
The Global Precipitation Measurement mission or GPM core satellite provided a look at the rainfall occurring within the newly developed Tropical Storm Fengshen.
GPM passed over Tropical Storm Fengshen on Nov. 12 at 3:40 a.m. EDT (0840 UTC) and found heavy rainfall in several areas exceeding 1.6 inches (40 mm) per hour. Credit: NASA/NRL
Tropical Depression 26W formed in the Northwestern Pacific Ocean on Nov. 11 and strengthened into a tropical storm. Once it strengthened it was renamed Fengshen.
GPM passed over Fengshen on Nov. 12 at 3:40 a.m. EDT (0840 UTC) and found heavy rainfall in several areas exceeding 1.6 inches (40 mm) per hour around a consolidating low-level center.
At 10 a.m. EDT (1500 UTC) on Nov. 12 (1 a.m. CHST, Nov. 13) the National Weather Service in Tiyan, Guam said the center of Tropical Storm Fengshen was located near latitude 16.3 degrees north and longitude 158.6 degrees east. Fengshen is moving west-northwest at 16 mph and is expected to maintain this general course and speed through Thursday, then turn slightly to the northwest on Friday the 15th where it is forecast to pass just north of Agrihan. Maximum sustained winds have increased to 40 mph and Fengshen is forecast to gradually intensify through Friday. Tropical storm force winds extend outward from the center up to 15 miles.
Hurricanes and typhoons are the most powerful weather event on Earth. NASA’s expertise in space and scientific exploration contributes to essential services provided to the American people by other federal agencies, such as hurricane weather forecasting.
GPM is a joint mission between NASA and the Japan Aerospace Exploration Agency, JAXA.
Halong continued to weaken and is transitioning into an extra-tropical cyclone. NASA-NOAA’s Suomi NPP satellite provided a visible image of the less organized storm.
On Nov. 8, 2019, the VIIRS instrument aboard NASA-NOAA’s Suomi NPP provided a visible image of Tropical Storm Halong in the Northwestern Pacific Ocean as it continued to weaken. Credit: NASA Worldview, Earth Observing System Data and Information System (EOSDIS) / NOAA
The Suomi NPP satellite passed over Halong in the Northwestern Pacific Ocean on Nov. 8. The Visible Infrared Imaging Radiometer Suite (VIIRS) instrument aboard Suomi NPP provided a visible image of the storm that showed it appeared elongated and had a ragged low-level circulation center.
At 10 a.m. EDT (1500 UTC) on Nov. 8, the center of Halong was located near latitude 30.0 degrees north and longitude 160.2 degrees east. Tropical storm Halong’s center was located approximately 419 nautical miles northeast of Minami Tori Shima. Halong’s maximum sustained winds had dropped to 60 knots (69 mph/111 kph). Halong was moving quickly to the east-northeast at 24 knots.
The Joint Typhoon Warning Center or JTWC said that Halong will continue to track northeastward and gradually turn east-northeastward later on Nov. 8. The JTWC noted, “The environment will become more unfavorable with increasing vertical wind shear and cooling sea surface temperatures, leading to rapid weakening. Extra-tropical transition will begin later on Nov. 8 as begins to interact with the baroclinic zone. A baroclinic zone is a region in which a temperature gradient exists on a constant pressure surface.
NASA-NOAA’s Suomi NPP satellite provided a panoramic image of 3 tropical cyclones in the northern hemisphere. Cyclone Matmo (left) in the Bay of Bengal, Northern Indian Ocean, Typhoon Nakri (center) in the South China Sea, and Tropical Storm Halong (right) in the Northwestern Pacific Ocean. Credit: NASA Worldview, Earth Observing System Data and Information System (EOSDIS)
When a storm becomes extra-tropical it means that a tropical cyclone has lost its “tropical” characteristics. NOAA’s National Hurricane Center defines “extra-tropical” as a transition that implies both poleward displacement (meaning it moves toward the north or south pole) of the cyclone and the conversion of the cyclone’s primary energy source from the release of latent heat of condensation to baroclinic (the temperature contrast between warm and cold air masses) processes. It is important to note that cyclones can become extratropical and still retain winds of hurricane or tropical storm force.
Hurricanes and typhoons are the most powerful weather event on Earth. NASA’s expertise in space and scientific exploration contributes to essential services provided to the American people by other federal agencies, such as hurricane weather forecasting.
Nov. 08, 2019 – NASA Sees Nakri Strengthen into a Typhoon
Former Tropical Storm Nakri strengthened into a Typhoon in the South China Sea on Nov. 8. NASA-NOAA’s Suomi NPP satellite passed over the region and found Nakri appeared more circular and more organized.
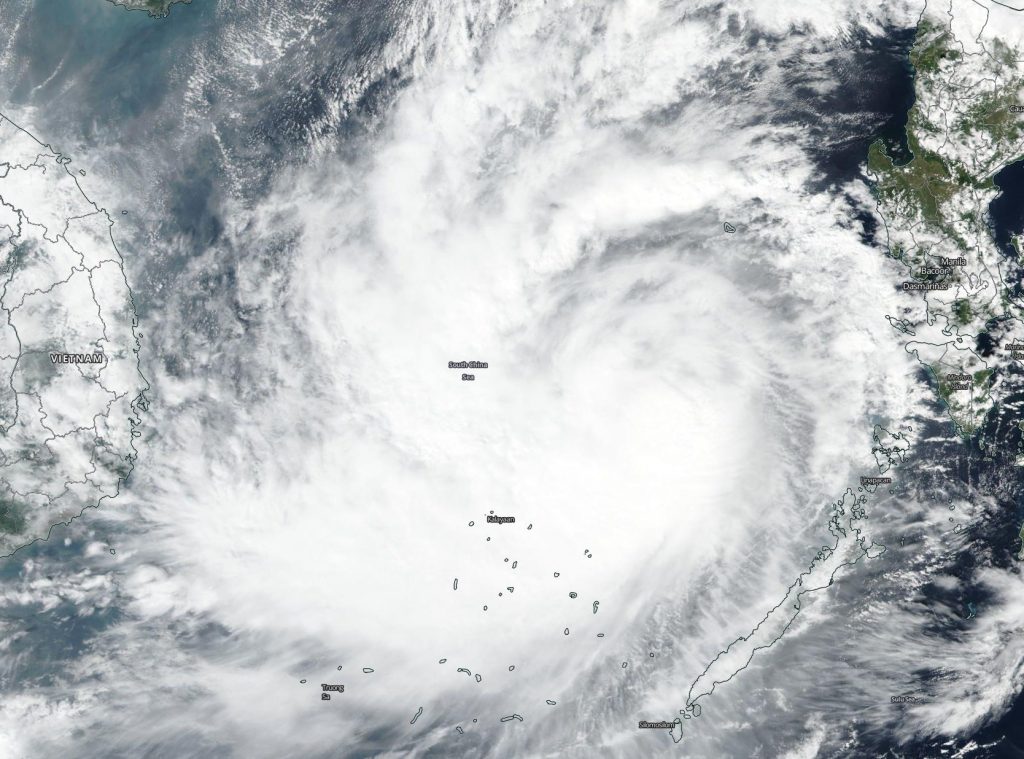
NASA-NOAA’s Suomi NPP satellite passed over Typhoon Nakri on Nov. 8 and captured a visible image of the storm in the South China Sea. Credit: NASA Worldview, Earth Observing System Data and Information System (EOSDIS)
Visible imagery from the Visible Infrared Imaging Radiometer Suite (VIIRS) instrument aboard NASA-NOAA’s Suomi NPP satellite on Nov. 8 showed Nakri appeared more circular indicating it had intensified. The imagery also showed a large band on thunderstorms west of the center and wrapping into the low-level center. The center of the storm was still west of the main Philippine Islands, and north of Palawan. However, Kalayaan was still feeling the effects of the storm.
Kalayaan is a municipality on Pagasa Island in the province of Palawan, Philippines. Kalayaan is part of the Spratly Group of Islands, west of the largest island of Palawan. Nakri is known in the Philippines as Quiel.
NASA-NOAA’s Suomi NPP satellite provided a panoramic image of 3 tropical cyclones in the northern hemisphere. Cyclone Matmo (left) in the Bay of Bengal, Northern Indian Ocean, Typhoon Nakri (center) in the South China Sea, and Tropical Storm Halong (right) in the Northwestern Pacific Ocean. Credit: NASA Worldview, Earth Observing System Data and Information System (EOSDIS)
The satellite imagery showing better organization complemented the increase in Nakri’s maximum sustained winds. Sustained winds on Nov. 7 were near 60 knots (69 mph/111 kph). On Nov. 8 at 10 a.m. EST (1500 UTC), Nakri’s maximum sustained winds had increased to near 65 knots (75 mph/120 kph). The intensity is expected to remain relatively steady in the near-term. Nakri was located near latitude 12.7 degrees north and longitdue 116.1 degrees east, about 291 nautical miles west-southwest of Manila, Philippines. Nakri is moving slowly to the west.
Vietnam’s National Center for Hydro-Meteorological Forecasting issued a Typhoon Warning for the country as Nakri approaches.
The Joint Typhoon Warning Center expects Nakri to slowly track westward and make landfall in Vietnam late on Nov. 10 or early Nov. 11, to the south of Danang.
Typhoons and hurricanes are the most powerful weather event on Earth. NASA’s expertise in space and scientific exploration contributes to essential services provided to the American people by other federal agencies, such as hurricane weather forecasting.