Uesi – Southern Pacific Ocean

Feb. 10, 2020 – NASA Examines Tropical Storm Uesi’s Heavy Rainfall

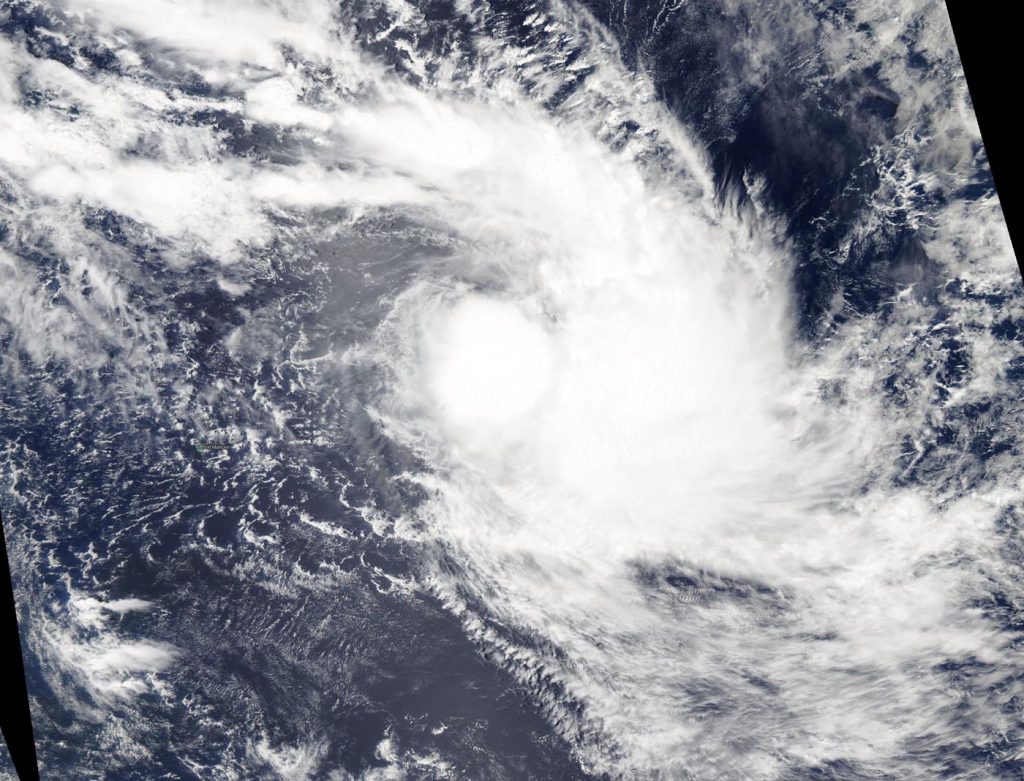
NASA analyzed Tropical Storm Uesi’s rainfall and found moderate to heavy rainfall around the storm’s center and in a large band of thunderstorms south of the center. That heavy rainfall has triggered warnings for Vanuatu in the Southern Pacific Ocean.

GPM image of Uesi
The GPM core satellite passed over the Southern Pacific Ocean and analyzed rainfall occurring in Tropical Storm Uesi on Feb. 10 at 2:31 a.m. EST (0731 UTC). Heaviest rainfall (red) around the center falling at a rate of 1.2 inches (30 mm) per hour. In a large band of thunderstorms south of the center, rainfall occurring at a rate of 1 inch (25 mm) per hour (orange). Light rain (blue) was found throughout the rest of the storm. Credit: NASA/JAXA/NRL

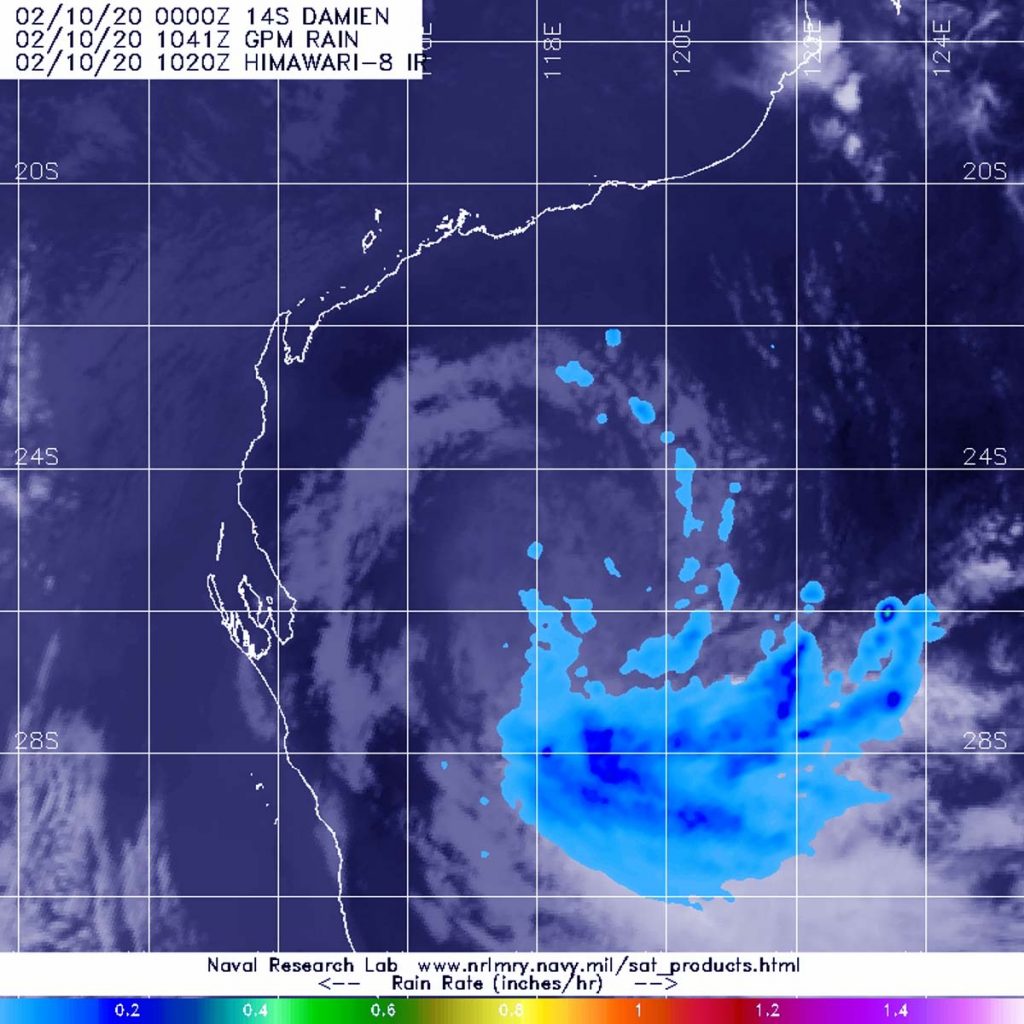
NASA has the unique capability of peering under the clouds in storms and measuring the rate in which rain is falling. The Global Precipitation Measurement mission or GPM core passed over Uesi from its orbit in space and measured rainfall rates throughout the storm on Feb. 10 at 2:31 a.m. EST (0731 UTC).

The heaviest rainfall around the center was falling at a rate of 1.2 inches (30 mm) per hour. In a large band of thunderstorms south of the center, rainfall occurring at a rate of 1 inch (25 mm) per hour. Light rain was occurring throughout the rest of the storm.

On Feb. 10, the Vanuatu Meteorology and Geo-Hazards Department (VMGD), in Port Vila issued an update on Uesi.  At 7 a.m. EST (11 p.m. Vanuatu local time), Tropical Cyclone Uesi was located at latitude 17.6 degrees south and longitude 162.4 east, about 348 miles (560 km) west southwest of Malekula. Winds close to the center of the system were estimated near 55 mph (90 kph/50 knots) and Uesi was moving in a southwest direction.

VMGD’s latest update said, “Rainfalls will be heavy with flash flood over low lying areas and areas close to river banks, including coastal flooding expected about the islands of the northern and parts of the central provinces. The marine strong wind warning is in effect for all Vanuatu coastal waters, while High seas warning is current for the central waters. Very rough to phenomenal seas and heavy to phenomenal swells expected to continue to affect the western parts of the northern and central waters tonight and tomorrow and extending to southern waters thereafter. People, including sea going vessels are strongly advised not to go out to sea until the system has moved out of the area.”

The National Disaster Management Office (NDMO) posted a Blue Alert for the SHEFA and TAFEA provinces.

For updates from VMGD’s website: www.vmgd.gov.vu and VMGD’s Facebook page: www.facebook.com/vmgd.gov.vu.

Tropical cyclones/hurricanes are the most powerful weather events on Earth. NASA’s expertise in space and scientific exploration contributes to essential services provided to the American people by other federal agencies, such as hurricane weather forecasting.

Both the Japan Aerospace Exploration Agency, JAXA and NASA manage GPM.

By Rob Gutro
NASA’s Goddard Space Flight Center

Damien – Southern Indian Ocean

Feb. 10, 2020 – NASA Analyzes Ex-Tropical Cyclone Damien’s Rainfall in Western Australia

Tropical Cyclone Damien made landfall on Feb. 9 along the northern Pilbara coast of Western Australia. On Feb. 10, the GPM or Global Precipitation Measurement mission core satellite analyzed the rainfall generated by the remnants that triggered warnings.

GPM image of Damien
On Feb. 10 at 5:41 a.m. EST (1041 UTC), GPM passed over Western Australia and measured the rate of rainfall from Damien’s remnants. GPM showed heaviest rainfall occurring south of the center and falling at a rate of at least 5 mm/0.2 inches (dark blue) per hour. Credit: NASA/JAXA/NRL

As Damien was making landfall around 1:15 a.m. EST (0615 UTC) on Feb. 9, the MODIS instrument aboard NASA’s Aqua satellite captured a visible image of the storm. The MODIS image showed the recently developed eye on the coastline. By 11 a.m. EST, Damien’s center had moved inland into Western Australia. Tropical Cyclone Damien has weakened to a Category 2 system, according to the Australian Bureau of Meteorology (ABM).

On Feb. 10 at 5:41 a.m. EST (1041 UTC), GPM passed over Western Australia and measured the rate of rainfall from Damien’s remnants. GPM showed heaviest rainfall occurring south of the center and falling at a rate of at least 0.2 inches (5 mm) per hour.

Aqua image of Damien
As Damien was making landfall around 1:15 a.m. EST (0615 UTC) on Feb. 9, the MODIS instrument aboard NASA’s Aqua satellite captured a visible image of the storm. The MODIS image showed the recently developed eye on the coastline. Credit: NASA/NRL

The Australian Bureau of Meteorology posted an update at 3 a.m. EST (4 p.m. AWST), Feb. 10, and noted Ex-Tropical Cyclone Damien was located over the northeast Gascoyne, about 62 miles (100 kilometers) north northeast of Meekatharra, moving towards the south.

ABM said, “Ex-Tropical Cyclone Damien is expected to carry with it an area of heavy rainfall as it moves south southeast through the southeastern Gascoyne and the adjacent Goldfields.” That heavy rainfall that may lead to flash flooding.

ABM’s update noted, “Heavy rainfall is forecast over the southeastern Gascoyne and adjacent Goldfields, this area will gradually move south overnight Monday (Feb. 10). Strong and squally winds are also possible. Locations which may be affected include Mount Magnet, Cue, Leinster and Sandstone.”

Since 9 a.m. AWST Monday (8 p.m. EST on Sunday, Feb 9) the following rainfall amounts have been observed: Wiluna Airport 40 mm (1.57 inches) and at Meekatharra 29.8 (1.17 inches).

For updated warnings, visit: http://www.bom.gov.au/wa/warnings/

By Rob Gutro
NASA’s Goddard Space Flight Center

Damien – Southern Indian Ocean

Feb. 07, 2020 -NASA Analyzes Tropical Cyclone Damien’s Water Vapor Concentration

When NASA’s Aqua satellite passed over the Southern Indian Ocean on Feb. 7, it gathered water vapor data that provided information about the intensity of Tropical Cyclone Damien.

Aqua image of Damien
On Feb. 7 at 12:25 a.m. EST (1725 UTC), NASA’s Aqua satellite passed over Tropical Cyclone Damien, located in the Southern Indian Ocean and off Australia’s Pilbara coast. Aqua found highest concentrations of water vapor (brown) and coldest cloud top temperatures were around the center. Credits: NASA/NRL

On Feb. 7 at 12:25 a.m. EST (1725 UTC), NASA’s Aqua satellite passed over Tropical Cyclone Damien, located in the Southern Indian Ocean and off Australia’s Pilbara coast. Aqua found highest concentrations of water vapor (brown) and coldest cloud top temperatures were around the center. Credits: NASA/NRLThe Australian Bureau of Meteorology (ABM) issued warnings and watches as Tropical Cyclone Damien moves toward the Pilbara Coast of Western Australia.

On Friday, February 7 at 11:46 pm WST (10:46 a.m. EST), the Warning Zone extends from Pardoo to Onslow, including Port Hedland, Karratha, Dampier, Pannawonica and Barrow Island and extending to adjacent inland parts to include Marble Bar, Tom Price and Paraburdoo. The Watch Zone includes inland central Pilbara including Nullagine, Newman and Mt Augustus.

ABM forecasters expect Severe Tropical Cyclone Damien to cause gales on the Pilbara coast from early Saturday morning. Very Destructive winds, very heavy rainfall and a storm surge are expected as Damien crosses the coast during Saturday, Feb. 8.

NASA’s Aqua satellite passed over Tropical Cyclone Damien on Feb. 7 at 12:25 a.m. EST (1725 UTC) and the Moderate Resolution Imaging Spectroradiometer or MODIS instrument gathered water vapor content and temperature information. The MODIS image showed highest concentrations of water vapor and coldest cloud top temperatures were around the center of circulation.

MODIS data also showed coldest cloud top temperatures were as cold as or colder than minus 70 degrees Fahrenheit (minus 56.6 degrees Celsius) in those storms. Storms with cloud top temperatures that cold have the capability to produce heavy rainfall.

Water vapor analysis of tropical cyclones tells forecasters how much potential a storm has to develop. Water vapor releases latent heat as it condenses into liquid. That liquid becomes clouds and thunderstorms that make up a tropical cyclone. Temperature is important when trying to understand how strong storms can be. The higher the cloud tops, the colder and the stronger the storms.

On February 7 at 11:46 pm WST (10:46 a.m. EST), ABM reported that Damien was a Category 3 storm with maximum sustained winds near the center of 140 kilometers (87 miles) per hour with higher wind gusts. Damien was located near latitude 18.9 degrees south and longitude 16.7 degrees east, about 205 kilometers (127 miles) north of Karratha and 255 kilometers (158 miles) northwest of Port Hedland. Damien is moving to the south-southwest.

Forecasters at the ABM reported on Feb. 7, “Severe Tropical Cyclone Damien (Category 3) is expected to intensify as it moves towards the Pilbara coast. Damien is likely to cross the coast between Whim Creek and Mardie during Saturday as a Category 4 system. Later on Saturday or Sunday, Damien will move inland and weaken.”

For the Australian Bureau of Meteorology Weather video update on Feb. 7, visit: https://youtu.be/TgO9v0mYiCM

NASA’s Aqua satellite is one in a fleet of NASA satellites that provide data for hurricane research.

Tropical cyclones/hurricanes are the most powerful weather events on Earth. NASA’s expertise in space and scientific exploration contributes to essential services provided to the American people by other federal agencies, such as hurricane weather forecasting.

For updated forecasts from the ABM, visit: http://www.bom.gov.au/cyclone/index.shtml

By Rob Gutro
NASA’s Goddard Space Flight Center

Damien – Southern Indian Ocean

Feb. 06, 2020 – NASA Sees Tropical Storm Damien Form off Australia’s Pilbara Coast

The low-pressure area that formed off Australia’s Kimberley coast and lingered there for a couple of days has moved west and developed into Tropical Cyclone Damien off the Pilbara coastline. NASA’s Terra satellite passed over the Southern Indian Ocean and provided forecasters with a visible image of the new tropical storm.  The Pilbara Coast is also known as the northwest coast of Western Australia.

Aqua image of Damien
On Feb. 6, 2020, the MODIS instrument that flies aboard NASA’s Terra satellite provided a visible image of newly developed Tropical Storm Damien off Western Australia’s Pilbara coast. Credit: NASA Worldview

On Feb. 6, the Moderate Resolution Imaging Spectroradiometer or MODIS instrument that flies aboard NASA’s Terra satellite provided a visible image of Damien that showed the storm had a more rounded shape than it did the previous day as it continued to consolidate. A more rounded shape of a tropical cyclone indicates it is becoming a more organized storm. Satellite imagery revealed a small central dense overcast with rain bands wrapping in towards the low-level circulation center.

The Australian Bureau of Meteorology (ABM) issued warnings and watches for Damien on Feb. 6. The Warning Zone includes Wallal Downs to Mardie, including Port Hedland, Karratha and Dampier. The Watch Zone extends from Mardie to Onslow, and the inland central Pilbara including Tom Price, Paraburdoo, Marble Bar and Nullagine. A Blue Alert is in effect for residents in or near Wallal Downs to Port Hedland and Mardie to Onslow but not including Onslow, (including the towns of Pannawonica, Tom Price, Paraburdoo, Nullagine and Marble Bar). A Yellow Alert is in effect for residents in or near Port Hedland to Mardie and south to Millstream (including the Town of Port Hedland, Whim Creek, Point Samson, Wickham, Roebourne, Karratha and Dampier).

At 11:00 p.m. AWST (10 a.m. EST) on Feb. 6, the ABM said Tropical Cyclone Damien had maximum sustained winds near 75 kilometers per hour (40 knots/47 mph) with higher gusts. It was located near latitude 17.5 degrees south and longitude 118.1 degrees east, about 315 kilometers (196 miles) north of Port Hedland and 385 kilometers (239 miles) north-northeast of Karratha. Damien is moving to the west-southwest at 20 kilometers (12 miles) per hour.

The tropical cyclone is expected to continue to intensify as it tracks to the west southwest. Damien is expected to turn south towards the Pilbara coast during Friday, Feb 7. ABM cautioned that, “Severe tropical cyclone impact is forecast for the Pilbara coast during Saturday, Feb. 8.”

NASA’s Terra satellite is one in a fleet of NASA satellites that provide data for hurricane research.

Tropical cyclones/hurricanes are the most powerful weather events on Earth. NASA’s expertise in space and scientific exploration contributes to essential services provided to the American people by other federal agencies, such as hurricane weather forecasting.

For updated forecasts from ABM, visit: http://www.bom.gov.au/products/IDW60281.shtml

By Rob Gutro
NASA’s Goddard Space Flight Center

Francisco – Southern Indian Ocean

Feb. 06, 2020 – NASA Satellite Finds Wind Shear Adversely Affecting Tropical Storm Francisco

Forecasters use a variety of satellite imagery to understand what is happening in a storm, and sometimes just a visible picture can tell a lot. NASA-NOAA’s Suomi NPP satellite provided forecasters with a visible image of the Tropical Storm Francisco in the Southern Indian Ocean that showed wind shear was pushing clouds away from the storm’s center.

Suomi NPP image of Francisco
NASA-NOAA’s Suomi NPP satellite passed over Tropical Storm Francisco on Feb. 6, 2020 and revealed wind shear was pushing the bulk of its clouds to the southeast of its center. Credit: NASA Worldview, Earth Observing System Data and Information System (EOSDIS)

Visible imagery from satellites helps forecasters understand if a storm is organizing or weakening, or if it is being affected by vertical wind shear. The shape of a tropical cyclone provides forecasters with an idea of its organization and strength. When outside winds, that is, vertical wind shear, batter a storm it can change the shape of it and push much of the associated clouds and rains to one side of it.

In general, wind shear is a measure of how the speed and direction of winds change with altitude. Tropical cyclones are like rotating cylinders of winds. Each level needs to be stacked on top each other vertically in order for the storm to maintain strength or intensify. Wind shear occurs when winds at different levels of the atmosphere push against the rotating cylinder of winds, weakening the rotation by pushing it apart at different levels.

The Visible Infrared Imaging Radiometer Suite (VIIRS) instrument aboard Suomi NPP provided a visible image of Francisco on Feb. 6. The image showed vertical wind shear is displacing the deep convection about 125 nautical miles to the southeast. In addition, multispectral satellite imagery revealed that the low-level circulation center appeared elongated. When the circulation is not circular and appears elongated, it cannot spin as quickly, just like a tire. Thus, the storm weakens. Wind shear is causing the elongation and weakening the storm.

At 4 a.m. EDT (0900 UTC), the Joint Typhoon Warning Center (JTWC) issued their final advisory on Tropical Cyclone Francisco. At that time, Francisco was located near latitude 19.1 degrees south and longitude 71.7 degrees east, about 816 nautical miles east of Port Louis, Mauritius and moving southeast. Maximum sustained winds were near 35 knots (40 mph/65 kph) and weakening.

The JTWC expects Francisco will continue moving to the southeast until it dissipates.

Tropical cyclones/hurricanes are the most powerful weather events on Earth. NASA’s expertise in space and scientific exploration contributes to essential services provided to the American people by other federal agencies, such as hurricane weather forecasting.

By Rob Gutro 
NASA’s Goddard Space Flight Center

Francisco – Southern Indian Ocean

Feb. 05, 2020 – NASA Satellite Observes Tropical Storm Francisco’s Formation

Shortly after Tropical Cyclone Francisco formed on Feb. 5 in the Southern Indian Ocean, NASA’s Aqua satellite provided a visible image of the storm.

Aqua image of Francisco
On Feb. 5, 2020, the MODIS instrument that flies aboard NASA’s Aqua satellite provided a visible image of Tropical Storm Francisco after it formed in the Southern Indian Ocean. Credit: NASA Worldview

On Feb. 5, 2020, the Moderate Resolution Imaging Spectroradiometer or MODIS instrument that flies aboard NASA’s Aqua satellite provided a visible image of Francisco that showed powerful thunderstorms around the low-level center. Satellite imagery showed shallow thunderstorm banding wrapping into the center of the low-level center and strong convective bands of thunderstorms over the eastern semicircle.

On Feb. 5 at 4 a.m. EST (0900 UTC), the Joint Typhoon Warning Center (JTWC) noted that Tropical Cyclone Francisco was located near latitude 17.3 degrees south and longitude 68.5 degrees east, about 647 nautical miles east-southeast of Mauritius. Maximum sustained winds 40 knots (46 mph/74 kph). This storm is moving to the southeastward.

Francisco is forecast to slightly intensify today, Feb. 5. The JTWC expects Francisco will continue to track southeast to south over the next day and a half and turn to the west-southwest after which time it is expected to begin weakening.

NASA’s Aqua satellite is one in a fleet of NASA satellites that provide data for hurricane research.

Tropical cyclones/hurricanes are the most powerful weather events on Earth. NASA’s expertise in space and scientific exploration contributes to essential services provided to the American people by other federal agencies, such as hurricane weather forecasting.

By Rob Gutro
NASA’s Goddard Space Flight Center