May 28, 2020 – NASA Looks at Inland Rainfall from Post Tropical Cyclone Bertha
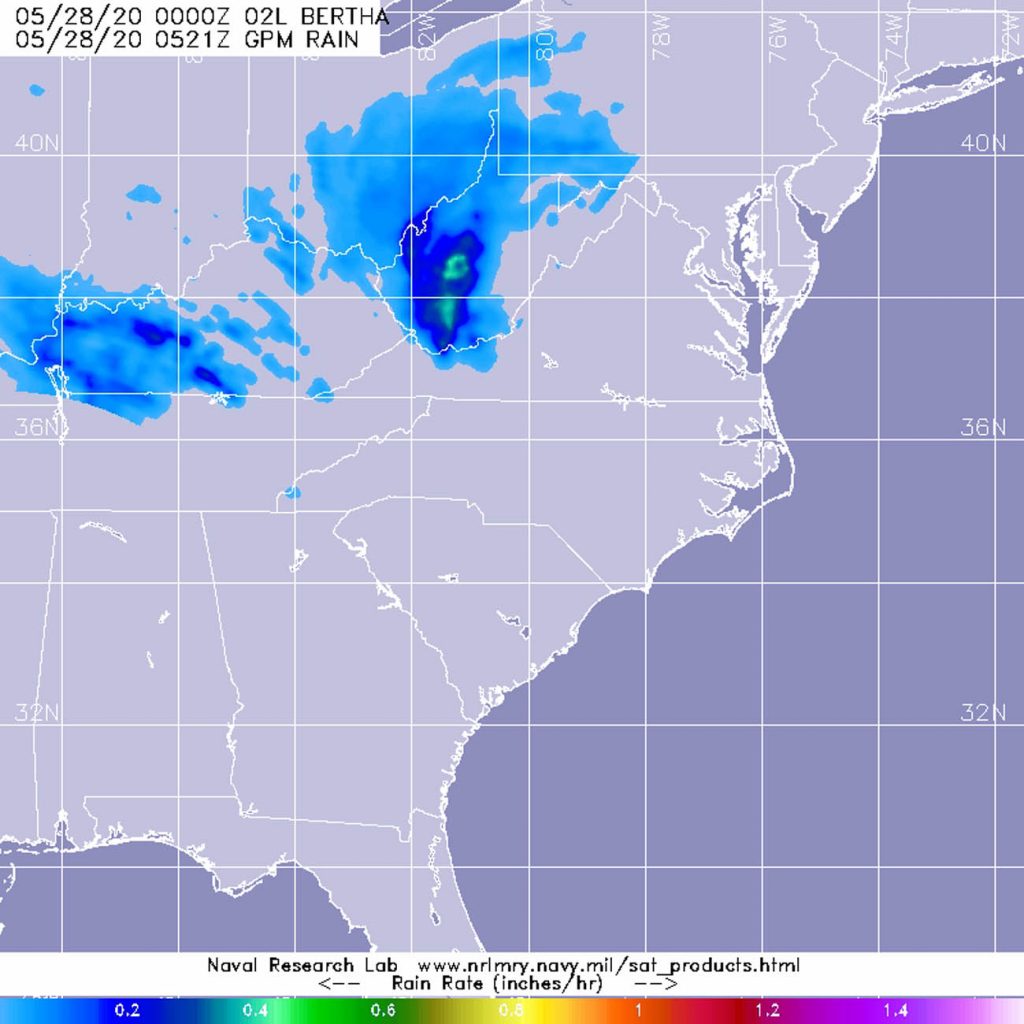
NASA’s GPM core satellite analyzed rainfall generated from post-tropical cyclone Bertha as it continues to move toward the Great Lakes.

Bertha formed into a tropical storm on May 27, about 30 miles off the South Carolina coast. By 9:30 a.m. EDT, Bertha made landfall along the coast of South Carolina, east of Charleston. Data from NOAA and CORMP buoys showed that maximum sustained winds increased to near 50 mph (80 kph) before landfall. By 2 p.m. EDT, Bertha weakened to a tropical depression and heavy rainfall spread across the Carolinas. By 11 p.m. EDT, heavy rainfall spread across western North Carolina and southwest Virginia into West Virginia. At that time, the center of Bertha was located about 95 miles (150 km) south-southwest of Roanoke, Virginia. By May 28, Bertha had become a post-tropical cyclone.
A Post-Tropical Storm is a generic term for a former tropical cyclone that no longer possesses sufficient tropical characteristics to be considered a tropical cyclone. Former tropical cyclones that have become fully extratropical, subtropical, or remnant lows, are three classes of post-tropical cyclones. In any case, they no longer possess sufficient tropical characteristics to be considered a tropical cyclone. However, post-tropical cyclones can continue carrying heavy rains and high winds.
On May 28, flash flood watches were in effect for central West Virginia and a small part of coastal North Carolina through early morning. NOAA’s National Weather Service Weather Prediction Center in College Park Md. noted, “Bertha is expected to produce total rain accumulations of around one inch from West Virginia through eastern Ohio, southern and western Pennsylvania and far western New York, and 1 to 2 inches from South Carolina across eastern North Carolina into southeast Virginia. Isolated maximum storm total amounts of 4 inches are possible in southern Pennsylvania and parts of the Carolinas and southeast Virginia. This rainfall may produce life threatening flash flooding, aggravate and prolong ongoing river flooding, and produce rapid out of bank rises on smaller rivers.”
The Global Precipitation Measurement mission or GPM satellite provided a look at Bertha’s rainfall rates on May 28 at 1:21 a.m. EDT (0521UTC). GPM found heaviest rainfall over south central West Virginia, where rain was falling at rates of 1 inch (25 mm) per hour. A large area of light rain northwest of the center was falling at around 0.2 inches (less than 5 millimeters) per hour.
At 5 a.m. EDT (0900 UTC), the center of Post-Tropical Cyclone Bertha was located near latitude 38.3 degrees north and longitude 80.8 degrees west, about 80 miles (130 km) north-northwest of Roanoke, Virginia. The post-tropical cyclone is moving toward the north near 28 mph (44 kph) and this motion is expected to continue through midday Thursday, May 28, followed by a turn to the north-northeast. Maximum sustained winds are near 25 mph (35 kph) with higher gusts. The estimated minimum central pressure is 1012 millibars.
Bertha is expected to weaken and dissipate by Thursday evening as it crosses the eastern Great Lakes.
Tropical cyclones/hurricanes are the most powerful weather events on Earth. NASA’s expertise in space and scientific exploration contributes to essential services provided to the American people by other federal agencies, such as hurricane weather forecasting.
GPM is a joint mission between NASA and the Japan Aerospace Exploration Agency, JAXA.
By Rob Gutro
NASA’s Goddard Space Flight Center
May 28, 2020 – Four Views of Tropical Storm Bertha Data from NASA’s GPM Core Satellite

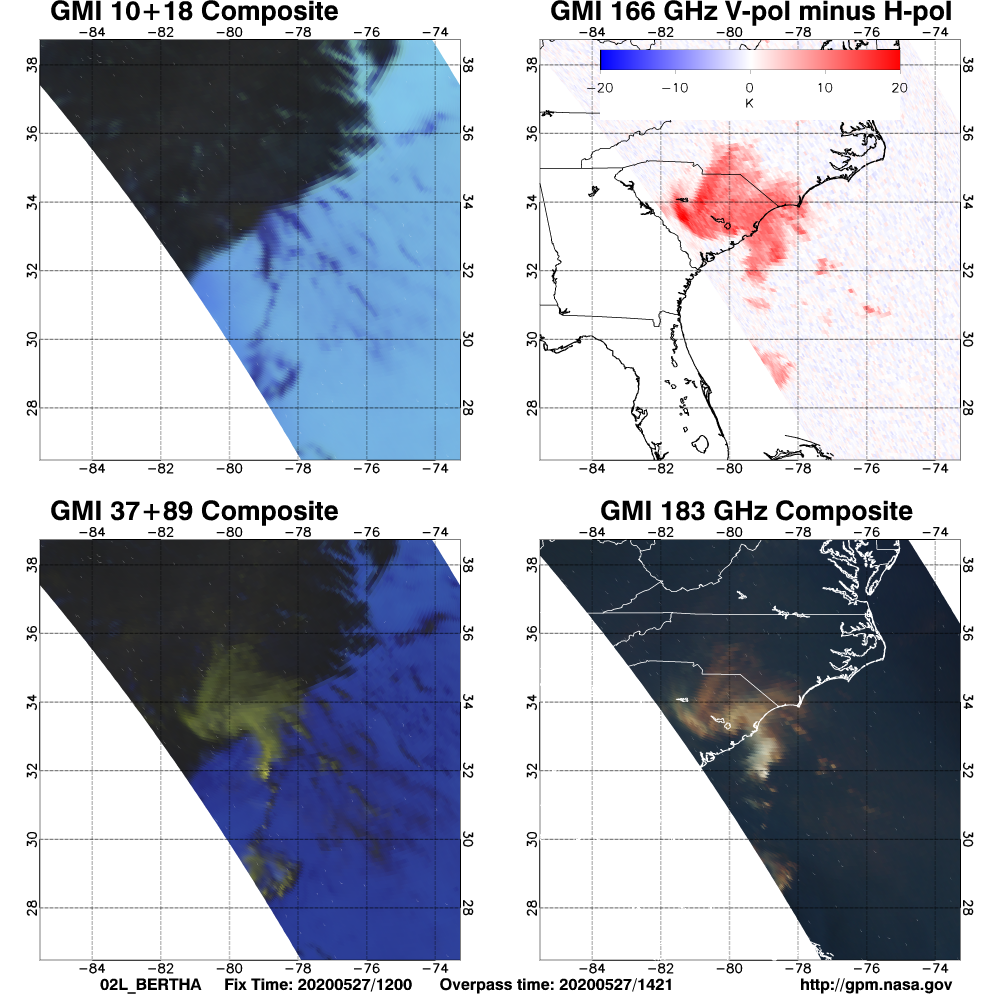
The Global Precipitation Measurement Mission or GPM core satellite provides a look at precipitation around the world. GPM works with a constellation of other satellites to provide a global picture of precipitation and storms. In this collage of data gathered on Tropical Storm Bertha, there are four different views of data from GPM. The GPM core satellite passed over the southeastern coast of the U.S. on May 27 at 8 a.m. EDT (1200 UTC) and captured data on Tropical Storm Bertha as it was nearing landfall in South Carolina. These four images provided different insight to forecasters about the storm.
The Global Precipitation Measurement (GPM) Microwave Imager (GMI) instrument is a multi-channel, conical- scanning, microwave radiometer– an essential role in near-global-coverage. The upper left panel is the low frequency (10 and 18 GHz) composite from GMI. “These channels are excellent at detecting liquid precipitation over ocean and show the rain band impinging on the North Carolina/South Carolina coast,” said S. Joseph Munchak, Research Meteorologist and GPM Deputy Project Scientist for Ground Validation at NASA’s Goddard Space Flight Center in Greenbelt, Md. “But due to the high emissivity from soil and vegetation over land, they are less useful [over land areas].”
The lower left image is a composite from the 37 and 89 GHz channels. In addition to detecting liquid precipitation over the ocean, these higher frequencies are excellent for capturing ice-phase precipitation over land and water, which is depicted by the light gray colors, and show the curved storm structure quite well.
The lower right comes from the highest frequencies on GMI, which are sensitive to water vapor and ice clouds, and show a similar pattern to the ice precipitation from the 37/89 GHz channels.
The upper right image was created from a special type of data that only GMI provides – a “polarization difference” at 166 GHz. “When this difference is positive, it means that the ice in the clouds must be horizontally aligned (think of ice crystals as pancakes oriented parallel to the ground),” Munchak said. “Understanding exactly what type of ice crystals produce this signal, and how it can be used to improve precipitation estimation and modeling, is an area of ongoing research at NASA Goddard.”
For more information about GPM, visit: www.nasa.gov/gpm
By Rob Gutro / S. Joseph Munchak
NASA’s Goddard Space Flight Center
