Aug. 04, 2020 (update #1) – NASA Providing Data on Tropical Storm Isaias as it Blankets Eastern Seaboard
Tropical Storm Isaias made landfall late on Aug. 3 and by today, Aug. 4, the huge storm stretched from Virginia to Maine. NASA satellites have been providing forecasters with rainfall rates, cloud top temperatures, storm extent and strength as Isaias batters the U.S. East Coast.
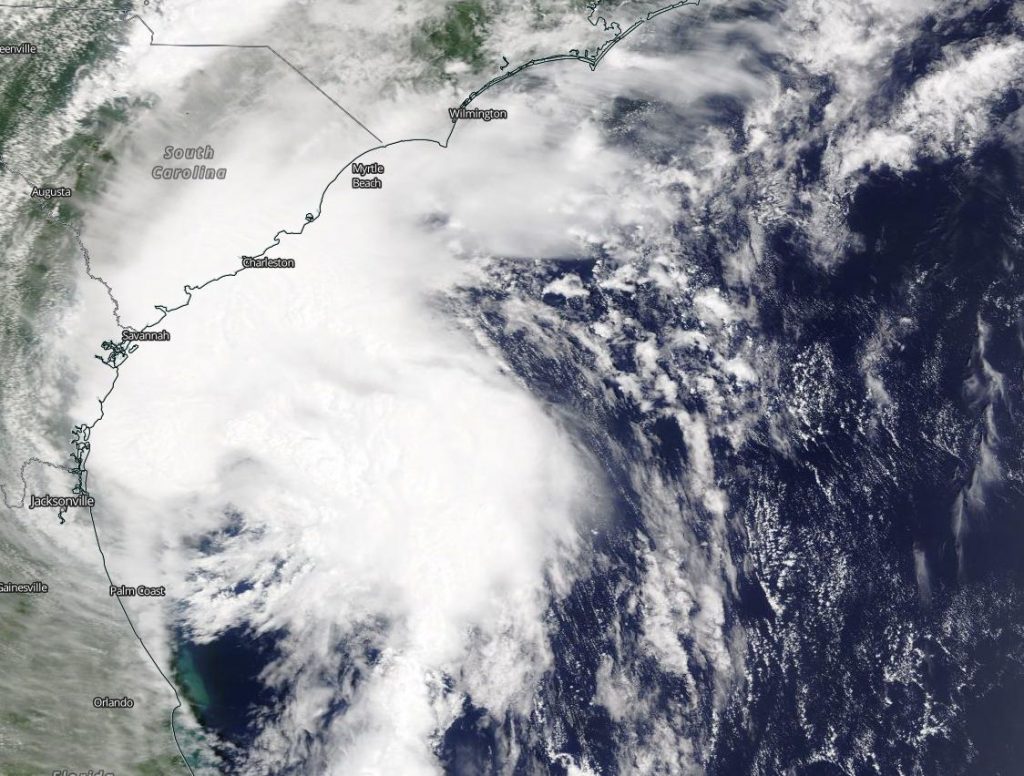
Warnings and Watches for Tuesday, August 4, 2020
NOAA’s National Hurricane Center (NHC) posted many warnings and watches on Aug. 4. Storm Surge Warning is in effect for the Pamlico and Albemarle Sounds, Ocracoke Inlet, North Carolina to the North Carolina/Virginia border.
A Tropical Storm Warning is in effect from north of Surf City, North Carolina to Eastport, Maine, for the Pamlico and Albemarle Sounds, the Chesapeake Bay, the Tidal Potomac River, Delaware Bay, Long Island and Long Island Sound, NY, Martha’s Vineyard, Nantucket, and Block Island.
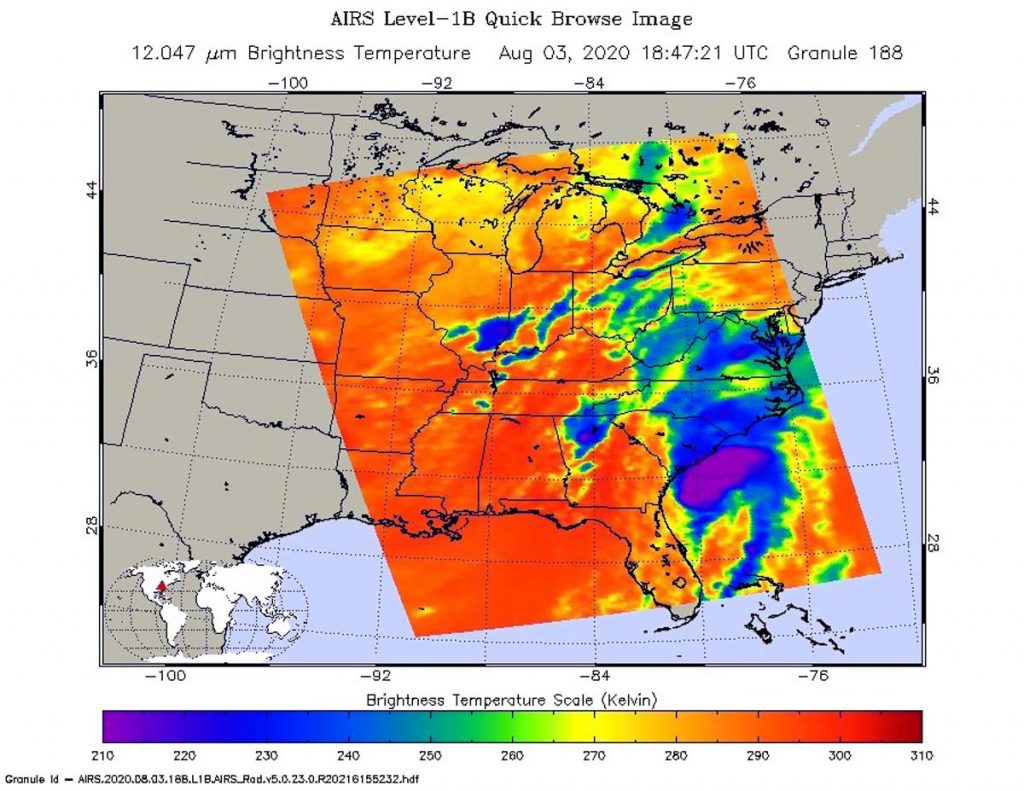
Infrared Imagery Reveals Isaias’ Rain Potential
One of the ways NASA researches tropical cyclones is using infrared data that provides temperature information. Cloud top temperatures provide information to forecasters about where the strongest storms are located within a tropical cyclone. The stronger the storms, the higher they extend into the troposphere, and the colder the cloud temperatures.
On Aug. 3 at 2:47 p.m. EDT (1847 UTC) NASA’s Aqua satellite analyzed Isaias using the Atmospheric Infrared Sounder or AIRS instrument. The infrared data showed the bulk of the storms wrapped from west to north to east of the center of circulation. AIRS found coldest cloud top temperatures as cold as or colder than minus 63 degrees Fahrenheit (minus 53 degrees Celsius). NASA research has shown that cloud top temperatures that cold indicate strong storms that have the capability to create heavy rain. That heavy rain brought flooding to areas of South and North Carolina as the storm approached for landfall.
Isaias Landfall
Doppler radar imagery and surface observations indicate that eye of Hurricane Isaias made landfall in southern North Carolina around 11:10 p.m. EDT (0310 UTC) on Monday, Aug. 3 near Ocean Isle Beach, with maximum sustained winds of 85 mph (140 kph).
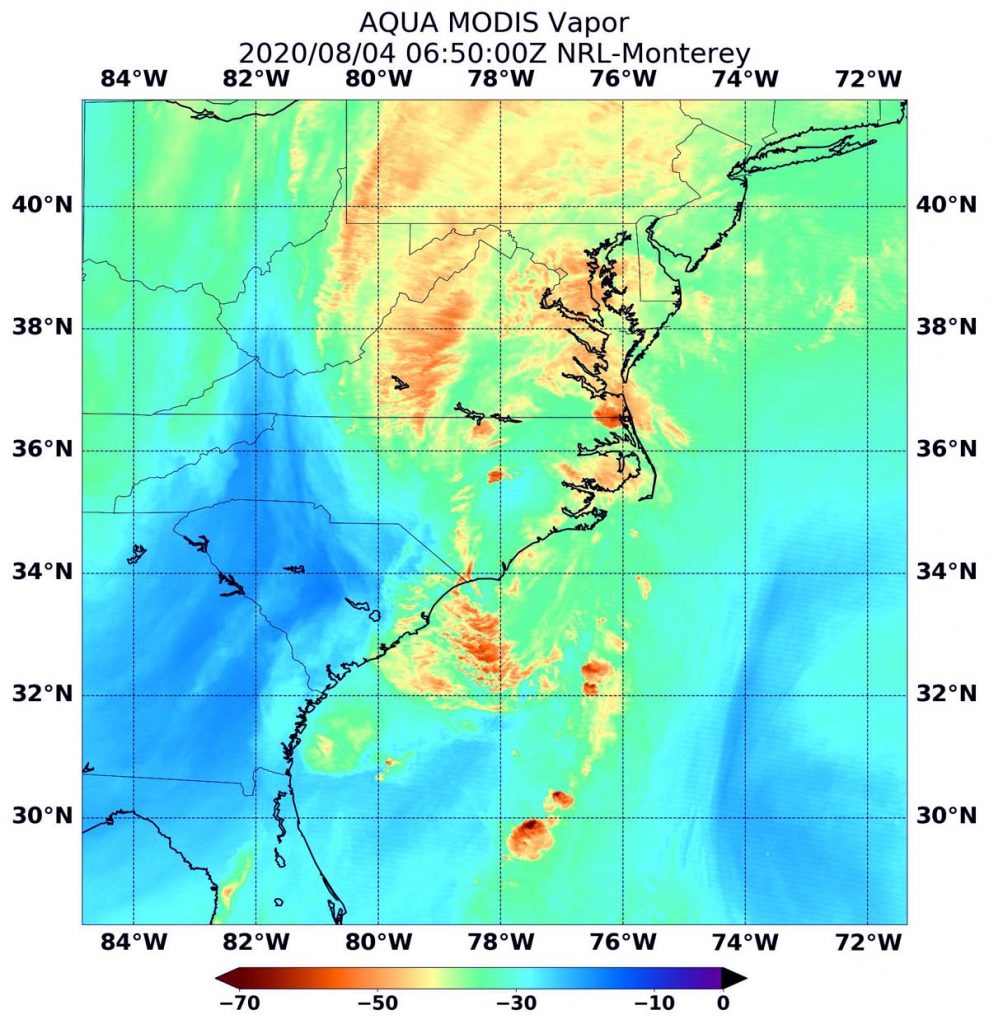
Isaias’ Water Vapor Content
The Moderate Resolution Imaging Spectroradiometer or MODIS instrument that flies aboard NASA’s Aqua satellite provided forecasters at the National Hurricane Center with water vapor imagery in Tropical Storm Isaias. NASA’s Aqua satellite passed over Isaias on Aug. 4 at 2:50 a.m. EDT (0650 UTC).
Coldest cloud top temperatures were as cold as or colder than minus 70 degrees Fahrenheit (minus 56.6 degrees Celsius) in some of the bands of thunderstorms north of Isaias’s center and were over parts of Virginia, Pennsylvania, Maryland, Delaware, and over the Atlantic Ocean. Storms with cloud top temperatures that cold have the capability to produce heavy rainfall.
Water vapor analysis of tropical cyclones tells forecasters how much potential a storm has to develop. Water vapor releases latent heat as it condenses into liquid. That liquid becomes clouds and thunderstorms that make up a tropical cyclone. Temperature is important when trying to understand how strong storms can be. The higher the cloud tops, the colder and the stronger they are.
That rainfall potential is evident in the NHC forecast for Aug. 4. The following rainfall accumulations are expected along and near the track of Isaias: central and eastern North Carolina into the Mid-Atlantic: 3 to 6 inches, isolated totals a maximum of 8 inches; eastern New York into Vermont: 2 to 4 inches, isolated maximum totals 6 inches; and western Connecticut, western Massachusetts, New Hampshire and western Maine: 1 to 3 inches.
Status of Isaias on Aug. 4
At 8 a.m. EDT (1200 UTC), the center of Tropical Storm Isaias was located over southeastern Virginia near latitude 37.7 degrees north and longitude 76.8 degrees west. That is about 15 miles (20 km) south-southeast of Tappahannock, Virginia.
Isaias is moving toward the north-northeast near 33 mph (54 kph), and this general motion accompanied by some additional increase in forward speed is expected through today. Maximum sustained winds are near 70 mph (110 kph) with higher gusts. The estimated minimum central pressure based on surface observations is 993 millibars.
In the 7 a.m. EDT hour, the National Weather Service reported sustained winds of 63 mph (101 kph) and a gust to 77 mph (124 kph) at Third Island, Virginia, at the mouth of the Chesapeake Bay.
NHC noted, “In addition to the storm surge and wind threats, Isaias is expected to produce heavy rainfall along and just west of the I-95 corridor today, and the Weather Prediction Center has placed a portion of this area in a high risk for life-threatening flash flooding. There is also a risk of tornadoes from southeast Virginia to New Jersey through midday. The risk of tornadoes will spread northward into southeastern New York this afternoon and across New England by tonight.”
NHC Forecast for Isaias
Only gradual weakening is anticipated while Isaias moves north northeastward near the mid-Atlantic coast today. A faster rate of weakening is expected to begin tonight, and the system is forecast to become post-tropical tonight or early Wednesday. On the NHC forecast track, the center of Isaias will continue to move near or along the coast of the mid-Atlantic states today, and move across the northeastern United States into southern Canada tonight.
NASA Researches Tropical Cyclones
Hurricanes/tropical cyclones are the most powerful weather events on Earth. NASA’s expertise in space and scientific exploration contributes to essential services provided to the American people by other federal agencies, such as hurricane weather forecasting.
For more than five decades, NASA has used the vantage point of space to understand and explore our home planet, improve lives and safeguard our future. NASA brings together technology, science, and unique global Earth observations to provide societal benefits and strengthen our nation. Advancing knowledge of our home planet contributes directly to America’s leadership in space and scientific exploration.
For updated forecasts, visit: www.nhc.noaa.gov
By Rob Gutro
NASA’s Goddard Space Flight Center
Aug. 04, 2020 (update #2) – NASA’s CloudSat Takes a Slice from Tropical Storm Isaias
NASA’s CloudSat passed over Tropical Storm Isaias as it was strengthening back into a hurricane on Aug. 3, and before it made landfall in North Carolina. CloudSat revealed areas of heavy rain and ice particles in high, powerful clouds.
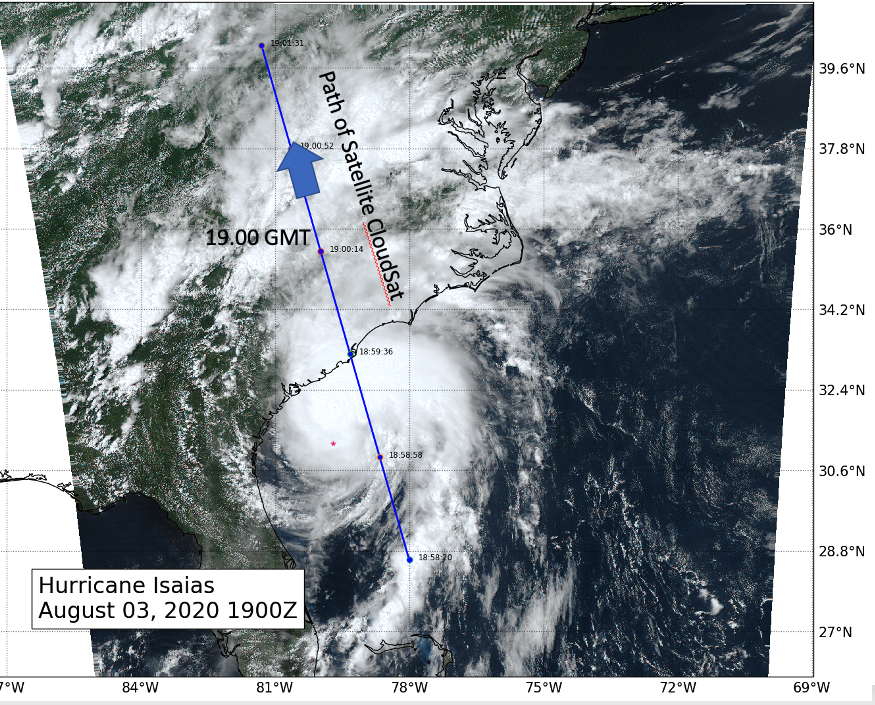
Tropical Storm Isaias was going through a period of intensification from a tropical storm into a minimal hurricane as vertical wind shear weakened around the system. Wind shear is outside winds that can affect a tropical cyclone and weaken its structure or even blow it apart, if strong enough. The wind shear that had been affecting Isaias was weakening allowing the storm to intensify back into a hurricane as it did y 8 p.m. EDT on Aug. 3.
CloudSat passed east of the storm center revealing the large area of deep convection (rising air that condenses and forms the thunderstorms that make up a tropical cyclone). “The anvil of the system extended northwestward across North and South Carolina with maximum cloud heights estimated at 16-17 km (~10 to ~11 miles),” said Natalie Tourville of the Cooperative Institute for Research in the Atmosphere, Colorado State University, Fort Collins.
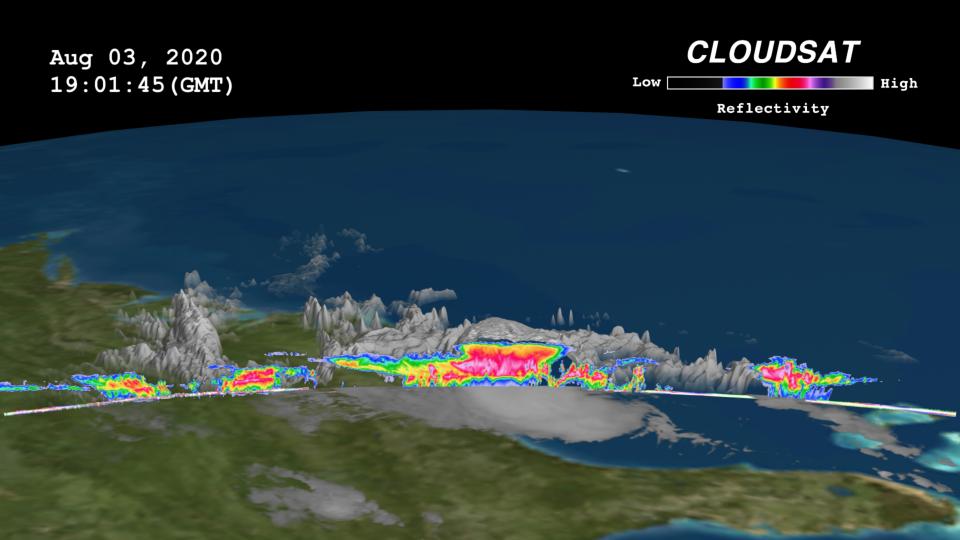
CloudSat also found areas of rain bands associated with Isaias in southeastern portion of the system. Those were smaller areas of convection over the Atlantic Ocean.
CloudSat is the first satellite to use an advanced cloud-profiling radar to “slice” through clouds to see their vertical structure, providing a completely new observational capability from space. The mission furnishes data that evaluate and improve the way clouds and precipitation are represented in global models, contributing to better predictions of clouds and their role in climate change.
For more information about NASA’s CloudSat satellite, visit: http://www.nasa.gov/CloudSat or http://CloudSat.atmos.colostate.edu
By Rob Gutro
NASA’s Goddard Space Flight Center
