Sep. 18, 2020 – NASA Confirms Development of Record-Breaking Tropical Storm Wilfred, Ending Hurricane List
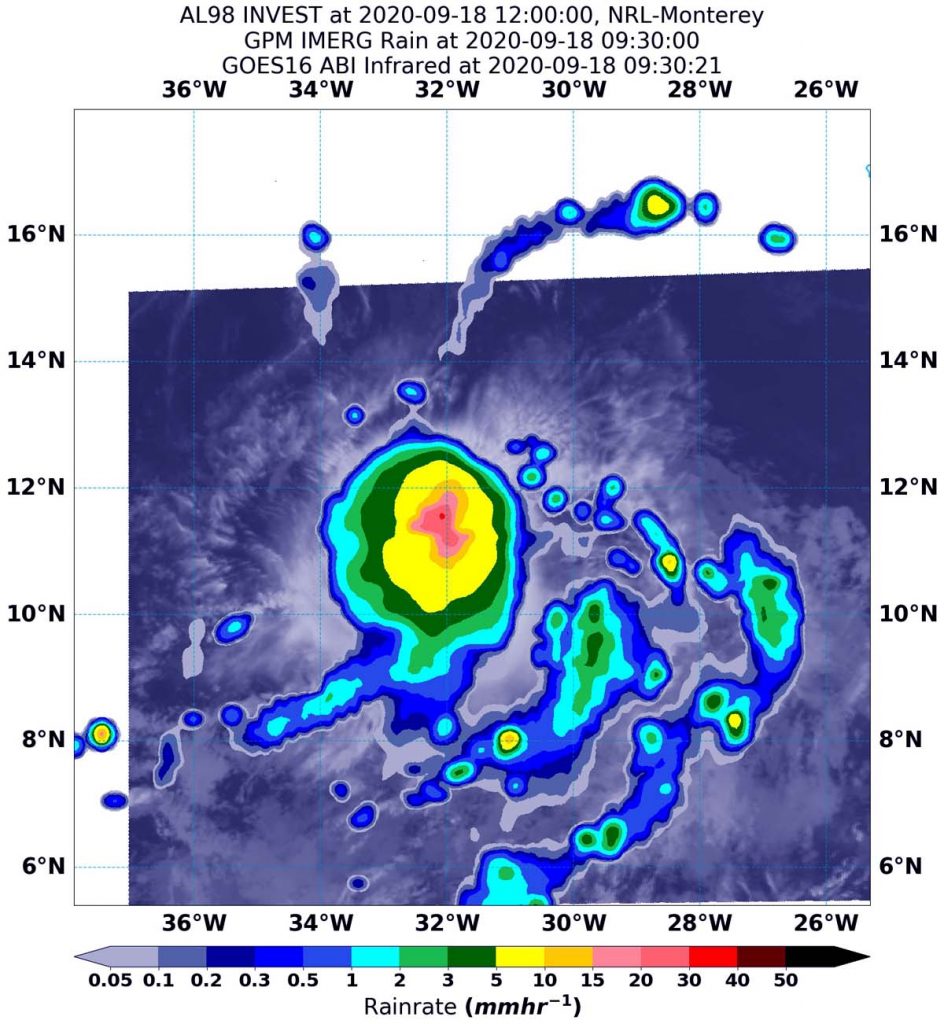
The list of hurricane names is officially used up with the development of the 23rd tropical cyclone of the year. Tropical Storm Wilfred just formed in the Eastern Atlantic Ocean today, Sept. 18. Using a NASA satellite rainfall product that incorporates data from satellites and observations, NASA estimated Wilfred’s rainfall rates.

All of the names on the 2020 official list of hurricane names for the Atlantic Ocean hurricane season have now been claimed. That means the next system that forms into a tropical storm will get a name from the Greek Alphabet. This only happened once in Atlantic hurricane history, back in 2005. If Tropical Depression 22, located in the Gulf of Mexico, becomes a tropical storm it would be named Alpha.
Eric Blake, Senior Hurricane Specialist at NOAA’s National Hurricane Center in Miami, Fla. noted, “Wilfred has formed, continuing the record-setting pace of the 2020 hurricane season since it is the earliest 21st named storm on record, about 3 weeks earlier than Vince of 2005.”
Wilfred’s Status on Sept. 18
At 11 a.m. EDT (1500 UTC), the center of Tropical Storm Wilfred was located near latitude 11.9 degrees north and longitude 32.4 degrees west. That is 630 miles (1,105 km) west-southwest of the Cabo Verde Islands. Wilfred is moving toward the west-northwest near 17 mph (28 kph) and this general motion is expected for the next few days.
Maximum sustained winds are near 40 mph (65 km/h) with higher gusts. Some slight strengthening is possible today, and weakening should start this weekend and continue into next week. The estimated minimum central pressure is 1008 millibars.
Estimating Wilfred’s Rainfall Rates from Space
NASA’s Integrated Multi-satellitE Retrievals for GPM or IMERG, which is a NASA satellite rainfall product, estimated on Sept. 18 at 5:30 a.m. EDT (0930 UTC), Wilfred was generating as much as 30 mm (1.18 inches) of rain per hour around the center of circulation.
Rainfall throughout most of the storm and in fragmented bands of thunderstorms to the southeast of the center was estimated as falling at a rate between 5 and 15 mm (0.2 to 0.6 inches) per hour. At the U.S. Naval Laboratory in Washington, D.C., the IMERG rainfall data was overlaid on infrared imagery from NOAA’s GOES-16 satellite to provide a full extent of the storm.
What Does IMERG Do?
This near-real time rainfall estimate comes from the NASA’s IMERG, which combines observations from a fleet of satellites, in near-real time, to provide near-global estimates of precipitation every 30 minutes. By combining NASA precipitation estimates with other data sources, we can gain a greater understanding of major storms that affect our planet.
What the IMERG does is “morph” high-quality satellite observations along the direction of the steering winds to deliver information about rain at times and places where such satellite overflights did not occur. Information morphing is particularly important over the majority of the world’s surface that lacks ground-radar coverage. Basically, IMERG fills in the blanks between weather observation stations.
NASA Researches Tropical Cyclones
Hurricanes/tropical cyclones are the most powerful weather events on Earth. NASA’s expertise in space and scientific exploration contributes to essential services provided to the American people by other federal agencies, such as hurricane weather forecasting.
For more than five decades, NASA has used the vantage point of space to understand and explore our home planet, improve lives and safeguard our future. NASA brings together technology, science, and unique global Earth observations to provide societal benefits and strengthen our nation. Advancing knowledge of our home planet contributes directly to America’s leadership in space and scientific exploration.
For more information about NASA’s IMERG, visit: https://pmm.nasa.gov/gpm/imerg-global-image
For forecast updates on hurricanes, visit: www.hurricanes.gov
By Rob Gutro
NASA’s Goddard Space Flight Center
