June 28, 2019 – NASA Satellite Takes Tropical Storm Alvin’s Temperature
Cloud top temperatures are an indication of strength of tropical cyclones. The colder the cloud tops, the higher they extend in the troposphere, and colder temperatures typically indicate stronger storms. NASA’s Aqua satellite peered into Tropical Storm Alvin with infrared light to determine if the storm was intensifying.

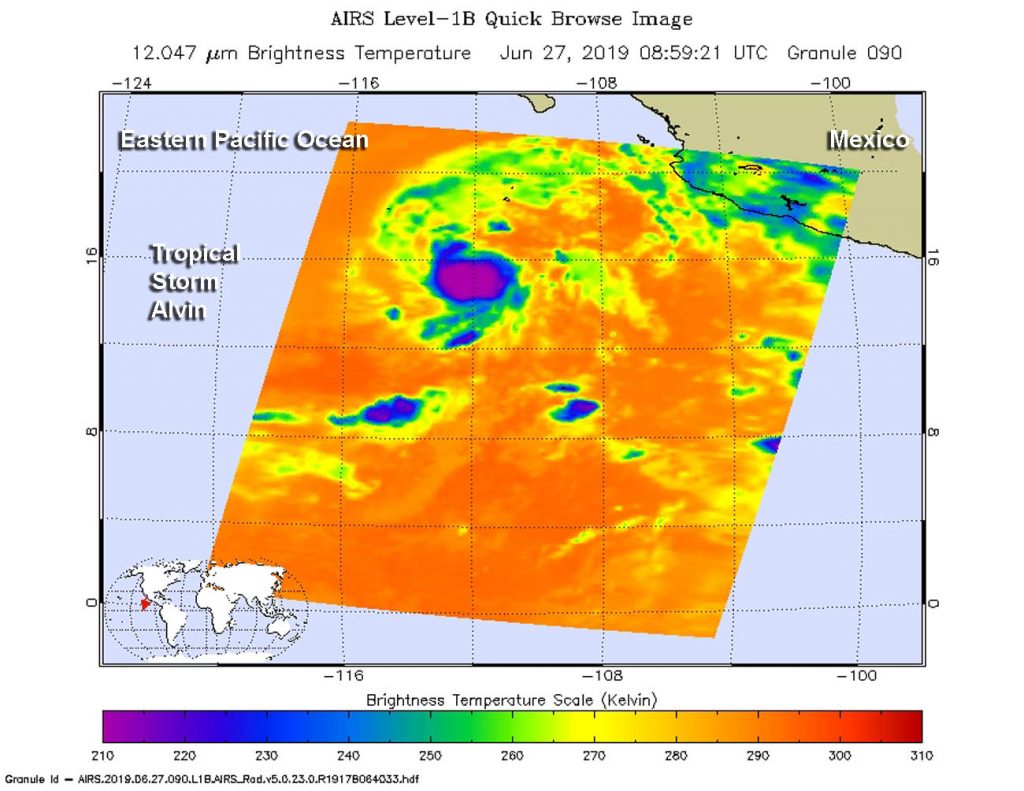
The Atmospheric Infrared Sounder or AIRS instrument aboard NASA’s Aqua satellite passed over Tropical Storm Alvin and analyzed the storm in infrared light. Infrared light provides scientists with temperature data and that is important when trying to understand the strength of the thunderstorms that make up a tropical cyclone. The higher the cloud tops, the colder and the stronger they are. So infrared light as that gathered by the AIRS instrument can identify the strongest sides of a tropical cyclone.
NASA’s Aqua satellite flew over Alvin on June 27 at 4:59 a.m. EDT (0859 UTC). AIRS detected strongest storms around the center with cloud top temperatures as cold as minus 63 degrees Fahrenheit (minus 53 degrees Celsius). Infrared data showed cloud top temperatures were getting colder, indicating stronger uplift of air, pushing those storms higher in the troposphere. Storms with cloud top temperatures that cold have the capability to produce heavy rainfall. The storm intensified over June 27 to early June 28 as winds increased from 60 to 70 mph (97 to 110 kph).
On June 28, NOAA’s National Hurricane Center forecaster Daniel Brown said, “Alvin’s satellite presentation has begun to degrade overnight with the overall cloud pattern becoming elongated from southwest to northeast. Southwesterly shear has caused the system to become less symmetric.”
Current Status of Alvin
At 5 a.m. EDT (0900 UTC) on Friday, June 28, 2019 the center of Tropical Storm Alvin was located near latitude 18.0 degrees north and longitude 116.3 degrees west. That puts the center of Alvin about 535 miles (860 km) southwest of the southern tip of Baja California, Mexico. Maximum sustained winds are near 70 mph (110 kph) with higher gusts.
Alvin is moving toward the northwest near 15 mph (24 kph), and a gradual turn toward the west-northwest with a decrease in forward speed is expected over the next couple of days. Alvin is expected to move into an area of cooler waters and where the southwesterly wind shear is forecast to increase. Those two factors are expected to cause rapid weakening during the next 24 to 36 hours. Because Alvin is a small cyclone, it is likely to suffer from the effects of the hostile environment more quickly.
The National Hurricane Center expects Alvin to weaken over the next day or two, and Alvin is forecast to become a remnant low on Saturday and should dissipate soon thereafter.
For forecast updates on Tropical Storm Alvin, visit: www.nhc.noaa.gov
More information about AIRS can be found at: http://airs.jpl.nasa.gov
Rob Gutro
NASA’s Goddard Space Flight Center, Greenbelt, Md.
