Francisco – Southern Indian Ocean

Feb. 14, 2020 – NASA Catches the Re-birth of Zombie Tropical Cyclone Francisco

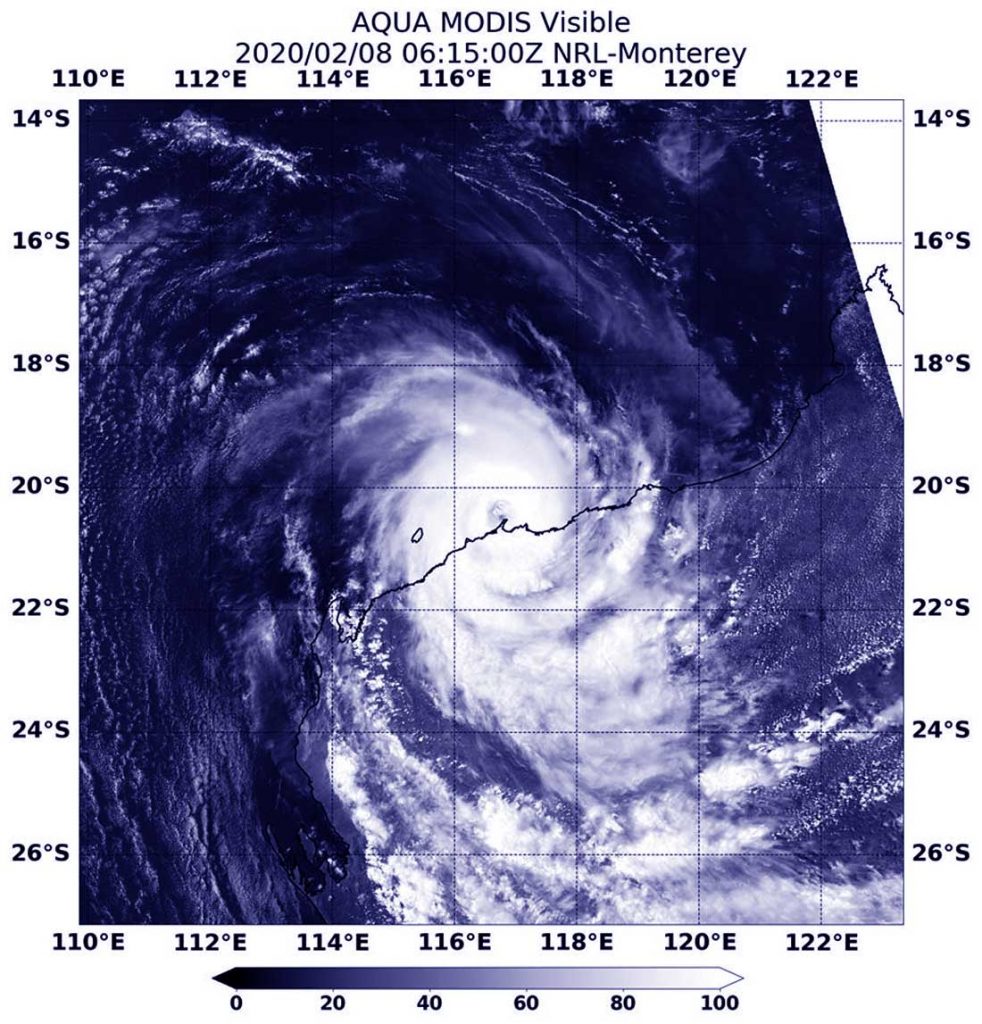
The low-pressure area that had once been Tropical Cyclone Francisco has been lingering in the Southern Indian Ocean since Feb. 6 when it weakened below tropical cyclone status. Since then, Francisco’s remnants moved into an area of warm waters and low wind shear allowing the low-pressure area to re-organize, consolidate and re-form. NASA’s Aqua satellite provided forecasters with a visible image of the zombie storm.

Aqua image of Francisco
On Feb. 14, the MODIS instrument that flies aboard NASA’s Aqua satellite provided a visible image of re-formed Tropical Cyclone Francisco heading for landfall in east-central Madagascar. Credit: NASA/NRL

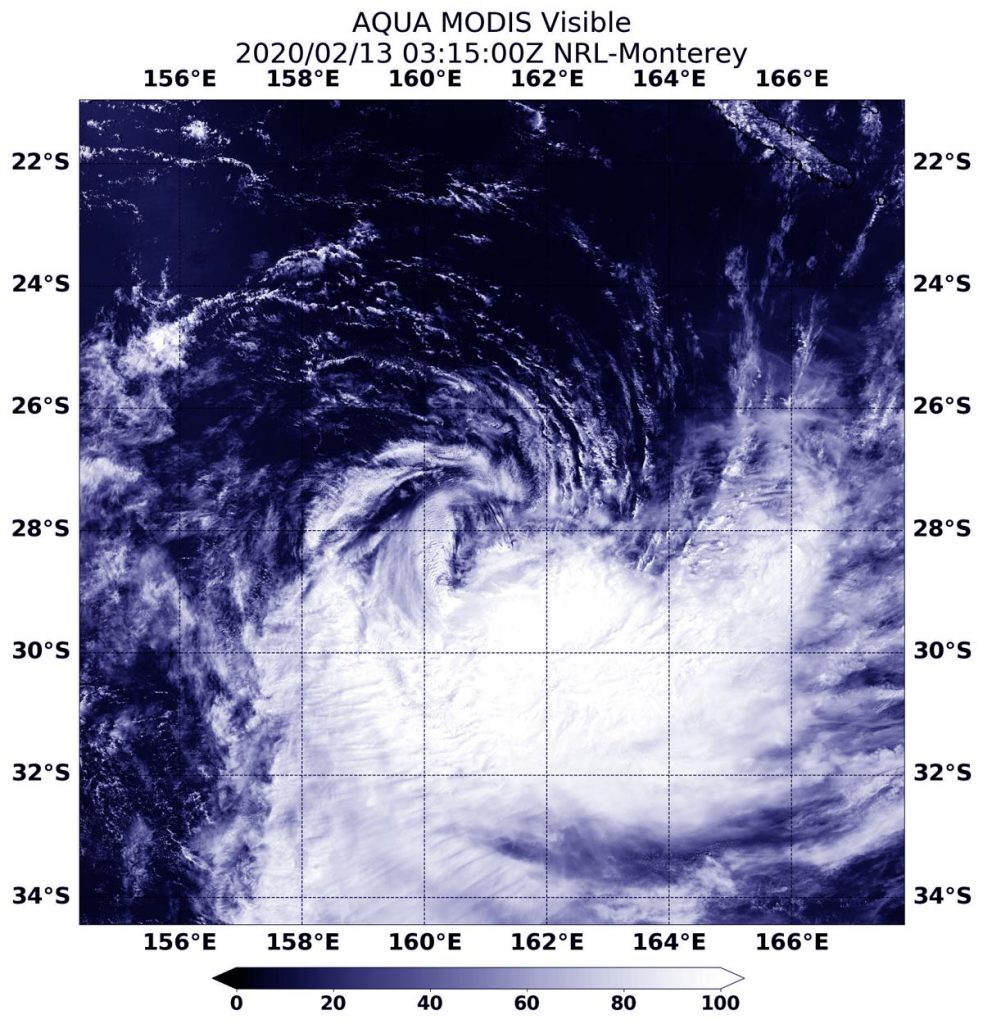
On Feb. 14, the Moderate Resolution Imaging Spectroradiometer or MODIS instrument that flies aboard NASA’s Aqua satellite provided a visible image that showed the storm had re-developed a rounded shape with bands of thunderstorms spiraling into the low-level center. A more rounded shape of a tropical cyclone indicates it is becoming a more organized storm. Satellite imagery shows a compact system with strong thunderstorms persisting over the low-level circulation. In addition, satellite microwave imagery indicates deep convective banding of thunderstorms over the western semicircle wrapping into the north and east quadrants of a defined low-level circulation center.

On Feb. 14 at 4 a.m. EST (0900 UTC), the Joint Typhoon Warning Center (JTWC) noted that Francisco’s maximum sustained winds powered back up to 40 knots (46 mph/74 kph). Francisco re-formed near latitude 19.0 degrees south and longitude 49.3 east, approximately 114 nautical miles east of Antananarivo, Madagascar. Francisco has tracked southwestward.

Meteo Madagascar issued a Red Vigilance Advisory for heavy rain over central and eastern Madagascar that includes Toamasina, Brickaville, Mahanoro, and the Vatomandry Districts.

The JTWC forecast said the system is expected to make landfall later today over the southeast coast of Atsinanana Region, close to Vatomandry City. That is far to the south of the coastal city of Toamasina. Francisco is expected to weaken steadily as it tracks inland and dissipate sometime on Feb. 15 over land.

NASA’s Aqua satellite is one in a fleet of NASA satellites that provide data for hurricane research.

Tropical cyclones/hurricanes are the most powerful weather events on Earth. NASA’s expertise in space and scientific exploration contributes to essential services provided to the American people by other federal agencies, such as hurricane weather forecasting.

For updated forecasts from Meteo Madagascar, visit:  http://www.meteomadagascar.mg/

By Rob Gutro
NASA’s Goddard Space Flight Center

Uesi – Southern Pacific Ocean

Feb. 14, 2020 – NASA Finds Ex-Tropical Cyclone Uesi’s Rains Affecting New Zealand

Although it is now an “ex-tropical cyclone,” Uesi continues to generate some moderate rainfall, especially in its southern quadrant as it moves toward New Zealand.

GPM image of Uesi
The GPM’s core satellite passed over Uesi on Feb. 14 at 2:11 a.m. EST (0716 UTC). GPM found heaviest rainfall (orange) south of center and in bands far south of the center falling at rates of 1 inch (25 mm) per hour. Light rain appears around the entire system (light blue), falling at less than 0.2 inches (less than 5 millimeters) per hour. Credit: NASA/NRL

The Global Precipitation Measurement mission or GPM satellite provided a look at the rainfall rates on Feb. 14 at 2:11 a.m. EST (0716 UTC). GPM found heaviest rainfall south of center and in bands far south of the center falling at rates of 1 inch (25 mm) per hour. Light rain appears around the entire system, falling at less than 0.2 inches (less than 5 millimeters) per hour.

On Feb. 13 at 2218 UTC (5:18 p.m. EST), the New Zealand Met Service (NZMS) reported “Ex-Tropical Cyclone Uesi was located near Lord Howe Island this morning, and is moving southwest. The system is expected to gradually recurve towards the southeast and move close to the lower South Island during Sunday [Feb.16].”

On Feb. 14, NZMS noted a Heavy Rain Warning is currently in effect for Westland south of Otira. A Heavy Rain Watch is in effect for the remainder of the South Island West Coast and Stewart Island.

NZMS said “A heavy rain warning is in effect for the South Island West Coast and Stewart Island on Sunday [Feb.16] and early Monday [Feb. 17]. Former Tropical Cyclone Uesi is forecast to approach the South Island from the north Tasman Sea overnight Saturday and lie to the west of Fiordland on Sunday. It should then move southwest from late Sunday onwards and weaken. This system is expected to bring periods of heavy rain to the west and south of the South Island during Sunday and early Monday. Strong to gale north to northwest winds are also expected in parts of the South Island and the lower North Island during this time.”

Tropical cyclones/hurricanes are the most powerful weather events on Earth. NASA’s expertise in space and scientific exploration contributes to essential services provided to the American people by other federal agencies, such as hurricane weather forecasting.

GPM is a joint mission between NASA and the Japan Aerospace Exploration Agency, JAXA.

By Rob Gutro
NASA’s Goddard Space Flight Center

Uesi – Southern Pacific Ocean

Feb. 13, 2020 – NASA Finds Wind Shear Affecting Tropical Cyclone Uesi

NASA satellite imagery revealed that vertical wind shear appears to be affecting Tropical Cyclone Uesi in the Southern Pacific Ocean.

Aqua image of Uesi
On Feb. 13 at 0315 UTC (Feb. 12 at 10:15 p.m. EST), the MODIS instrument that flies aboard NASA’s Aqua satellite provided a visible image of Tropical Cyclone Uesi being adversely affected by vertical wind shear. Credit: NASA/NRL

On Feb. 13 at 0315 UTC (Feb. 12 at 10:15 p.m. EST), the Moderate Resolution Imaging Spectroradiometer or MODIS instrument that flies aboard NASA’s Aqua satellite provided a visible image of Tropical Cyclone Uesi being adversely affected by vertical wind shear. The image showed that the bulk of clouds were being pushed to the southeast of the center of circulation.

In general, wind shear is a measure of how the speed and direction of winds change with altitude. Tropical cyclones are like rotating cylinders of winds. Each level needs to be stacked on top each other vertically in order for the storm to maintain strength or intensify. Wind shear occurs when winds at different levels of the atmosphere push against the rotating cylinder of winds, weakening the rotation by pushing it apart at different levels. Northwesterly wind shear was affecting Uesi and pushing the bulk of clouds to the southeast of the center.

At 0300 UTC on Feb. 13 (10 p.m. EST on Feb. 12), the Joint Typhoon Warning Center (JTWC) issued the final bulletin on Tropical cyclone Uesi. At that time, Uesi was located near latitude 27.7 degrees south and longitude 161.1 degrees east, about 332 nautical miles southwest of Noumea, New Caledonia. Uesi had maximum sustained winds near 55 knots (63 mph/102 kph). The storm was moving to the south-southwest.

On Feb. 13 at 11:59 pm AEDT (Australia Eastern Time) or 7:59 a.m. EST, the Australian Bureau of Meteorology (ABM) noted “Ex-tropical cyclone Uesi is moving rapidly southwards and will produce destructive wind gusts at Lord Howe Island over the next few hours.”  ABM said that the system is expected to maintain an intensity equivalent to a category 2 tropical cyclone as it passes the island. For updates from ABM, visit: http://www.bom.gov.au/.

NASA’s Aqua satellite is one in a fleet of NASA satellites that provide data for hurricane research.

Tropical cyclones/hurricanes are the most powerful weather events on Earth. NASA’s expertise in space and scientific exploration contributes to essential services provided to the American people by other federal agencies, such as hurricane weather forecasting.

By Rob Gutro
NASA’s Goddard Space Flight Center

Uesi – Southern Pacific Ocean

Feb. 12, 2020 – NASA Finds Heavy Rain Southwest of Tropical Cyclone Uesi’s Center

The Global Precipitation Measurement mission or GPM satellite provided a look at the rainfall occurring within Tropical Cyclone Uesi and found heaviest rainfall in the southern quadrant of the storm.

GPM image of Uesi
The GPM’s core satellite passed over Uesi on Feb. 12 at 12:11 p.m. EST (1711 UTC). GPM found heaviest rainfall (pink) southwest of the center, falling at a rate of 1.6 inches (40 mm) per hour. Orange areas indicate rainfall rates of 1 inch (25 mm) per hour and scattered light rain appears in light blue from the fringe clouds falling at less than 0.2 inches (less than 5 millimeters) per hour. The GPM rainfall was overlaid on imagery from Japan’s Himawari-8 satellite. Credit: NASA/NRL/JAXA

Uesi is in the South Pacific Ocean and has been affecting New Caledonia. New Caledonia is a collectivity of France, located south of Vanuatu and about 1,210 km (750 miles) east of Australia.

The GPM’s core satellite passed over Uesi on Feb. 12 at 12:11 p.m. EST (1711 UTC). GPM found heaviest rainfall southwest of the center, falling at a rate of 1.6 inches (40 mm) per hour. Directly south of the center were areas where rainfall rates were falling at a rate of 1 inch (25 mm) per hour. Scattered light rain, falling at less than 0.2 inches (less than 5 millimeters) per hour appeared to be occurring in the rest of the storm.

On Feb 12 at 1 a.m. EST (5 p.m. New Caledonia local time), Meteo-France, which forecasts for New Caledonia, noted that Uesi’s maximum sustained winds were near 110 kph (68 mph/59 knots). Uesi was moving to the southwest. It was centered near latitude 23.5 degrees south and longitude 162.8 degrees east, about 450 km (280 miles) west-southwest of Noumea.

Meteo-France noted, “The rains eased in the afternoon, except over the Canala region where the showers are still continuing this evening. In the past 12 hours, we have noted 80 to 130 mm (3.1 to 5.1 inches) in the relief of the South and 80 mm (3.1 inches) in 3 hours in the town of Canala. The wind remains strong with gusts up to 90 kph (60 mph/49 knots) on the chain, on the West Coast and the South. Uesi is moving away from the Caledonian coasts, its influence is still felt throughout the country. Conditions remain disturbed overnight, with a gradual improvement in the north.”

Uesi is expected to turn to the southwest and become subtropical after a day or two, off the coast of eastern Australia.

Tropical cyclones/hurricanes are the most powerful weather events on Earth. NASA’s expertise in space and scientific exploration contributes to essential services provided to the American people by other federal agencies, such as hurricane weather forecasting.

GPM is a joint mission between NASA and the Japan Aerospace Exploration Agency, JAXA.

For updates from Meteo-France, visit: http://www.meteo.nc/nouvelle-caledonie/cyclone/phenomenes-en-cours

By Rob Gutro
NASA’s Goddard Space Flight Center

Uesi – Southern Pacific Ocean

Feb. 11, 2020 – NASA Finds a Stronger Tropical Cyclone Uesi Near New Caledonia

NASA’s Terra satellite passed over the South Pacific Ocean and found a stronger Tropical Cyclone Uesi after obtaining infrared imagery of the storm. Uesi continues moving away from Vanuatu and today is affecting New Caledonia.

Terra image of Uesi
On Feb. 11 at 6:15 a.m. EST (1115 UTC), the MODIS instrument aboard NASA’s Terra satellite gathered temperature information about Uesi’s cloud tops. MODIS found powerful thunderstorms south and east of the center of circulation where temperatures were as cold as or colder than minus 80 degrees Fahrenheit (minus 62.2 Celsius). Credit: NASA/NRL

Infrared data provides temperature information, and identifies the strongest thunderstorms that reach high into the atmosphere and have the coldest cloud top temperatures. On Feb. 11 at 6:15 a.m. EST (1115 UTC), the Moderate Resolution Imaging Spectroradiometer or MODIS instrument aboard NASA’s Terra satellite gathered that temperature information about Uesi’s cloud tops. MODIS found powerful thunderstorms south and east of the center of circulation where temperatures were as cold as or colder than minus 80 degrees Fahrenheit (minus 62.2 Celsius). Cloud top temperatures that cold indicate strong storms with the potential to generate heavy rainfall.

On Feb. 11, the Vanuatu Meteorology and Geo-Hazards Department (VMGD), in Port Vila issued an update on Uesi.  At 7:48 a.m. EST (11:48 p.m. Vanuatu local time), Tropical Cyclone Uesi was located at latitude 19.6 degrees south and longitude 162.6 east, about 435 miles (700 km) west of Tanna. Winds close to the center of the system have increased from near 55 mph (90 kph/50 knots) to 78 mph (125 kph/67 knots), making it equivalent to a Category 1 hurricane. Uesi was moving in a south-southeasterly direction. VMGD said that the potential for the system to recurve and move towards Vanuatu is low.

VMGD’s final advisory on Uesi said, “Isolated heavy rainfalls may still be expected about [the] Vanuatu group today and tonight. Seas will remain very rough with heavy to phenomenal swells over coastal and open waters to the west of the Vanuatu group. Severe weather warning for heavy rainfalls for northern, central and southern provinces, while Marine strong wind warning for all coastal waters are current.”

Meteo France, the forecast entity that provides forecasts for New Caledonia, which is located to the south-southwest of Vanuatu, is now feeling more of the effects from Uesi. On Feb. 11, Meteo France noted, “Uesi continues to move south passing west of Bélep and Grande-Terre a hundred kilometers (62 miles).” Rainbands continue to affect the whole territory and generate large accumulations of rain. As Uesi continues moving toward the south on Feb. 12, it is pulling away from New Caledonia. However, forecasters note that bands of thunderstorms can still bring heavy rainfall and gusty winds on Feb. 11. Highest rainfall is likely especially on the eastern side of the island.

For updates from VMGD’s website: wwww.vmgd.gov.vu and VMGD’s Facebook page: www.facebook.com/vmgd.gov.vu.

For updates on New Caledonia’s forecast, visit Meteo France:  http://www.meteo.nc/

Tropical cyclones/hurricanes are the most powerful weather events on Earth. NASA’s expertise in space and scientific exploration contributes to essential services provided to the American people by other federal agencies, such as hurricane weather forecasting.

By Rob Gutro
NASA’s Goddard Space Flight Center

Uesi – Southern Pacific Ocean

Feb. 10, 2020 – NASA Examines Tropical Storm Uesi’s Heavy Rainfall

NASA analyzed Tropical Storm Uesi’s rainfall and found moderate to heavy rainfall around the storm’s center and in a large band of thunderstorms south of the center. That heavy rainfall has triggered warnings for Vanuatu in the Southern Pacific Ocean.

GPM image of Uesi
The GPM core satellite passed over the Southern Pacific Ocean and analyzed rainfall occurring in Tropical Storm Uesi on Feb. 10 at 2:31 a.m. EST (0731 UTC). Heaviest rainfall (red) around the center falling at a rate of 1.2 inches (30 mm) per hour. In a large band of thunderstorms south of the center, rainfall occurring at a rate of 1 inch (25 mm) per hour (orange). Light rain (blue) was found throughout the rest of the storm. Credit: NASA/JAXA/NRL

NASA has the unique capability of peering under the clouds in storms and measuring the rate in which rain is falling. The Global Precipitation Measurement mission or GPM core passed over Uesi from its orbit in space and measured rainfall rates throughout the storm on Feb. 10 at 2:31 a.m. EST (0731 UTC).

The heaviest rainfall around the center was falling at a rate of 1.2 inches (30 mm) per hour. In a large band of thunderstorms south of the center, rainfall occurring at a rate of 1 inch (25 mm) per hour. Light rain was occurring throughout the rest of the storm.

On Feb. 10, the Vanuatu Meteorology and Geo-Hazards Department (VMGD), in Port Vila issued an update on Uesi.  At 7 a.m. EST (11 p.m. Vanuatu local time), Tropical Cyclone Uesi was located at latitude 17.6 degrees south and longitude 162.4 east, about 348 miles (560 km) west southwest of Malekula. Winds close to the center of the system were estimated near 55 mph (90 kph/50 knots) and Uesi was moving in a southwest direction.

VMGD’s latest update said, “Rainfalls will be heavy with flash flood over low lying areas and areas close to river banks, including coastal flooding expected about the islands of the northern and parts of the central provinces. The marine strong wind warning is in effect for all Vanuatu coastal waters, while High seas warning is current for the central waters. Very rough to phenomenal seas and heavy to phenomenal swells expected to continue to affect the western parts of the northern and central waters tonight and tomorrow and extending to southern waters thereafter. People, including sea going vessels are strongly advised not to go out to sea until the system has moved out of the area.”

The National Disaster Management Office (NDMO) posted a Blue Alert for the SHEFA and TAFEA provinces.

For updates from VMGD’s website: www.vmgd.gov.vu and VMGD’s Facebook page: www.facebook.com/vmgd.gov.vu.

Tropical cyclones/hurricanes are the most powerful weather events on Earth. NASA’s expertise in space and scientific exploration contributes to essential services provided to the American people by other federal agencies, such as hurricane weather forecasting.

Both the Japan Aerospace Exploration Agency, JAXA and NASA manage GPM.

By Rob Gutro
NASA’s Goddard Space Flight Center

Damien – Southern Indian Ocean

Feb. 10, 2020 – NASA Analyzes Ex-Tropical Cyclone Damien’s Rainfall in Western Australia

Tropical Cyclone Damien made landfall on Feb. 9 along the northern Pilbara coast of Western Australia. On Feb. 10, the GPM or Global Precipitation Measurement mission core satellite analyzed the rainfall generated by the remnants that triggered warnings.

GPM image of Damien
On Feb. 10 at 5:41 a.m. EST (1041 UTC), GPM passed over Western Australia and measured the rate of rainfall from Damien’s remnants. GPM showed heaviest rainfall occurring south of the center and falling at a rate of at least 5 mm/0.2 inches (dark blue) per hour. Credit: NASA/JAXA/NRL

As Damien was making landfall around 1:15 a.m. EST (0615 UTC) on Feb. 9, the MODIS instrument aboard NASA’s Aqua satellite captured a visible image of the storm. The MODIS image showed the recently developed eye on the coastline. By 11 a.m. EST, Damien’s center had moved inland into Western Australia. Tropical Cyclone Damien has weakened to a Category 2 system, according to the Australian Bureau of Meteorology (ABM).

On Feb. 10 at 5:41 a.m. EST (1041 UTC), GPM passed over Western Australia and measured the rate of rainfall from Damien’s remnants. GPM showed heaviest rainfall occurring south of the center and falling at a rate of at least 0.2 inches (5 mm) per hour.

Aqua image of Damien
As Damien was making landfall around 1:15 a.m. EST (0615 UTC) on Feb. 9, the MODIS instrument aboard NASA’s Aqua satellite captured a visible image of the storm. The MODIS image showed the recently developed eye on the coastline. Credit: NASA/NRL

The Australian Bureau of Meteorology posted an update at 3 a.m. EST (4 p.m. AWST), Feb. 10, and noted Ex-Tropical Cyclone Damien was located over the northeast Gascoyne, about 62 miles (100 kilometers) north northeast of Meekatharra, moving towards the south.

ABM said, “Ex-Tropical Cyclone Damien is expected to carry with it an area of heavy rainfall as it moves south southeast through the southeastern Gascoyne and the adjacent Goldfields.” That heavy rainfall that may lead to flash flooding.

ABM’s update noted, “Heavy rainfall is forecast over the southeastern Gascoyne and adjacent Goldfields, this area will gradually move south overnight Monday (Feb. 10). Strong and squally winds are also possible. Locations which may be affected include Mount Magnet, Cue, Leinster and Sandstone.”

Since 9 a.m. AWST Monday (8 p.m. EST on Sunday, Feb 9) the following rainfall amounts have been observed: Wiluna Airport 40 mm (1.57 inches) and at Meekatharra 29.8 (1.17 inches).

For updated warnings, visit: http://www.bom.gov.au/wa/warnings/

By Rob Gutro
NASA’s Goddard Space Flight Center

Damien – Southern Indian Ocean

Feb. 07, 2020 -NASA Analyzes Tropical Cyclone Damien’s Water Vapor Concentration

When NASA’s Aqua satellite passed over the Southern Indian Ocean on Feb. 7, it gathered water vapor data that provided information about the intensity of Tropical Cyclone Damien.

Aqua image of Damien
On Feb. 7 at 12:25 a.m. EST (1725 UTC), NASA’s Aqua satellite passed over Tropical Cyclone Damien, located in the Southern Indian Ocean and off Australia’s Pilbara coast. Aqua found highest concentrations of water vapor (brown) and coldest cloud top temperatures were around the center. Credits: NASA/NRL

On Feb. 7 at 12:25 a.m. EST (1725 UTC), NASA’s Aqua satellite passed over Tropical Cyclone Damien, located in the Southern Indian Ocean and off Australia’s Pilbara coast. Aqua found highest concentrations of water vapor (brown) and coldest cloud top temperatures were around the center. Credits: NASA/NRLThe Australian Bureau of Meteorology (ABM) issued warnings and watches as Tropical Cyclone Damien moves toward the Pilbara Coast of Western Australia.

On Friday, February 7 at 11:46 pm WST (10:46 a.m. EST), the Warning Zone extends from Pardoo to Onslow, including Port Hedland, Karratha, Dampier, Pannawonica and Barrow Island and extending to adjacent inland parts to include Marble Bar, Tom Price and Paraburdoo. The Watch Zone includes inland central Pilbara including Nullagine, Newman and Mt Augustus.

ABM forecasters expect Severe Tropical Cyclone Damien to cause gales on the Pilbara coast from early Saturday morning. Very Destructive winds, very heavy rainfall and a storm surge are expected as Damien crosses the coast during Saturday, Feb. 8.

NASA’s Aqua satellite passed over Tropical Cyclone Damien on Feb. 7 at 12:25 a.m. EST (1725 UTC) and the Moderate Resolution Imaging Spectroradiometer or MODIS instrument gathered water vapor content and temperature information. The MODIS image showed highest concentrations of water vapor and coldest cloud top temperatures were around the center of circulation.

MODIS data also showed coldest cloud top temperatures were as cold as or colder than minus 70 degrees Fahrenheit (minus 56.6 degrees Celsius) in those storms. Storms with cloud top temperatures that cold have the capability to produce heavy rainfall.

Water vapor analysis of tropical cyclones tells forecasters how much potential a storm has to develop. Water vapor releases latent heat as it condenses into liquid. That liquid becomes clouds and thunderstorms that make up a tropical cyclone. Temperature is important when trying to understand how strong storms can be. The higher the cloud tops, the colder and the stronger the storms.

On February 7 at 11:46 pm WST (10:46 a.m. EST), ABM reported that Damien was a Category 3 storm with maximum sustained winds near the center of 140 kilometers (87 miles) per hour with higher wind gusts. Damien was located near latitude 18.9 degrees south and longitude 16.7 degrees east, about 205 kilometers (127 miles) north of Karratha and 255 kilometers (158 miles) northwest of Port Hedland. Damien is moving to the south-southwest.

Forecasters at the ABM reported on Feb. 7, “Severe Tropical Cyclone Damien (Category 3) is expected to intensify as it moves towards the Pilbara coast. Damien is likely to cross the coast between Whim Creek and Mardie during Saturday as a Category 4 system. Later on Saturday or Sunday, Damien will move inland and weaken.”

For the Australian Bureau of Meteorology Weather video update on Feb. 7, visit: https://youtu.be/TgO9v0mYiCM

NASA’s Aqua satellite is one in a fleet of NASA satellites that provide data for hurricane research.

Tropical cyclones/hurricanes are the most powerful weather events on Earth. NASA’s expertise in space and scientific exploration contributes to essential services provided to the American people by other federal agencies, such as hurricane weather forecasting.

For updated forecasts from the ABM, visit: http://www.bom.gov.au/cyclone/index.shtml

By Rob Gutro
NASA’s Goddard Space Flight Center

Damien – Southern Indian Ocean

Feb. 06, 2020 – NASA Sees Tropical Storm Damien Form off Australia’s Pilbara Coast

The low-pressure area that formed off Australia’s Kimberley coast and lingered there for a couple of days has moved west and developed into Tropical Cyclone Damien off the Pilbara coastline. NASA’s Terra satellite passed over the Southern Indian Ocean and provided forecasters with a visible image of the new tropical storm.  The Pilbara Coast is also known as the northwest coast of Western Australia.

Aqua image of Damien
On Feb. 6, 2020, the MODIS instrument that flies aboard NASA’s Terra satellite provided a visible image of newly developed Tropical Storm Damien off Western Australia’s Pilbara coast. Credit: NASA Worldview

On Feb. 6, the Moderate Resolution Imaging Spectroradiometer or MODIS instrument that flies aboard NASA’s Terra satellite provided a visible image of Damien that showed the storm had a more rounded shape than it did the previous day as it continued to consolidate. A more rounded shape of a tropical cyclone indicates it is becoming a more organized storm. Satellite imagery revealed a small central dense overcast with rain bands wrapping in towards the low-level circulation center.

The Australian Bureau of Meteorology (ABM) issued warnings and watches for Damien on Feb. 6. The Warning Zone includes Wallal Downs to Mardie, including Port Hedland, Karratha and Dampier. The Watch Zone extends from Mardie to Onslow, and the inland central Pilbara including Tom Price, Paraburdoo, Marble Bar and Nullagine. A Blue Alert is in effect for residents in or near Wallal Downs to Port Hedland and Mardie to Onslow but not including Onslow, (including the towns of Pannawonica, Tom Price, Paraburdoo, Nullagine and Marble Bar). A Yellow Alert is in effect for residents in or near Port Hedland to Mardie and south to Millstream (including the Town of Port Hedland, Whim Creek, Point Samson, Wickham, Roebourne, Karratha and Dampier).

At 11:00 p.m. AWST (10 a.m. EST) on Feb. 6, the ABM said Tropical Cyclone Damien had maximum sustained winds near 75 kilometers per hour (40 knots/47 mph) with higher gusts. It was located near latitude 17.5 degrees south and longitude 118.1 degrees east, about 315 kilometers (196 miles) north of Port Hedland and 385 kilometers (239 miles) north-northeast of Karratha. Damien is moving to the west-southwest at 20 kilometers (12 miles) per hour.

The tropical cyclone is expected to continue to intensify as it tracks to the west southwest. Damien is expected to turn south towards the Pilbara coast during Friday, Feb 7. ABM cautioned that, “Severe tropical cyclone impact is forecast for the Pilbara coast during Saturday, Feb. 8.”

NASA’s Terra satellite is one in a fleet of NASA satellites that provide data for hurricane research.

Tropical cyclones/hurricanes are the most powerful weather events on Earth. NASA’s expertise in space and scientific exploration contributes to essential services provided to the American people by other federal agencies, such as hurricane weather forecasting.

For updated forecasts from ABM, visit: http://www.bom.gov.au/products/IDW60281.shtml

By Rob Gutro
NASA’s Goddard Space Flight Center

Francisco – Southern Indian Ocean

Feb. 06, 2020 – NASA Satellite Finds Wind Shear Adversely Affecting Tropical Storm Francisco

Forecasters use a variety of satellite imagery to understand what is happening in a storm, and sometimes just a visible picture can tell a lot. NASA-NOAA’s Suomi NPP satellite provided forecasters with a visible image of the Tropical Storm Francisco in the Southern Indian Ocean that showed wind shear was pushing clouds away from the storm’s center.

Suomi NPP image of Francisco
NASA-NOAA’s Suomi NPP satellite passed over Tropical Storm Francisco on Feb. 6, 2020 and revealed wind shear was pushing the bulk of its clouds to the southeast of its center. Credit: NASA Worldview, Earth Observing System Data and Information System (EOSDIS)

Visible imagery from satellites helps forecasters understand if a storm is organizing or weakening, or if it is being affected by vertical wind shear. The shape of a tropical cyclone provides forecasters with an idea of its organization and strength. When outside winds, that is, vertical wind shear, batter a storm it can change the shape of it and push much of the associated clouds and rains to one side of it.

In general, wind shear is a measure of how the speed and direction of winds change with altitude. Tropical cyclones are like rotating cylinders of winds. Each level needs to be stacked on top each other vertically in order for the storm to maintain strength or intensify. Wind shear occurs when winds at different levels of the atmosphere push against the rotating cylinder of winds, weakening the rotation by pushing it apart at different levels.

The Visible Infrared Imaging Radiometer Suite (VIIRS) instrument aboard Suomi NPP provided a visible image of Francisco on Feb. 6. The image showed vertical wind shear is displacing the deep convection about 125 nautical miles to the southeast. In addition, multispectral satellite imagery revealed that the low-level circulation center appeared elongated. When the circulation is not circular and appears elongated, it cannot spin as quickly, just like a tire. Thus, the storm weakens. Wind shear is causing the elongation and weakening the storm.

At 4 a.m. EDT (0900 UTC), the Joint Typhoon Warning Center (JTWC) issued their final advisory on Tropical Cyclone Francisco. At that time, Francisco was located near latitude 19.1 degrees south and longitude 71.7 degrees east, about 816 nautical miles east of Port Louis, Mauritius and moving southeast. Maximum sustained winds were near 35 knots (40 mph/65 kph) and weakening.

The JTWC expects Francisco will continue moving to the southeast until it dissipates.

Tropical cyclones/hurricanes are the most powerful weather events on Earth. NASA’s expertise in space and scientific exploration contributes to essential services provided to the American people by other federal agencies, such as hurricane weather forecasting.

By Rob Gutro 
NASA’s Goddard Space Flight Center