Kammuri – Northwestern Pacific Ocean

Dec. 05, 2019 – NASA Analyzes Kammuri’s Heavy Rainfall    

NASA provided analyses of Typhoon Kammuri’s heavy rainfall on its track through the Northwestern Pacific Ocean using the Global Precipitation Measurement mission or GPM core satellite.

GPM instrument image of rainfall rates in Kammuri
Instantaneous surface rain rates (mm/hr) associated with Typhoon Kammuri derived from the Dual-polarization Radar onboard the GPM core satellite at 18:27 UTC 29 November 2019 (3:27 am Palau Time, PWT, 30 November) when the storm was moving westward through the central Philippine Sea. GPM showed areas of moderate to heavy rain (shown in yellow, orange and red, respectively) organized into loose bands rotating around the northern and western side of the storm.   Image from NASA GSFC using GPM data archived at https://pps.gsfc.nasa.gov/.

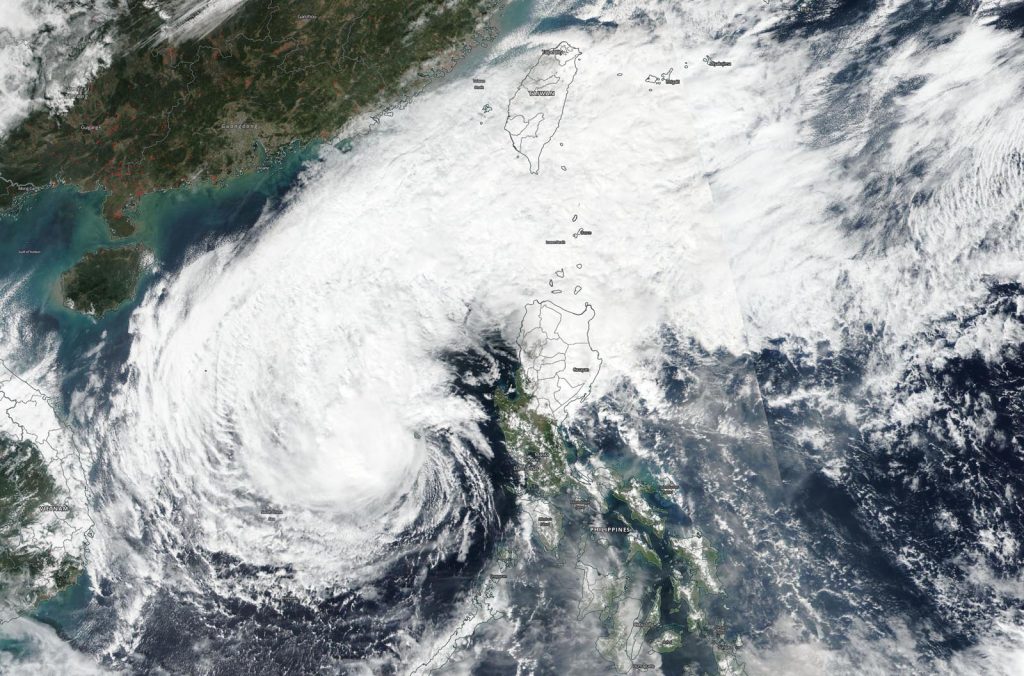
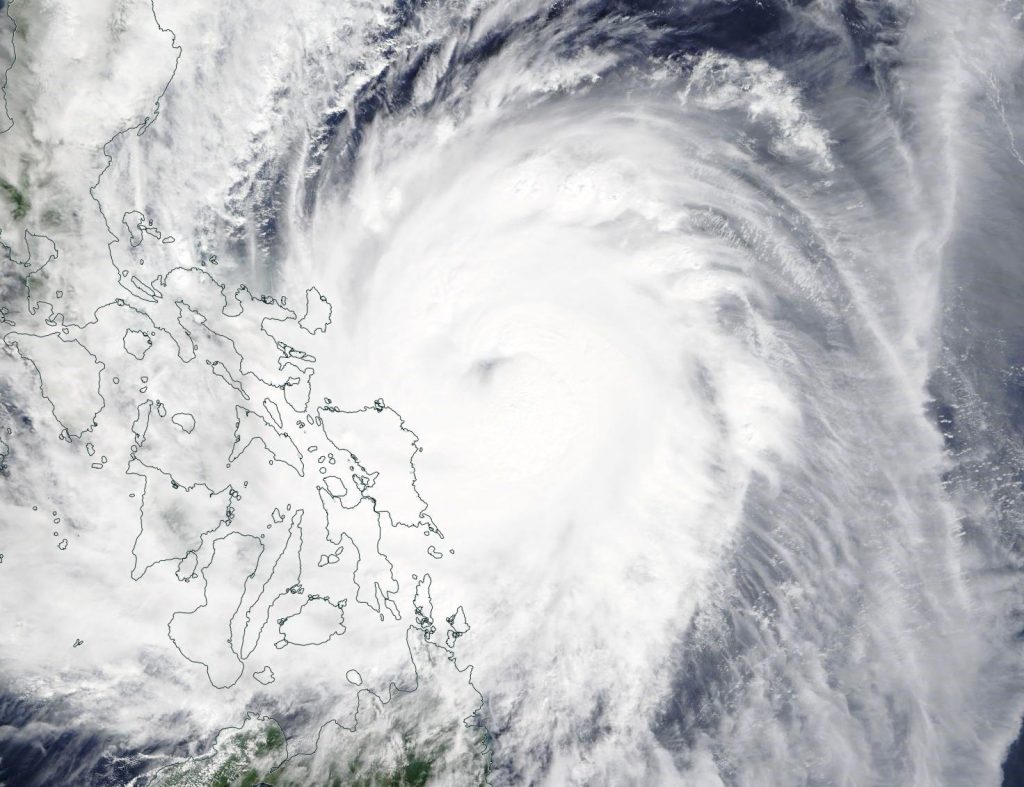
While the Atlantic hurricane season officially ended on November 30, Typhoon Kammuri (known as Tisoy in the Philippines), which recently struck the central Philippines as a powerful Category 4 typhoon, is a reminder that the Pacific typhoon season is not yet over.  In fact, while typhoon season does peak from around June through November, similar to the Atlantic, typhoons can occur throughout the year in the Pacific.

History of Kammuri

Kammuri first formed into a tropical depression from an area of low pressure on the 25th of November north of Micronesia in the west central Pacific about 500 miles southeast of Guam.  Kammuri intensified slowly and was still a tropical storm when the center passed about 130 miles south of Guam on the evening of Dec. 26.   As the storm made its way through the eastern and central Philippine Sea over the next few days it was kept in check at times by moderate wind shear and hovered around typhoon intensity.

GPM IMERG data of rainfall accumulations in Kammuri
Typhoon Kammuri’s surface rainfall accumulations estimated from the NASA IMERG  from  Nov. 24 at 7 p.m. EST to Dec 3 at 10 p.m. EST.  Heaviest rains were over the central Philippine Sea where the cyclone stalled. Those were well over 500 mm (~20 inches, in red).  Most of the central Philippines, including southern Luzon, received up to 150 mm or more (over 6 inches, light blue areas) with the highest amounts over the northern half of the island of Samar where rainfall totals ranged from 250 to 350 mm (~10 to 14 inches, shown in yellow and light orange).  Credit: NASA GSFC using IMERG data/with the Giovanni online data system, developed and maintained by the NASA GES DISC.

Analyzing Kammuri’s Rainfall from Space

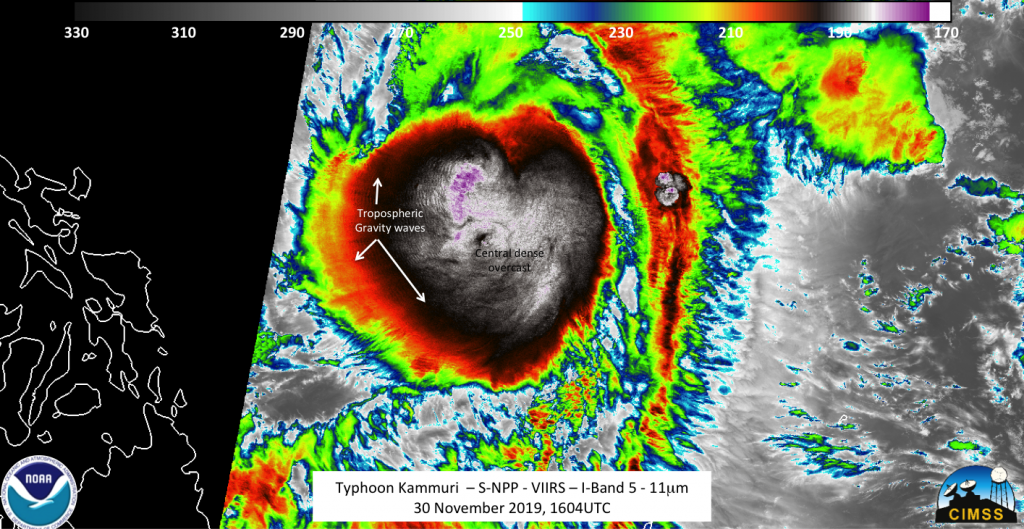
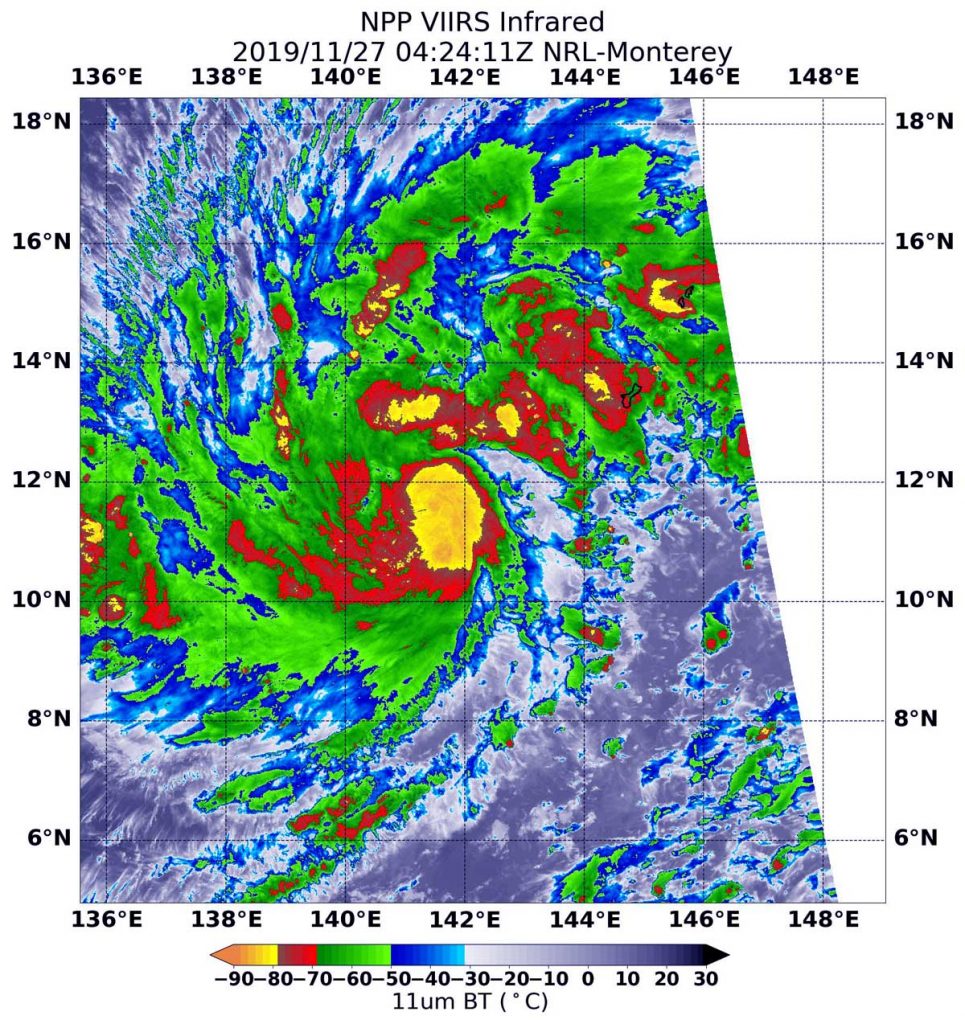
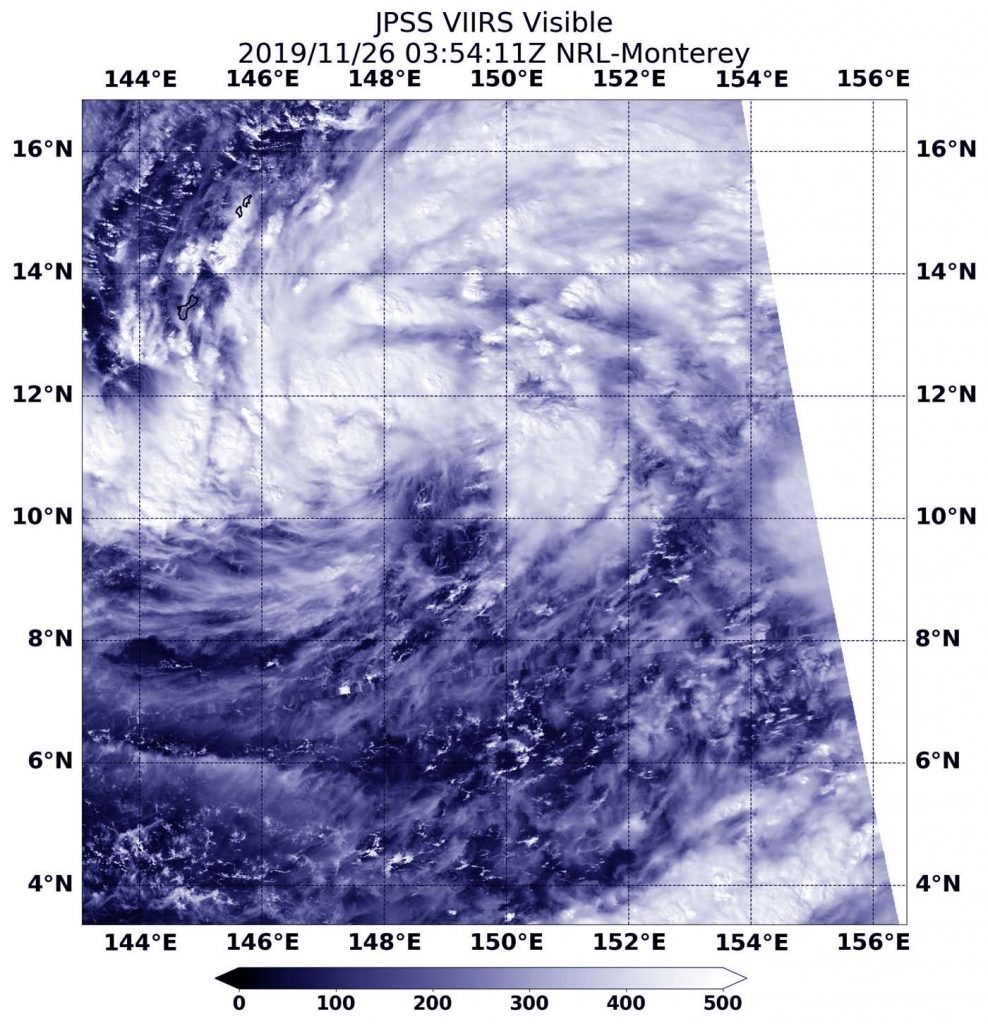
During this period, the GPM core satellite overflew the storm.  The first image was taken at on Nov. 29, 2019 at 1:27 p.m. EST (18:27 UTC/Nov. 30, 2019 at 3:27 a.m. local Palau Time, PWT) and shows surface rain rates within Kammuri from the GPM Dual-polarization Radar (DPR) when the storm was about 800 miles east of the Philippines.  At the time, Kammuri was a Category 1 typhoon with sustained winds estimated at 85 mph by the Joint Typhoon Warning Center (JTWC).

GPM, a satellite managed by both NASA and the Japan Aerospace Exploration Agency, showed areas of moderate to heavy rain organized into loose bands rotating around the northern and western side of the storm.  The eye, which is located along the right side of the image, was identifiable by the curvature in the inner rain bands, but the eyewall itself appeared rather weak.  These features are consistent with Kammuri having a well-developed though not yet powerful circulation. That would change over the next few days as Kammuri began to approach the Philippines.

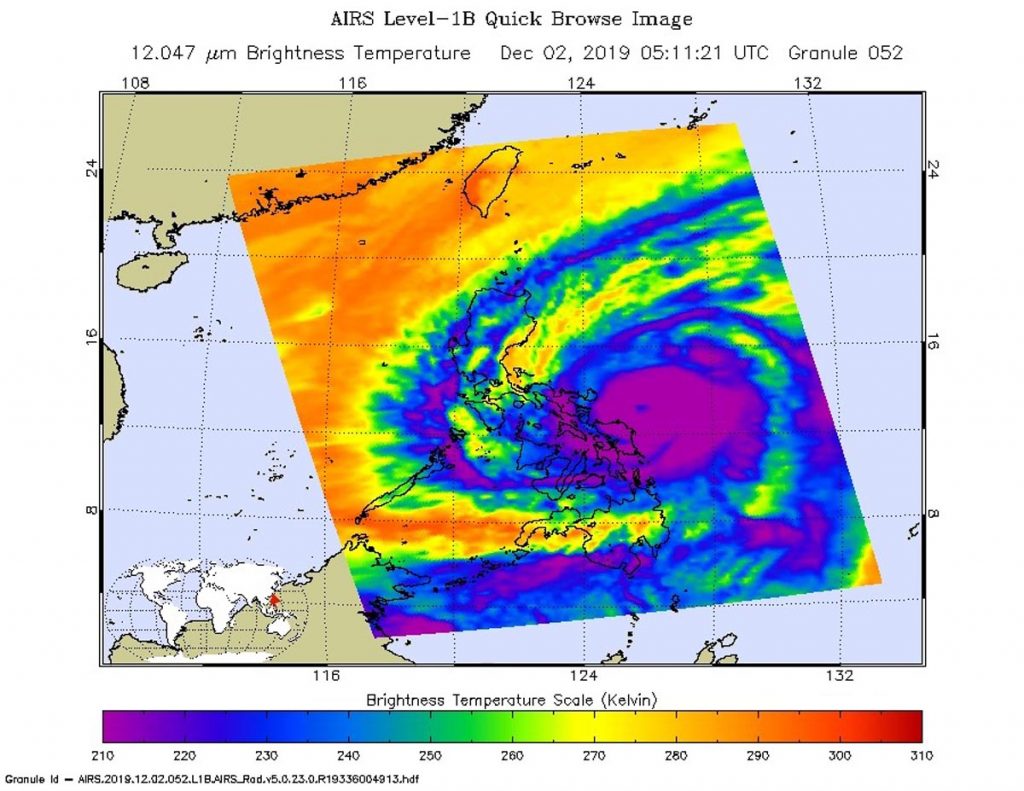
Initially, Kammuri weakened slightly after the time of the GPM overpass, but then on the evening of December 1 (local time), the storm began a rapid deepening cycle and intensified from a Category 1 typhoon with sustained winds estimated at 80 mph by JTWC at 12:00 UTC (7 a.m. EST/9:00 pm PWT) on the Dec. 1 to a Category 4 storm with sustained winds of 130 mph just 24 hours later.  It was at this time that Kammuri made its first landfall in the Philippines around 11:00 p.m. local time near Gubat in the Bicol region in the Province of Sorsogon along the southeastern tip of Luzon.

As it continued on westward through the central Philippines, Kammuri weakened, crossing the island of Mindoro as a Category 2 storm before exiting the Philippines into the eastern South China Sea.

IMERG Finds Heavy Rains in the Philippines

In addition to its powerful winds, Kammuri brought heavy rains to the Philippines.  IMERG, the Integrated Multi-satellitE Retrievals for GPM, is a unified satellite precipitation product produced by NASA to estimate surface precipitation over most of the globe.  IMERG is managed at NASA’s Goddard Space Flight Center in Greenbelt, Md.

With IMERG, precipitation estimates from the GPM core satellite are used to calibrate precipitation estimates from microwave and infrared sensors on other satellites to produce half-hourly precipitation maps at 0.1o horizontal resolution.

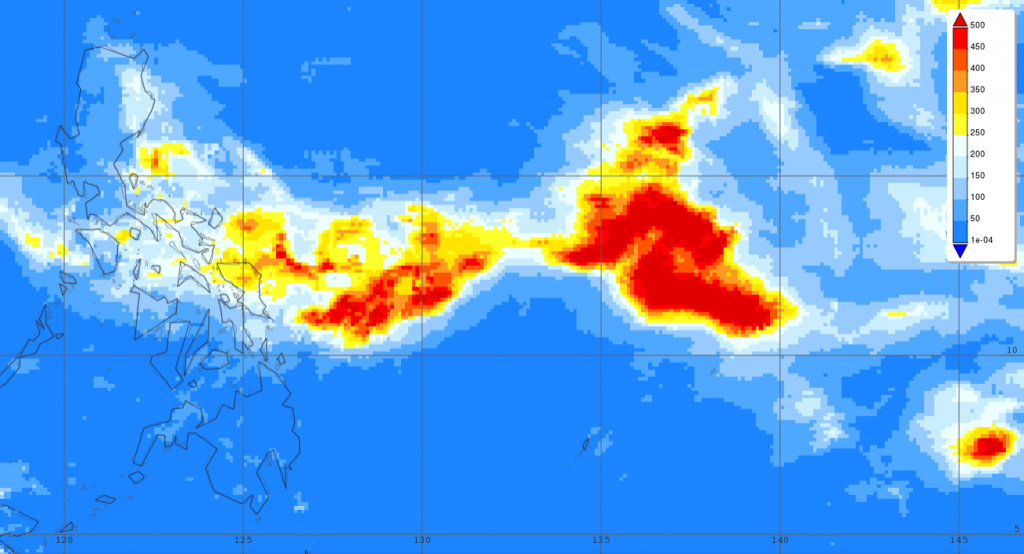
IMERG surface rainfall accumulations for the period from Nov. 25 through Dec. 3 for the Philippines and the surrounding region from the time when Kammuri first became a tropical depression southeast of Guam until it had passed over Mindoro and into the South China Sea.  The heaviest rains associated with Kammuri by far are off shore, especially over the central Philippine Sea where the cyclone stalled for a period producing rainfall totals well over 500 mm (~20 inches).

Over land, most of the central Philippines, including southern Luzon, received on the order of 150 mm or more (over 6 inches) with the highest amounts over the northern half of the island of Samar where rainfall totals are on the order of 250 to 350 mm (~10 to 14 inches).

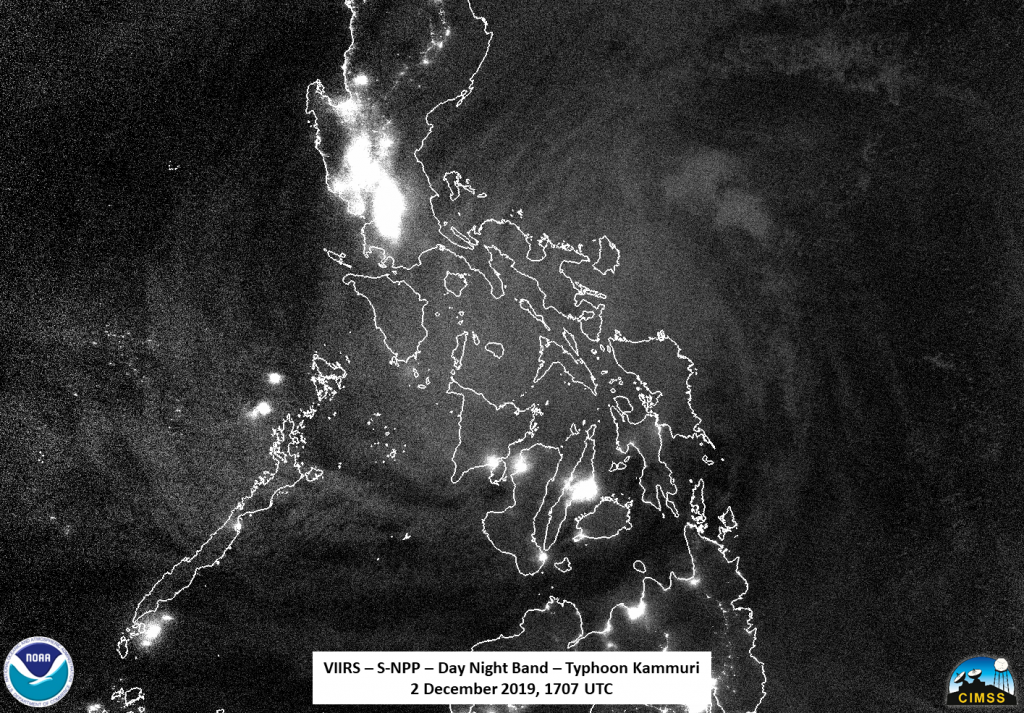
So far, Kammuri is being blamed for up to 17 fatalities in the Philippines.  After leaving the Philippines, Kammuri weakened significantly and is expected to weaken even further and dissipate as the cyclone is sheared apart and driven southward by the northeast monsoon.

Kammuri’s Status on Dec. 5

On Dec. 5 at 4 a.m. EST (0900 UTC), Tropical Storm Kammuri was in the South China Sea and was dealing with adverse atmospheric conditions, which were weakening the storm. It  was centered near latitude 13.8 degrees north and longitude 113.7 degrees east, about 340 nautical  miles east-southeast of Da Nang, Vietnam. Kammuri was moving to the southwest and had maximum sustained winds near 35 knots (40 mph/65 kph), making it a Category 1 tropical storm.

Kammuri continues to weaken and is expected to dissipate soon.

By Steve Lang
NASA’s Goddard Space Flight Center

Kammuri – Northwestern Pacific Ocean

Dec. 04, 2019 – Suomi NPP Satellite Finds Kammuri Weakening in South China Sea

NASA-NOAA’s Suomi NPP satellite passed over the South China Sea and provided forecasters with a visible image of Tropical Storm Kammuri on Dec. 4.

Suomi NPP image of Kammuri
NASA-NOAA’s Suomi NPP satellite provided two visible images of Kammuri on Dec. 4 that were combined at NASA’s Goddard Space Flight Center in Greenbelt, Md. to show the entire storm. The combined VIIRS image showed that Kammuri’s center of circulation was almost in the center of the South China Sea, while a tail of clouds streamed over Luzon, the northern Philippines and north to Taiwan. Credit: NASA Worldview, Earth Observing System Data and Information System (EOSDIS)

The Visible Infrared Imaging Radiometer Suite (VIIRS) instrument aboard Suomi NPP provided two visible images of Kammuri on Dec. 4 that were combined at NASA’s Goddard Space Flight Center in Greenbelt, Md. to show the entire storm. NASA Worldview, Earth Observing System Data and Information System (EOSDIS) provided the image. The combined VIIRS image showed that Kammuri’s center of circulation was almost in the center of the South China Sea, while a tail of clouds streamed over Luzon, the northern Philippines and north to Taiwan.

Visible imagery from NASA satellites helps forecasters understand if a storm is organizing or weakening by the storm’s shape. NASA-NOAA’s Suomi NPP satellite showed that the storm appears to be elongating, indicating it is weakening.

On Dec. 4 at 10 a.m. EST (1500 UTC), Kammuri’s maximum sustained winds were near 40 knots (46 mph/74 kph) and weakening. Tropical Storm Kammuri (Philippines designation Tisoy) was centered near latitude 14.4 degrees north and longitude 115.7 degrees east. That is about 285 nautical miles west of Manila, Philippines. Kammuri has moved far enough away from the Philippines that all warnings have been dropped.

Kammuri is weakening as it moves west through the South China Sea. The Joint Typhoon Warning Center forecasts Kammuri to turn south-southwest and dissipate by December 6.

Tropical cyclones and hurricanes are the most powerful weather events on Earth. NASA’s expertise in space and scientific exploration contributes to essential services provided to the American people by other federal agencies, such as hurricane weather forecasting.

By Rob Gutro 
NASA’s Goddard Space Flight Center

Kammuri – Northwestern Pacific Ocean

Dec. 03, 2019 – NASA Catches Typhoon Kammuri Post Landfall

NASA-NOAA’s Suomi NPP or S-NPP satellite provided infrared and night-time imagery of Typhoon Kammuri shortly after it made landfall in the Philippines.

Suomi NPP infrared image of Kammuri
NASA-NOAA’s S-NPP satellite provided an infrared image of Typhoon Kammuri on Dec. 2 at 12:07 p.m. EST (1707 UTC) that showed the eye near Gubat, Sorsogon, the southeastern part of Luzon. A wide, thick band of powerful thunderstorms (red) circled the entire eye, where cloud top temperatures were as cold as or colder than 210 Kelvin (minus 81.6 degrees Fahrenheit/minus 63.1 degrees Celsius). NASA research has shown that cloud top temperatures that cold or colder have the ability to generate heavy rainfall. The strongest storms were west and southwest of center where cloud tops were as cold (black) as 119 Kelvin (minus 117.6 degrees Fahrenheit/minus 83.1 degrees Celsius). Credit: NOAA/NASA/UWM-CIMSS-SSEC/William Straka III

On Dec 2 at 7 a.m. EST (1200 UTC) Kammuri, known as Tisoy in the Philippines, had maximum sustained winds near 115 knots (132 mph), and that made it a Category 4 hurricane on the Saffir Simpson Hurricane Wind Scale.

Per the 10 a.m. EST (1500 UTC) bulletin from the Philippine Atmospheric, Geophysical and Astronomical Services Administration (PAGASA), at 11 p.m. PHT, Philippine  Standard Time. Kammuri (Tisoy) made landfall near Gubat, Sorsogon which is located in the extreme southeastern part of Luzon, Philippines

Views of a Typhoon from NASA Satellites

NASA-NOAA’s Suomi NPP or S-NPP satellite saw Typhoon Kammuri on Dec. 2 at 12:07 p.m. EST (1707 UTC). Infrared and nighttime images were created by William Straka III, Researcher at the University of Wisconsin – Madison, Space Science and Engineering Center (SSEC), Cooperative Institute for Meteorological Satellite Studies (CIMSS). The infrared image showed the eye of Kammuri (Tisoy) near Gubat, Sorsogon, in the southeastern part of Luzon. A thick,wide band of powerful thunderstorms circled the entire eye, where cloud top temperatures were as cold as or colder than 210 Kelvin (minus 81.6 degrees Fahrenheit/minus 63.1 degrees Celsius). NASA research has shown that cloud top temperatures that cold or colder have the ability to generate heavy rainfall.

Straka noted that several prominent features include tropospheric gravity waves along with multiple overshooting cloud tops. In addition, there were also some mesospheric gravity waves. Infrared data revealed coldest temperatures of cloud tops were as cold as 119 Kelvin (minus 117.6 degrees Fahrenheit/minus 83.1 degrees Celsius) in the western and southwestern quadrants of the storm. Those were the most powerful storms that likely produced the highest rainfall rates.

Suomi NPP nighttime image of Kammuri
NASA-NOAA’s S-NPP satellite provided an infrared image of Typhoon Kammuri on Dec. 2 at 12:07 p.m. EST (1707 UTC) that showed the eye near Gubat, Sorsogon, in southeastern part of Luzon. City lights could be seen to the north and south of the storm, in Northern Luzon, Western and Central Visayas regions, and Northern Mindanao. The eastern Visayas and Bicol regions were covered by Kammuri’s clouds. Credit: NOAA/NASA/UWM-CIMSS-SSEC/William Straka III

In the nighttime image from the S-NPP satellite, Kammuri’s eye was visible near Gubat, Sorsogon, in southeastern Luzon. City lights could be seen to the north and south of the storm, in Northern Luzon, Western and Central Visayas regions, and Northern Mindanao. The eastern Visayas and Bicol regions were covered by Kammuri’s clouds.

On Dec. 2 at 12:11 a.m. EST (0511 UTC), the Atmospheric Infrared Sounder or AIRS instrument aboard NASA’s Aqua satellite provided a look at the cloud top temperatures in Typhoon Kammuri. A thick, wide band of powerful thunderstorms (red) circled the entire eye, where cloud top temperatures were as cold as or colder than 210 Kelvin (minus 81.6 degrees Fahrenheit/minus 63.1 degrees Celsius), which confirmed the Suomi NPP satellite data.

AIRS image of Kammuri
On Dec. 2 at 12:11 a.m. EST (0511 UTC), the Atmospheric Infrared Sounder or AIRS instrument aboard NASA’s Aqua satellite provided a look at the cloud top temperatures in Typhoon Kammuri. A thick, wide band of powerful thunderstorms (red) circled the entire eye, where cloud top temperatures were as cold as or colder than 210 Kelvin (minus 81.6 degrees Fahrenheit/minus 63.1 degrees Celsius), which confirmed the Suomi NPP satellite data. Credit: NASA JPL/Heidar Thrastarson

Warnings in Effect on Dec. 3, 2019

PAGASA continues to track Kammuri in order to assess the impacts on the various islands in the path of the storm.  On Dec. 3, PAGASA maintained the following warnings.

Tropical Cyclone Wind Signal number 3 was in effect for Luzon: Northern Occidental Mindoro, Lubang Island.

Tropical Cyclone Wind Signal number 2 was in effect for Luzon: Oriental Mindoro, Batangas, rest of Occidental Mindoro, Marinduque, Cavite, Laguna, Rizal, Bataan, Metro Manila, southern Bulacan, southern Pampanga, southern Zambales, Calamian Islands, and western parts of Quezon.

Tropical Cyclone Wind Signal number 1 was in effect for Luzon: Northern parts of Camarines Sur, southern Neuva Ecija, southern Aurora, northern parts of Palawan, Cuyo Islands, rest of Quezon, rest of Camaines Sur, rest of Zambales, rest of Pampanga and rest of Bulacan. In addition, Signal 1 was in effect for Visayas: Northern Aklan and northern Antique.

Status of Kammuri (Tisoy) on Dec. 3

On Dec. 3, 2019 at 10 a.m. EST (1500 UTC) Typhoon Kammuri (Tisoy) was located near latitude 13.2 degrees north, and longitude 120.1 degrees east,  about 99 nautical miles south-southwest of Manila, Philippines.  Kammuri is moving west and had maximum sustained winds of 80 knots (92 mph/148 kph). 

Typhoon Kammuri continues to weaken as it emerges on the western edges of the Philippine archipelago. The storm is forecast to turn to the east-northeast and is expected to quickly turn to the south-southwest and dissipate.

For updated forecasts from PAGASA, visit: www.pagasa.dost.gov.ph

By Rob Gutro
NASA’s Goddard Space Flight Center

Kammuri – Northwestern Pacific Ocean

Dec. 02, 2019 – Satellite Imagery shows Typhoon Kammuri’s Center Obscured

NASA-NOAA’s Suomi NPP or S-NPP satellite passed over the Philippine Sea in the Northwestern Pacific Ocean and found Typhoon Kammuri’s eye obscured.

Suomi NPP infrared image of Kammuri
NASA-NOAA’s Suomi NPP satellite saw Typhoon Kammuri on Nov. 30 at 1:04 p.m. EST (1604 UTC) showed a large central dense overcast (CDO) that would obscure the low-level circulation. Infrared data revealed temperatures of cloud tops (black) were as cold as 119 Kelvin (minus 117.6 degrees Fahrenheit/minus 83.1 degrees Celsius). Credit: NOAA/NASA/UWM-CIMSS-SSEC/William Straka III

Since Kammuri has now entered the Philippine Area of Responsibility, defined by the World Meteorological Organization, the Philippine Atmospheric, Geophysical and Astronomical Services Administration (PAGASA), it has been assigned a parallel name of “Tisoy.” The rational is that it is felt that Filipinos will respond more to familiar names and that it helps to underscore that these named weather disturbances pose a direct threat to the country.  However, for the purposes of these discussions, the international recognized name designated by the Regional Specialized Meteorological Center (RSMC) Tokyo –Kammuri–will be used.

The Philippine Atmospheric, Geophysical and Astronomical Services Administration (PAGASA) continues to track Kammuri in order to assess the impacts on the various islands in the path of the storm. In anticipation of the storm, PAGASA has continued to issue flood alerts to various locations. This is especially important due to the fact most of the population is along the coast and in low-lying areas.

NASA-NOAA’s S-NPP satellite saw Typhoon Kammuri on Nov. 30 at 1:04 p.m. EST (1604 UTC) on the extreme western side of the pass for the satellite. Imagery continued to show a large central dense overcast (CDO) that would obscure the low-level circulation.

The CDO of a tropical cyclone is the large central area of thunderstorms surrounding its circulation center. It is caused by the formation of its eyewall. It can be round, angular, oval, or irregular.

Terra image of Kammuri
On Dec. 2, visible imagery from the MODIS instrument aboard NASA’s Terra satellite showed that Kammuri’s eye continued to be covered by clouds. The western quadrant of Kammuri was already over the eastern central Philippines. Credit: NASA Worldview

Several prominent features in the CDO include tropospheric gravity waves along with multiple overshooting tops. In addition, while this normally would be in the “noisy” part of the scene for the Day Night Band on S-NPP, there was still enough signal from the airglow (the moon was at waxing crescent with 16% illumination) to see mesospheric gravity waves along with a single lone lightning streak within the CDO. Infrared data revealed temperatures of cloud tops were as cold as 119 Kelvin (minus 117.6 degrees Fahrenheit/minus 83.1 degrees Celsius).

On Dec. 2, visible imagery from the Moderate Resolution Imaging Spectroradiometer or MODIS instrument aboard NASA’s Terra satellite showed that Kammuri’s eye continued to be covered by clouds. The western quadrant of Kammuri was already over the eastern central Philippines.

On Dec. 2, 2019 at 4 a.m. EST (0900 UTC) Typhoon Kammuri (Tisoy in the Philippines) was located near latitude 13.0 degrees north, and longitude 125.6 degrees east, about 285 nautical miles east-southeast of Manila, Philippines.  Kammuri (Tisoy) is moving west and had maximum sustained winds 105 knots (121 mph/193 kph).

At 7 a.m. EST (1200), PAGASA raised 3 warning signals on Dec. 2. Tropical Cyclone Wind Signal number 3 is in effect for Luzon: Catanduanes, Camarines Sur, Albay, Sorsogon, southern portion of Camarines Norte, Masbate including Ticao and Burias Islands, Romblon, and southern portion of Quezon. In the central Philippines, it is in effect for the region of Visayas: Northern Samar, northern portion of Eastern Samar (Can-avid, Dolores, Maslog, Oras, Arteche, Jipapad, San Policarpio), and northern portion of Samar.

Tropical Cyclone Wind Signal number 2 is in effect in the northern Philippines for the region of Luzon: Metro Manila, Bulacan, Bataan, Tarlac, Pampanga, Nueva Ecija, southern Aurora, Cavite, Batangas, Laguna, Rizal, rest of Quezon including Polillo Islands, Oriental Mindoro, Occidental Mindoro, Marinduque, rest of Camarines Norte, Calamian Islands, southern portion of Zambales, In Visayas the signal covers: the rest of Eastern Samar, rest of Samar, Biliran, Aklan, Capiz, northern portion of Antique, northern portion of Iloilo, northern portion of Negros Occidental, Northern Cebu, and northern portion of Leyte.

Tropical Cyclone Wind Signal number 1 is in effect in the northern Philippines for the region of Luzon: Southern Isabela, Mountain Province, Ifugao, Benguet, Nueva Vizcaya, Ilocos Sur, La Union, Pangasinan, Quirino, rest of Aurora, and rest of Zambales. In Visayas: Rest of Antique, rest of Iloilo, Guimaras, rest of Negros Occidental, Metro Cebu, rest Leyte, and Southern Leyte. And in the region of Mindanao it is in effect for: Dinagat Islands and Siargao Island

Kammuri is moving in a westerly direction as it approaches the eastern Philippines. The Joint Typhoon Warning Center expects that the storm will strengthen slightly today, Dec. 2, but will then start to weaken. The typhoon is then expected to turn east-northeast as it passes through the Philippine archipelago, but will then veer southwest, weaken and dissipate.

For updated forecasts from PAGASA, visit: www.pagasa.dost.gov.ph

By William Straka III/ Rob Gutro
University of Wisconsin – Madison-SSEC-CIMSS
NASA’s Goddard Space Flight Center

Kammuri – Northwestern Pacific Ocean

Nov. 28, 2019 – NASA-NOAA Satellite Analyzes a Strengthening Typhoon Kammuri

NASA-NOAA’s Suomi NPP satellite provided forecasters with infrared and nighttime views of Typhoon Kammuri that showed the storm continued to strengthen. Satellite imagery provided a look at the clouds and storms over the storm’s developing eye.

Suomi NPP infrared image of Kammuri
The Visible Infrared Imaging Radiometer Suite (VIIRS) instrument aboard NASA-NOAA’S Suomi NPP provided an infrared image of Kammuri on Nov. 28 at 1:39 p.m. EST (1639 UTC) that shows it is consolidating and strengthening. The circulation center was obscured by the central dense overcast. Credit: NASA/NOAA/UWM-SSEC-CIMSS, William Straka III

Visible, infrared and microwave imagery from NASA satellites help forecasters understand if a storm is organizing or weakening. The Visible Infrared Imaging Radiometer Suite (VIIRS) instrument aboard NASA-NOAA’S Suomi NPP provided an infrared and nighttime image of Kammuri on Nov. 28 at 1:39 p.m. EST (1639 UTC) that shows it is consolidating and strengthening. The circulation was obscured by the central dense overcast or CDO. CDO is a large central area of thunderstorms surrounding its circulation center, caused by the formation of its eyewall. It can be round, angular, oval, or irregular in shape.

Suomi NPP found a noticeable increase in the size of the CDO, perhaps an indication of some strengthening of the storm.

William Straka III, a researcher at the University of Wisconsin, Madison, Space Science and Engineering Center’s Cooperative Institute for Meteorological Satellite Studies used the satellite data to create imagery. Straka said, “Collocated observations of the location of the CDO and microwave imagery are important to help measure the intensity of a tropical cyclone, by seeing how far the center of circulation is within the storm and the temperature difference in the cloud tops in the CDO. Since microwave imagers can see ‘into the cloud,’ this helps in determining the location of the tropical system.”

Suomi NPP nighttime imagery of Kammuri
The Visible Infrared Imaging Radiometer Suite (VIIRS) instrument aboard NASA-NOAA’S Suomi NPP provided a night-time image of Kammuri on Nov. 28 at 1:39 p.m. EST (1639 UTC). Credit: NASA/NOAA/UWM-SSEC-CIMSS, William Straka III

Straka also noted “However, an important thing to note is that the circulation in one satellite channel is not completely surrounded by the convection.”

 At 7 p.m. CHST, local time, Guam (4 a.m. EST/0900 UTC) on Nov. 29, the National Weather Service in Tiyan, Guam noted that the center of typhoon Kammuri was located near latitude 14.5 degrees north and longitude 137.3 degrees east. That puts the eye of Kammuri about 350 miles north-northwest of Ulithi, 350 miles north of Yap, 395 miles north-northwest of Fais and 505 miles west of Guam.

Kammuri is moving west-northwest at 7 mph. It is expected to make a turn toward the west-southwest with a slight increase in forward speed over the next 24 hours. Maximum sustained winds have increased to 85 mph. Kammuri is forecast to maintain this intensity through Saturday, Nov. 30. Typhoon force winds extend outward from the center up to 35 miles. Tropical storm force winds extend outward from the Center up to 145 miles.

The forecast track for Kammuri takes the storm due west toward the Philippines. The forecast from Joint Typhoon Warning Center has Kammuri intensifying to about 125 knots (144 mph/232 kph) by December 1, 2019, which would be the equivalent to a Category 4 storm in the Atlantic. The storm is expected to make landfall in the central and northern Philippines on Dec. 3.

Typhoons and hurricanes are the most powerful weather event on Earth. NASA’s expertise in space and scientific exploration contributes to essential services provided to the American people by other federal agencies, such as hurricane weather forecasting.

For updated forecasts. Visit: https://www.weather.gov/gum/Cyclones

By Rob Gutro 
NASA’s Goddard Space Flight Center

Kammuri – Northwestern Pacific Ocean

Nov. 27, 2019 – NASA-NOAA Satellite Finds Tropical Storm Kammuri Strengthening

NASA-NOAA’s Suomi NPP satellite passed over Tropical Storm Kammuri in the Northwestern Pacific Ocean and found several areas of very strong thunderstorms.

Suomi NPP image of Kammuri
NASA-NOAA’s Suomi NPP satellite passed over Tropical Storm Kammuri in the Northwestern Pacific Ocean and the VIIRS instrument aboard captured this image of the storm on Nov. 27 at 0424 UTC (Nov. 26 at 11:24 p.m. EST). There were several areas (yellow) within where cloud top temperatures were as cold as minus 80 degrees Fahrenheit (minus 62.2 Celsius), indicating powerful storms. Credit: NASA/NRL

The Visible Infrared Imaging Radiometer Suite (VIIRS) instrument aboard Suomi NPP provided an infrared image of the storm on Nov. 27 at 0424 UTC (Nov. 26 at 11:24 p.m. EST). Infrared imagery reveals cloud top temperatures, and the higher the cloud top, the colder it is, and the stronger the storm.

The VIIRS instrument found several areas within where cloud top temperatures were as cold as minus 80 degrees Fahrenheit (minus 62.2 Celsius), indicating powerful storms. Kammuri continued to strengthen and consolidate. The most powerful thunderstorms were located around the center of circulation and in a fragmented band of thunderstorms north of the center. Storms with cloud tops that cold have been found to generate heavy rainfall.

At 4 a.m. EST (0900 UTC7 p.m. CHST, Guam local time) on Nov. 27,  the National Weather Service in Tiyan, Guam noted the center of Tropical Storm Kammuri was located near latitude 11.7 degrees north and longitude 140.6 degrees east. Kammuri is centered about 130 miles north-northeast of Ulithi, 135 miles north of Fais, 230 miles northeast of Yap and about 310 miles west-southwest of Guam.

Guam, Rota, Tinian, and Saipan are no longer under a Tropical Storm Warning. However, a flash flood watch remains in effect for Guam and the Northern Marianas.

Kammuri is moving west at 16 mph. It is expected to make a turn toward the north-northwest with a decrease in forward speed over the next 24 hours. Maximum sustained winds remain at 65 mph. Tropical storm force winds extend outward from the center up to 240 miles to the northeast and up to 155 miles elsewhere.

Kammuri is forecast to intensify through Thursday possibly becoming a typhoon. It is also forecast to turn north and then head west after two days toward the Philippines.

Typhoons and hurricanes are the most powerful weather event on Earth. NASA’s expertise in space and scientific exploration contributes to essential services provided to the American people by other federal agencies, such as hurricane weather forecasting.

For updated forecasts, visit:  https://www.weather.gov/gum/

By Rob Gutro 
NASA’s Goddard Space Flight Center

Kammuri – Northwestern Pacific Ocean

Nov. 26, 2019 – Satellite Tracking Guam’s Tropical Storm Kammuri

The National Weather Service in Guam has posted warnings as Tropical Storm Kammuri lingers nearby. The NOAA-20 satellite provided forecasters with an image of the storm.

NOAA-20 image of Kammuri
NOAA-20 provided a visible image of Kammuri on Nov. 26 at 0354 UTC (Nov. 25 at 10:54 p.m. EST) that shows it is consolidating and strengthening. The image showed bands of thunderstorms wrapping into its low level center. Credit: NOAA /NRL

Tropical Depression 29W formed on Nov. 25, and when it strengthened into a tropical storm on Nov. 26 it was renamed Kammuri.

Visible imagery from NASA satellites help forecasters understand if a storm is organizing or weakening. The Visible Infrared Imaging Radiometer Suite (VIIRS) instrument aboard NOAA-20 provided a visible image of Kammuri on Nov. 26 at 0354 UTC (Nov. 25 at 10:54 p.m. EST) that shows it is consolidating and strengthening.  The image showed bands of thunderstorms wrapping into its low level center.

On Nov. 26 (and Nov. 27 local time), a tropical storm warning remains in effect for Guam, Rota, Tinian and Saipan. Tropical storm conditions, including winds of 39 mph or more, are occurring and will persist through noon (local time on Nov. 27) today.

On Nov. 26 at 10 a.m. EST (1500 UTC/1 a.m. CHST on Nov. 27) The National Weather Service in Tiyan, Guam noted that the “center of Tropical Storm Kammuri was located near latitude 11.4 degrees north and longitude 144.4 degrees east. Kammuri is moving west at 24 mph. Kammuri will maintain this motion through tonight [Wed. Nov. 27 local time], then turn toward the northwest on Thursday. Kammuri will decrease in forward speed tonight. Maximum sustained winds have increased to 45 mph. Kammuri is forecast to intensify in the next few days and could become a typhoon on Thursday. Kammuri will be well west of the Marianas.” The storm is at its closest to Guam now.

Kammuri is forecast to move west-northwest, later northwest and strengthen into a typhoon.

NASA launched JPSS-1 in Nov. 2017. JPSS-1 reached polar orbit on Saturday, November 18, and it officially became known as NOAA-20. JPSS-1 joined the NOAA/NASA Suomi NPP satellite in the same polar orbit, and will also provide scientists with observations of atmospheric temperature and moisture, clouds, sea-surface temperature, ocean color, sea ice cover, volcanic ash, and fire detection.

Typhoons and hurricanes are the most powerful weather event on Earth. NASA’s expertise in space and scientific exploration contributes to essential services provided to the American people by other federal agencies, such as hurricane weather forecasting.

For updated forecasts. visit: https://www.weather.gov/gum/Cyclones

By Rob Gutro 
NASA’s Goddard Space Flight Center