Sep. 01, 2020 – NASA’s IMERG Analyzed Heavy Rains from Hurricanes Laura and Marco
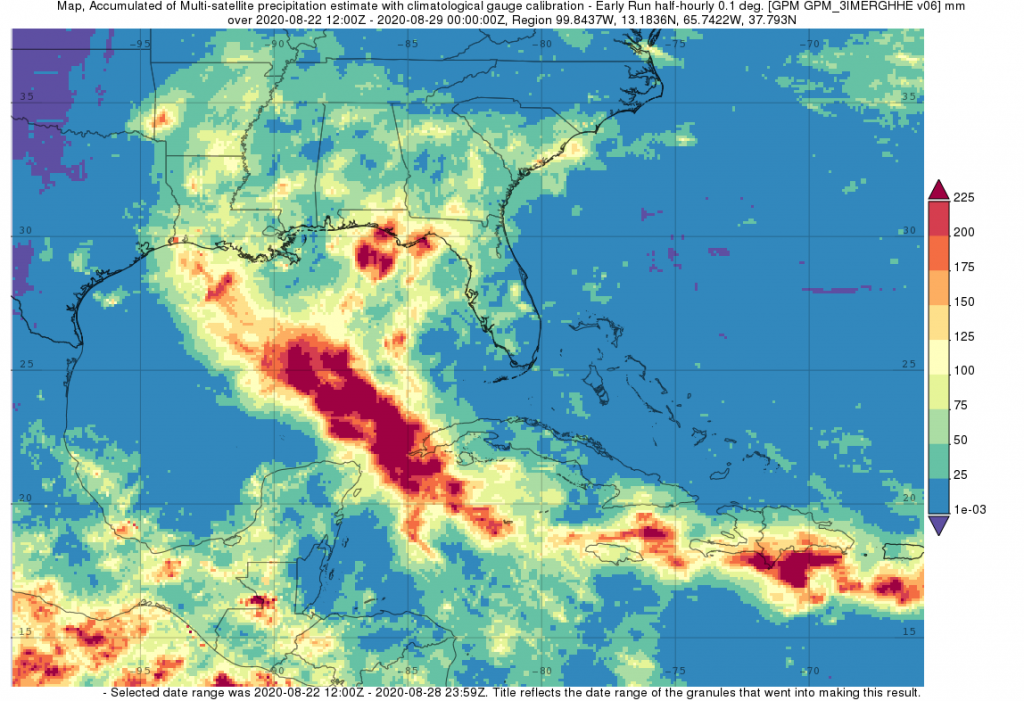
The northern Gulf Coast, specifically Louisiana, saw two tropical cyclones make landfall in the same week just days apart. NASA’s IMERG surface rainfall accumulations were calculated for the period 22 to 27 August 2020 for both Hurricanes Marco and Laura. The two systems, however, could not have been more different when they arrived.
Marco’s History and Track
Despite forming a day later, Marco was the first system to make landfall on the Gulf Coast. Marco originated from a tropical easterly wave that was moving from the central to the western Caribbean. After becoming a tropical depression (TD) on August 20, TD #14 turned northwestward the following day as it approached the coast of Central America and moved into the northwest Caribbean.
According to the National Hurricane Center (NHC), TD #14 reached tropical storm intensity on the night of the 21st and named Marco. Marco remained over warm open water as it passed through the Yucatan Straight and into the Gulf of Mexico on the afternoon of the 22nd. Marco was now a strong tropical storm with sustained winds reported at 65 mph by NHC and seemed poised to intensify.
However, the warm waters were offset by the effects of southwesterly wind shear, which were to become a major inhibiting factor as Marco moved through the Gulf of Mexico.
Although the wind shear kept Marco from really intensifying, the warm Gulf waters supported enough convection for Marco to reach hurricane intensity around midday on Sunday the 23rd. By now Marco was in the central Gulf and moving north between a ridge of high pressure to the east and an upper-level trough over the western Gulf. However, as Marco continued northward the wind shear increased, pushing the thunderstorms that were fueling the system along with most of the rain away from the center off to the northeast, causing Marco to weaken back down to a tropical storm that very same evening.
On the 24th, as it neared the northern Gulf Coast, Marco continued to weaken and slow down as high pressure to the east built westward, blocking Marco’s path and forcing the cyclone to turn westward. The center of circulation just made landfall near the mouth of the Mississippi at 6:00 pm CDT on Monday the 24th with sustained winds reported at 40 mph by NHC before being shunted westward back over open water and weakening further. By now, the center was essentially devoid of thunderstorms with the bulk of the rain falling well east of the center.
NASA Rainfall Accumulations on Marco
IMERG surface rainfall accumulations were compiled for the period 22 to 27 August 2020 for the southeastern U.S., Gulf of Mexico, the northwest Caribbean and adjacent regions. Accumulations include the effects from both Laura and Marco. However, the rainfall due to Marco is evidenced by its north-south orientation and generally extends from the west-central Caribbean up through the Yucatan Strait and the eastern Gulf of Mexico and into the Florida Panhandle.
The heaviest rainfall totals due to Marco were just offshore and along the coast of the Florida Panhandle and reached up to 225 mm (~9 inches, shown in dark red) while a good portion of the Florida Panhandle is estimated to have received at least 75 to 100 mm (~3 to 4 inches, shown in bright green and yellow). Rainfall totals near the mouth of the Mississippi where the center made landfall are much lower and reflects the storm’s asymmetric structure due to the strong wind shear where most of the thunderstorms and associated rainfall occurred well northeast of the center.
Laura’s History and Track
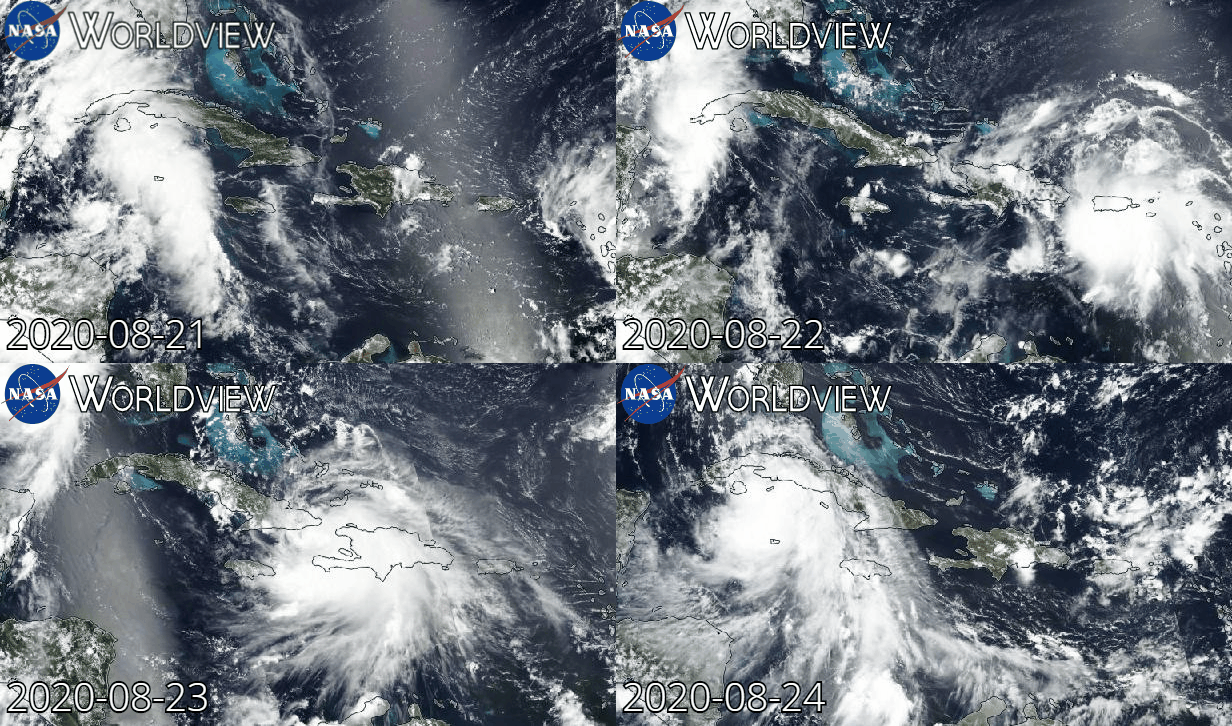
Laura too originated from an easterly wave but began as TD #13 well out into the central tropical Atlantic on the night of August 19. Over the next couple of days, despite passing over warm water, TD #13 was held in check by a combination of mid-level wind shear and dry air that kept the system poorly organized. However, as it neared the Leeward Isles on the 21st, it finally reached minimum tropical storm intensity and named Laura.
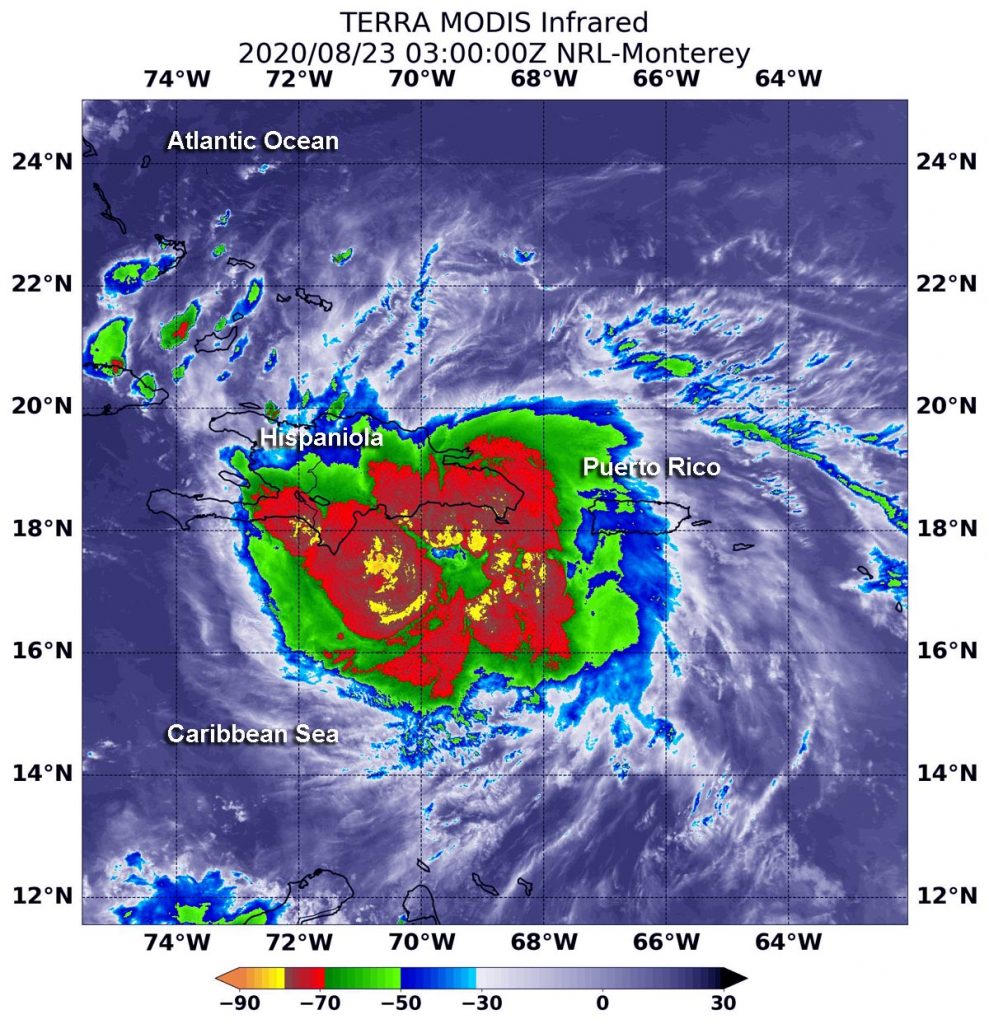
Laura then passed through the Leeward Islands as a weak tropical storm later that same day. As it approached Puerto Rico on the 22nd, Laura was still unorganized, and although the wind shear abated, Laura was now inhibited by its close proximity to land. After passing very near the southwest coast of Puerto Rico, Laura crossed directly over the island of Hispaniola on the night of the 22nd; however, despite being over land, Laura continued to generate deep convection and emerged off the west coast of Haiti with sustained winds reported at 50 mph by NHC on the morning of the 23rd.
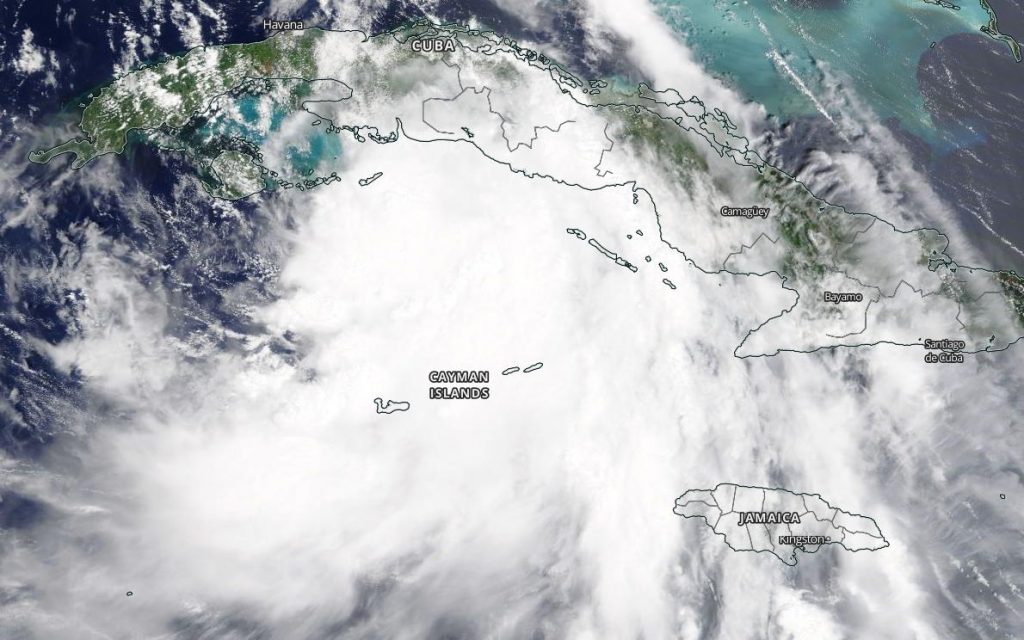
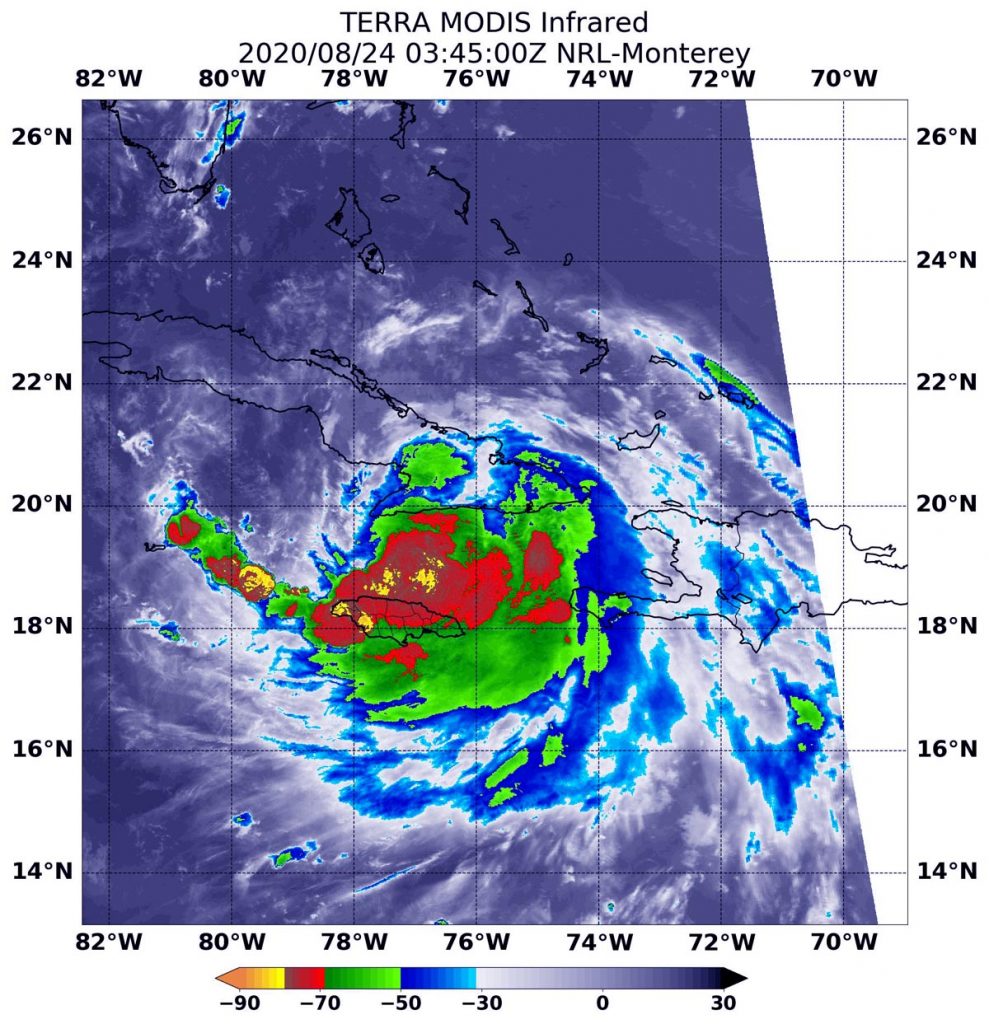
Laura gained a little strength before crossing over southeastern Cuba on the night of the 23rd; again, despite being over land, Laura continued to tap into the warm waters off the south coast of Cuba and actually intensified slightly. On the morning of the 24th, Laura re-emerged over open water south of Cuba.
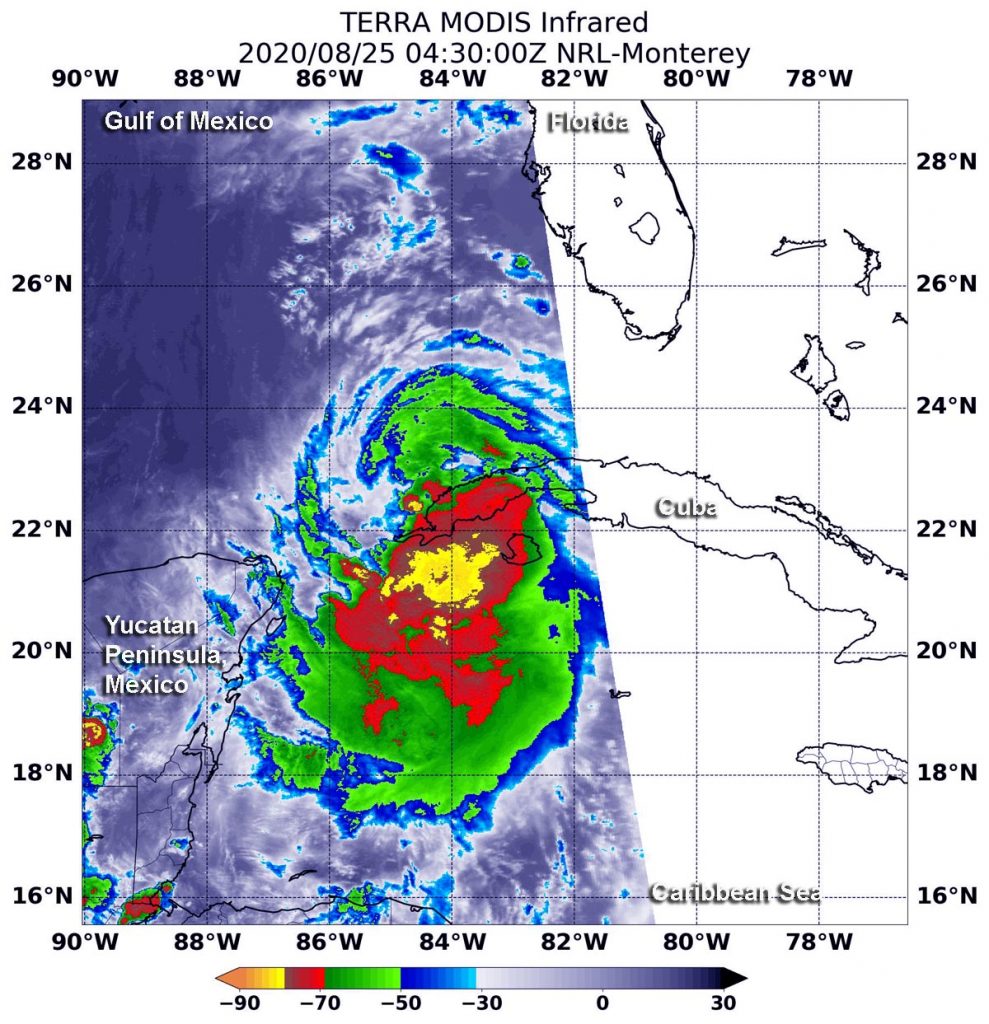
At this point, another key factor came into play. The ridge of high pressure north of Laura that was steering the storm expanded westward, keeping the center well over water and further away from the south coast of Cuba. Despite this, northerly wind shear, drier air and some land interaction initially weakened the storm slightly as it paralleled the south coast of Cuba. However, as Laura neared and crossed western Cuba on the evening of the 24th, it was already showing signs of becoming better organized though it remained at tropical storm intensity.
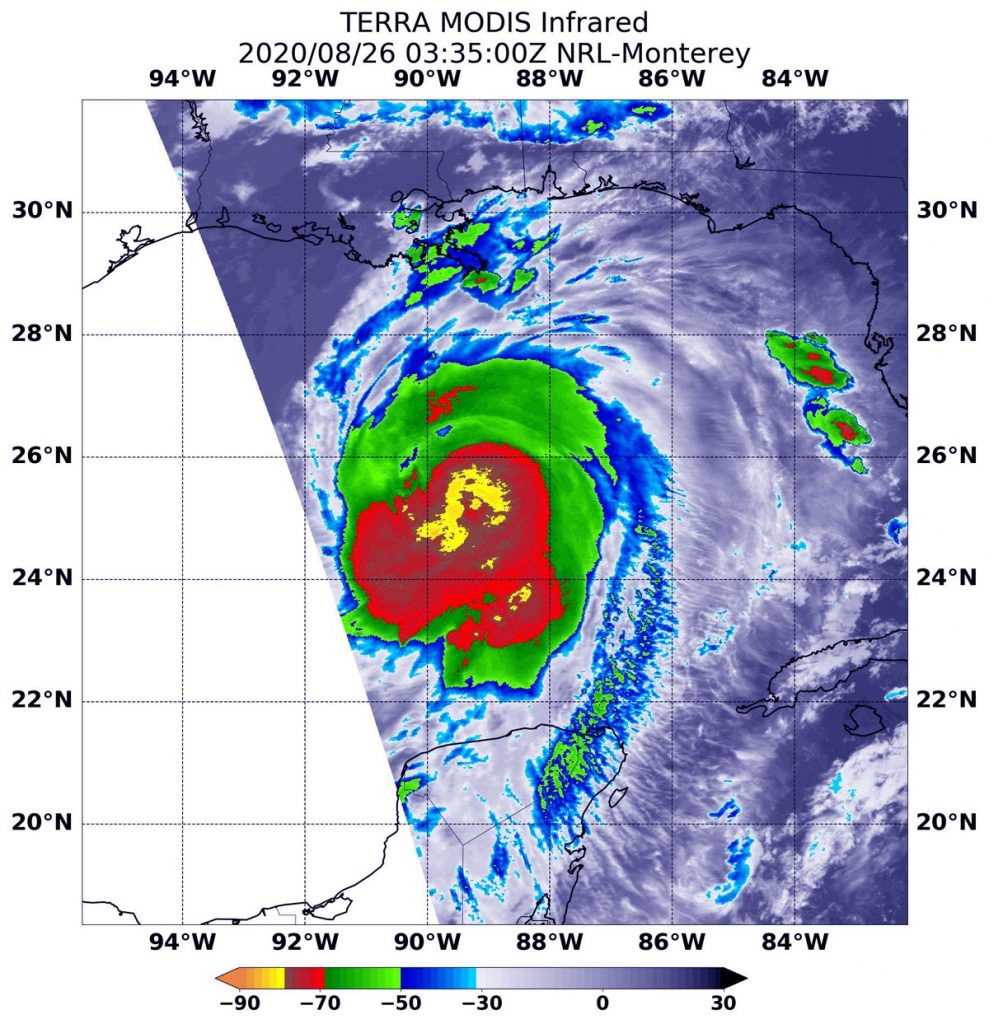
When Laura emerged out into the southeast Gulf of Mexico early on the morning of the 25th, it did so over deep, warm water in a humid, relatively low wind-shear environment, the perfect conditions for intensification. Almost immediately, strong convection fired up near Laura’s core, lowering the central pressure, and by 7:15 a.m. CDT on Tuesday August 25th, Laura was a Category 1 hurricane. Now well organized and in ideal conditions for strengthening, Laura was primed for further, rapid intensification, which is exactly what happened.
Over the next 36 hours, as Laura gradually turned northward around the western edge of a high pressure ridge across Florida and headed for the northern Gulf Coast, it underwent a rapid deepening cycle. Reports from NHC showed that maximum sustained winds increased from 75 to 150 mph over this period, taking Laura from Category 1 to a Category 4 hurricane.
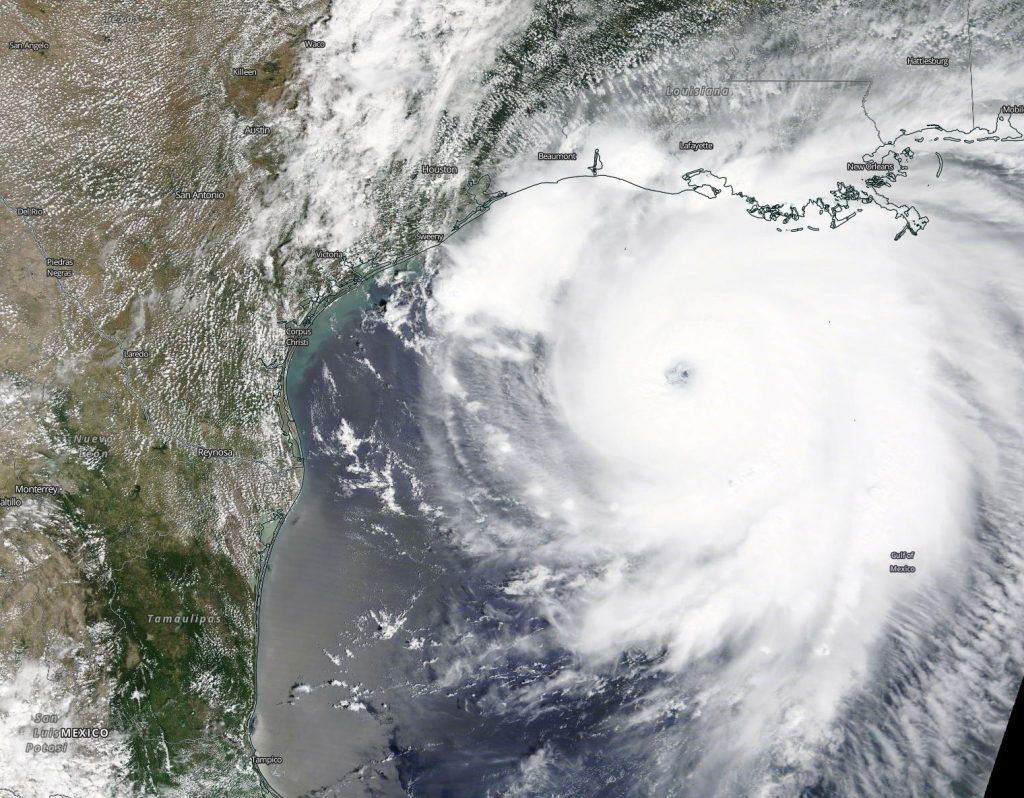
By this time, Laura was very near to the coast of western Louisiana where it then made landfall near Cameron, Louisiana at 1:00 a.m. CDT at the same 150 mph intensity. A wind gust to 128 mph was reported at the Lake Charles Regional Airport. It is estimated that Laura maintained hurricane intensity for the next 10 hours as it moved northward into northern Louisiana.
NASA Rainfall Accumulations on Laura
IMERG surface rainfall accumulations from Laura on the northern Gulf Coast were actually lower than they are for Marco and generally range from over 50 to 100 mm (~2 to 4 inches, shown in green and yellow) with local pockets of higher amounts (shown in orange) extending across most of Louisiana and Arkansas. Rainfall amounts depend more on system speed than intensity; while Marco slowed down near the coast, Laura continued to push northward. However, elsewhere in the Caribbean, IMERG estimates show from 125 to over 225 mm (~5 to over 9 inches, shown in orange and darker red) of rain over the southern half of Hispaniola, where a total of 35 fatalities were reported to due to the storm, 31 of which were in Haiti. So far, 22 deaths are being blamed on Laura in the US, 14 of those in Louisiana.
About IMERG
The near-real-time rain estimate comes from the NASA’s Integrated Multi-satellitE Retrievals for GPM (IMERG) algorithm, which combines observations from a fleet of satellites, in near real time, to provide near-global estimates of precipitation every 30 minutes. This satellite-based rain estimate is somewhat coarse in resolution and can miss short-lived, intense storm-cells, but the IMERG algorithm often does captures the large-scale features of storms wherever they form in the world. While the United States is fortunate to have a network of ground radars that can provide higher-resolution precipitation estimates, in other parts of the world, notably over most of the world’s oceans, the IMERG rain estimate is an important reference point.
This near-real time rain estimate comes from the NASA’s IMERG algorithm, which combines observations from a fleet of satellites, in near-real time, to provide near-global estimates of precipitation every 30 minutes. By combining NASA precipitation estimates with other data sources, we can gain a greater understanding of major storms that affect our planet.
IMERG fills in the “blanks” between weather observation stations. IMERG satellite-based rain estimates can be compared to that from a National Weather Service ground radar. Such good detection of large rain features in real time would be impossible if the IMERG algorithm merely reported the precipitation observed by the periodic overflights of various agencies’ satellites. Instead, what the IMERG algorithm does is “morph” high-quality satellite observations along the direction of the steering winds to deliver information about rain at times and places where such satellite overflights did not occur. Information morphing is particularly important over the majority of the world’s surface that lacks ground-radar coverage.
By Steve Lang
NASA’s Goddard Space Flight Center
Aug. 28, 2020 – Terra MISR Used to Visualize Cloud-top Heights from Hurricane Laura in 3D
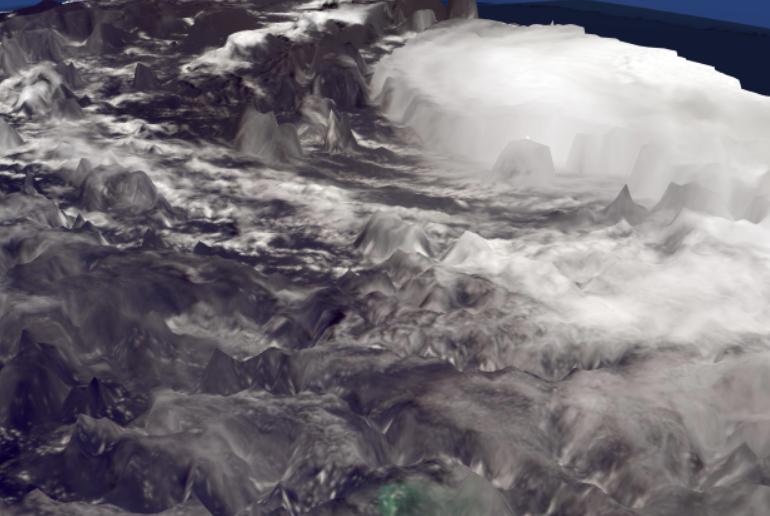
On August 25th, Several days before Hurricane Laura made landfall as a destructive category 4 storm in Louisiana, NASA’s Terra satellite flew over Laura in the Gulf of Mexico. Using its Multi-angle Imaging SpectroRadiometer (MISR) instrument, the satellite collected data on wind speeds and cloud-top heights as the storm intensified and moved northwest towards the U.S. Gulf Coast.
For the entire story click this link: https://disasters.nasa.gov/hurricane-laura-2020/terra-misr-used-visualize-cloud-top-heights-hurricane-laura-3d
Credit: NASA Disasters Program, Esri
Aug. 28, 2020 – NASA-NOAA Satellite Nighttime Imagery Tracks Tropical Depression Laura Over U.S.
A new animation of nighttime imagery from NASA-NOAA’s Suomi NPP satellite followed the path of former Hurricane Laura from its landfall in southwestern Louisiana to its movement over the Mississippi Valley.
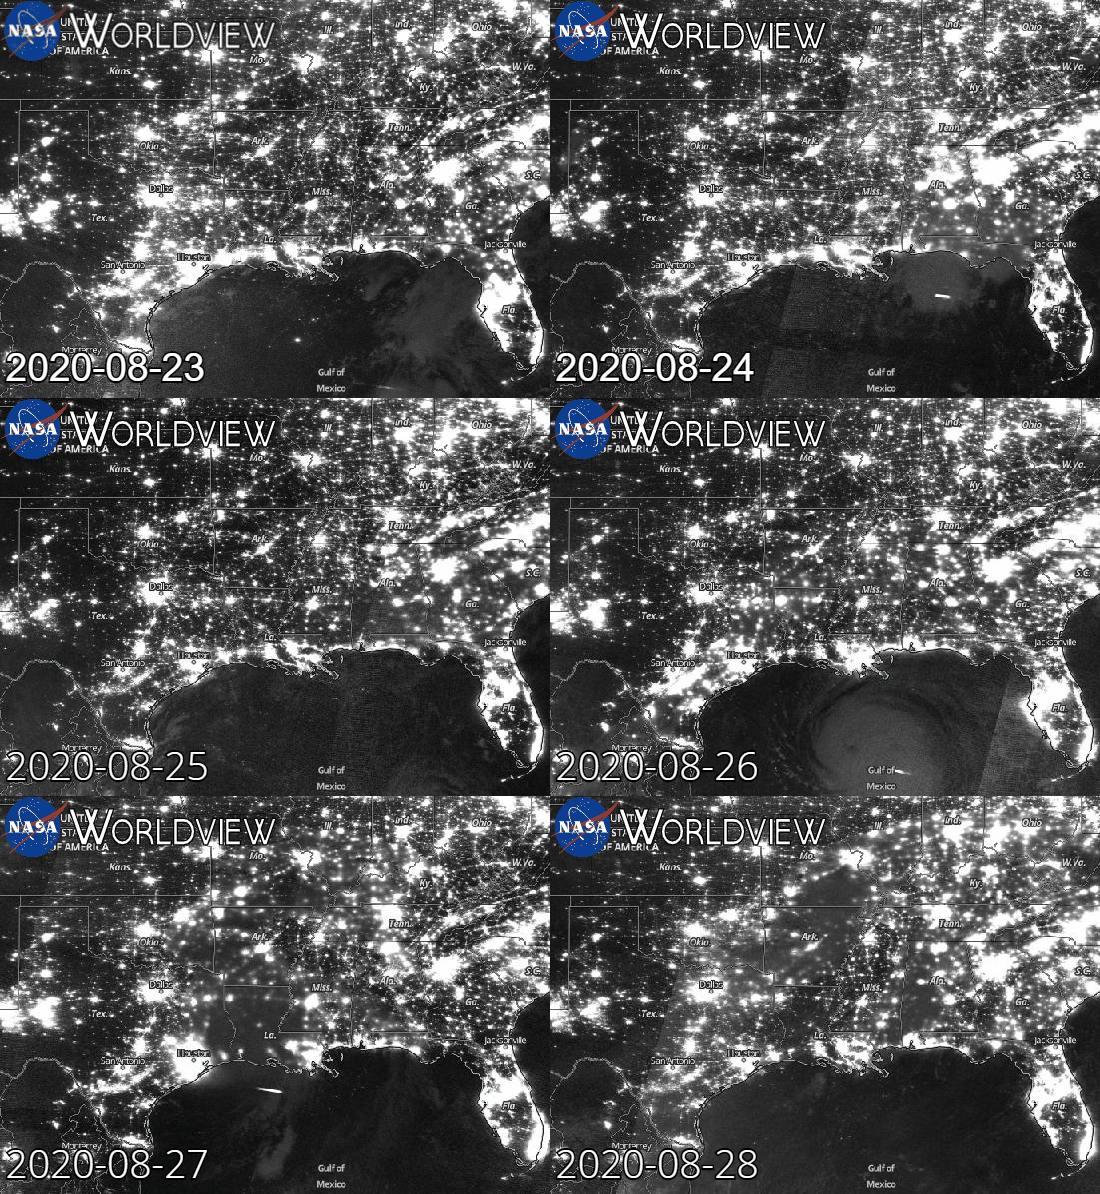
As Laura tracks across the eastern U.S., it is generating heavy rain and has triggered watches.
On Aug. 28, Flash Flood Watches were posted for portions of northeast Arkansas, southeast Missouri, western Kentucky and Tennessee, northern of Mississippi, and northwest Alabama.
NASA’s Night-Time Imagery Tracks Laura
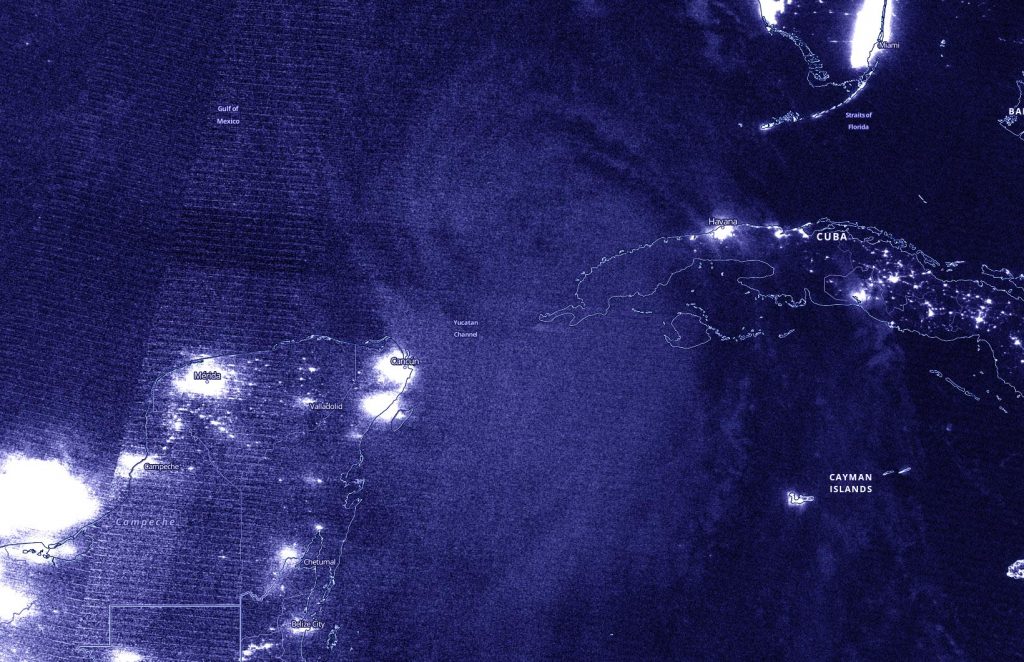
The Visible Infrared Imaging Radiometer Suite (VIIRS) instrument aboard Suomi NPP provided days of infrared nighttime imagery of the now former hurricane Laura. Using the Worldview Application at NASA’s Goddard Space Flight Center, Greenbelt, Md. an animation was created of nighttime imagery from Aug. 23 to 28, 2020 (0000 UTC) that showed the track of Hurricane Laura from the landfall and movement from southwestern Louisiana to the Mississippi Valley.
Tropical Depression Laura’s Status on Aug. 28
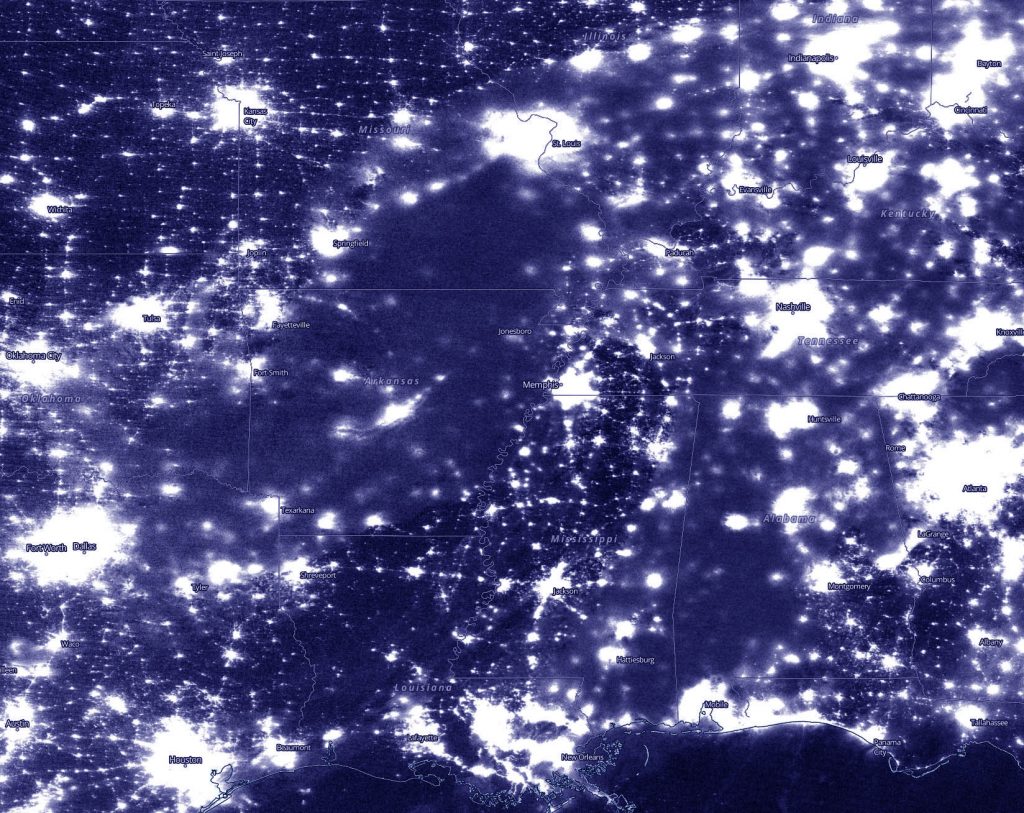
At 11 a.m. EDT (1500 UTC) on Aug. 28, NOAA’s Weather Prediction Center (WPC) noted the center of Tropical Depression Laura was located near latitude 36.6 north, longitude 90.5 west. That puts the center about 85 miles (140 km) northwest of Memphis, Tenn. and about 105 miles (170 km) west-southwest of Paducah, Kentucky. The depression was moving toward the east-northeast near 20 mph (31 km/h) and this motion is expected to continue as Laura tracks along and south of the Ohio Valley through tonight. Maximum sustained winds were near 30 mph (45 kph) with higher gusts. The estimated minimum central pressure is 1001 millibars.
Hazards Laura Brings Along its Path
NOAA’s WPC provided a look at the hazards that Tropical Depression Laura is expected to bring along its path toward the Atlantic Ocean over the next 2 days: “Expect 1 to 3 inches, with isolated 5-inch totals from western and central Kentucky and Tennessee into northern Alabama and Mississippi. One to 2 inches, with isolated 4-inch totals are possible over southern parts of Louisiana, Mississippi, and Alabama. By Saturday, 1 to 3 inches of rain is forecast from the central and southern Appalachians to the Mid-Atlantic States. This rainfall will continue to contribute to isolated flash and urban flooding, and overflow of small streams and creeks across the aforementioned regions. Minor to moderate river flooding is occurring or forecast in Louisiana and Arkansas.
Gusty winds of 25-30 mph will accompany Laura’s circulation as it moves toward the Lower Ohio Valley through the afternoon. Stronger gusts are possible within thunderstorms.
A few tornadoes remain possible, mainly over parts of Mississippi, Tennessee and southern Kentucky. The risk for a couple of tornadoes should redevelop Saturday afternoon and evening over parts of the mid-Atlantic from Virginia to North Carolina.”
Forecast for Laura
Eventually, the remains of Laura will cross the central Appalachians Saturday, before becoming absorbed by an approaching cold front that is forecast to move off the mid-Atlantic coastline by late Saturday.
About NASA’s EOSDIS Worldview
NASA’s Earth Observing System Data and Information System (EOSDIS) Worldview application provides the capability to interactively browse over 700 global, full-resolution satellite imagery layers and then download the underlying data. Many of the available imagery layers are updated within three hours of observation, essentially showing the entire Earth as it looks “right now.”
NASA Researches Earth from Space
For more than five decades, NASA has used the vantage point of space to understand and explore our home planet, improve lives and safeguard our future. NASA brings together technology, science, and unique global Earth observations to provide societal benefits and strengthen our nation. Advancing knowledge of our home planet contributes directly to America’s leadership in space and scientific exploration.
For updated forecasts, visit: www.nhc.noaa.gov
By Rob Gutro
NASA’s Goddard Space Flight Center
Aug. 28, 2020 – NASA’s captures powerful Hurricane Laura over Louisiana
As it moved inland heading north over western Louisiana, Laura was overflown by the NASA / JAXA GPM Core Observatory satellite at 10:00 p.m. CDT on Wednesday August 26th, shortly before the storm made landfall, then again at 8:11 a.m. CDT on Thursday August 27th, about 7 hours after making landfall, as shown in the animation below.
Rainfall rates derived directly from the GPM Microwave Imager (GMI) and Dual-frequency Precipitation Radar (DPR) instruments show heavy rain (in red) pushing up into northern Louisiana and southern Arkansas as strong southerly winds drew moisture from the Gulf of Mexico on the eastern side of the storm’s strong cyclonic circulation. With its ability to penetrate through the clouds using active radar, the DPR also provided a detailed look at Laura’s structure. Precipitation cloud-top heights from the DPR (highlighted in blue, indicating frozen precipitation) show Laura still had the overall structure of a powerful hurricane, as evidenced by both the symmetry of the outer rain bands that still wrap completely around the storm, as well as the residual structure of a strong core near the center containing elements of very heavy rain (shown in pink). At the time of this GPM overpass, Laura’s maximum sustained winds were still reported at 100 mph by the National Hurricane Center, the equivalent of a category 2 hurricane.GPM data is archived at https://pps.gsfc.nasa.gov/
Text by Steve Lang, Jacob Reed (NASA Goddard Space Flight Center)
GPM overpass visualization by Alex Kekesi (NASA Goddard Scientific Visualization Studio)
IMERG rainfall visualization by Owen Kelley, Jason West (NASA Precipitation Processing System)


