Lorenzo – Atlantic Ocean

Oct. 03, 2019 – NASA Sees Post-tropical Cyclone Lorenzo Affecting Ireland

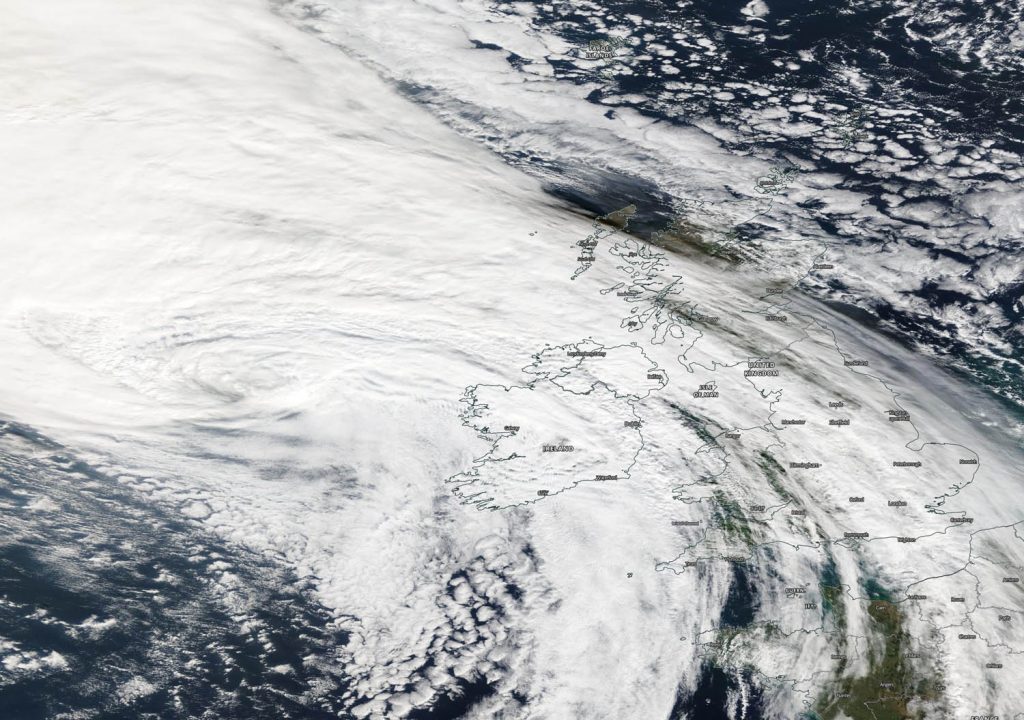
NASA’s Terra satellite passed over the eastern North Atlantic Ocean early on Oct. 3 and captured a visible image of Post-tropical Cyclone Lorenzo as it neared Ireland. Lorenzo’s eastern side is already affecting Ireland, and both Ireland and the United Kingdom have posted warnings today.
Terra image of Lorenzo
On Oct. 3, the MODIS instrument that flies aboard NASA’s Terra provided a visible image of Post-Tropical Cyclone Lorenzo moving through the North Atlantic Ocean and just west of Ireland. Credit: NASA Worldview, Earth Observing System Data and Information System (EOSDIS).

On Oct. 3, Lorenzo was still a powerful post-tropical storm. NASA satellite images indicated that frontal features had formed as indicated by its elongated appearance.

The Moderate Imaging Spectroradiometer or MODIS instrument that flies aboard NASA’s Terra satellite provided a visible image of Lorenzo. The MODIS image showed the cloud-filled center of circulation west of Ireland.  Clouds and precipitation associated with the system had already spread over Ireland and parts of the United Kingdom.

A Post-Tropical Storm is a generic term for a former tropical cyclone that no longer possesses sufficient tropical characteristics to be considered a tropical cyclone.  Three classes of post-tropical cyclones include fully extratropical, subtropical, or remnant lows. In any case, they no longer possesses sufficient tropical characteristics to be considered a tropical cyclone. However, post-tropical cyclones can continue to carry heavy rains and produce high winds.

On Oct. 3, Met Eireann, Ireland’s Meteorological Service issued rainfall and wind warnings for the country. The effects of Post-Tropical Storm Lorenzo will begin to be felt across Ireland this morning. Met Eireann uses three different colors to designate warnings. Yellow means “Not unusual weather. Localised danger.” Orange means “Infrequent. Dangerous/disruptive.” Red means “Rare. Extremely dangerous/destructive.”

A Status Yellow Wind warning is in effect for all of Ireland that calls for southeasterly winds to reach mean speeds 50 to 65 kph (31 to 40 mph) with higher gusts. A Status Yellow Wind warning is in effect for Wexford, Cork, Tipperary and Waterford.

There’s an Orange Wind warning for Galway, Mayo, Clare, Kerry and Limerick. Southwesterly winds veering westerly will reach mean speeds 65 to 80 kph (40 to 50 mph) with gusts generally of 100 to 130 kph (62 to 81 mph), higher in some coastal regions. Storm surges will produce coastal flooding and damage. There is also a Status Orange Gale Warning in effect as southeast gales or strong gales are expected today on all Irish Coastal Waters and on the Irish Sea.

A Status Yellow Rainfall warning for Connacht, Leinster, Cavan, Monaghan and Donegal. That means spells of heavy rain at times today and tonight will result in some flooding.

In coastal areas, Lorenzo will produce significant swells, high waves and sizeable storm surges. This will lead to wave overtopping, some coastal flooding and damage. Met Eireann noted that saturated soils and the expected heavy rainfall may lead to surface flooding. In addition, river levels are currently elevated across the country and the rainfall may lead to river flooding in parts of the midlands, west and northwest.

Hurricanes are the most powerful weather event on Earth. NASA’s expertise in space and scientific exploration contributes to essential services provided to the American people by other federal agencies, such as hurricane weather forecasting.

For updated forecasts from Met Eireann, Ireland’s Meteorological Service, Visit: https://www.met.ie/warnings

By Rob Gutro
NASA’s Goddard Space Flight Center

Lorenzo – Atlantic Ocean

Oct. 02, 2019  – NASA Examines Extra-tropical Large Lorenzo’s Rainfall

Lorenzo is still at hurricane force in the eastern North Atlantic has now transitioned to an extra-tropical cyclone and has grown in size. The Global Precipitation Measurement mission or GPM core satellite provided a look at the rainfall occurring within this strong system. The Portuguese Institute for the Sea and the Atmosphere has discontinued all warnings for the Azores, and now Ireland and the United Kingdom are on watch for Lorenzo’s approach.

NASA Looks at Lorenzo’s Rainfall, Extra-Tropical Transition

GPM image of Lorenzo
The GPM’s core satellite passed over Lorenzo on Oct. 2 at 4:31 a.m. EDT (0831 UTC). GPM found the heaviest rainfall occurring north of the center, where it was falling at a rate of more than 1 inch (25 mm) per hour (red). Credit: NASA/JAXA/NRL

The GPM’s core satellite passed over Lorenzo on Oct. 2 at 4:31 a.m. EDT (0831 UTC). GPM found the heaviest rainfall occurring north of the center, where it was falling at a rate of more than 1 inch (25 mm) per hour. Scattered light rain falling at less than 0.2 inches (less than 5 millimeters) per hour circled the rest of the storm. Forecasters at NOAA’s National Hurricane Center or NHC incorporate the NASA rainfall data into their forecasts.

Satellite data showed that Lorenzo had become extra-tropical. That means that a tropical cyclone has lost its “tropical” characteristics. NHC defines “extra-tropical” as a transition that implies both poleward displacement (meaning it moves toward the north or south pole) of the cyclone and the conversion of the cyclone’s primary energy source from the release of latent heat of condensation to baroclinic (the temperature contrast between warm and cold air masses) processes. It is important to note that cyclones that become extratropical can still retain winds of hurricane or tropical storm force.

Status of Lorenzo on Oct. 2

At 11 a.m. EDT (1500 UTC) on Oct. 2, NHC issued its last public advisory on this system.  The center of Post-Tropical Cyclone Lorenzo was located near latitude 44.4 degrees north and longitude 25.8 degrees west. That is about 945 miles (1,525 km) west-southwest of Cork, Ireland, and about 970 miles (1,565 km) west-southwest of Galway, Ireland. The post-tropical cyclone is moving toward the northeast near 43 mph (69 kph). A continued fast motion toward the northeast is expected through Thursday morning.

Maximum sustained winds are near 80 mph (130 kph) with higher gusts. Only slow weakening is forecast during the next day or so, and the system is expected to be a strong extratropical cyclone when it approaches Ireland Thursday afternoon and evening. A faster rate of weakening is expected when the cyclone moves over Ireland and England.

Lorenzo is a very large cyclone. Hurricane-force winds extend outward up to 150 miles (240 km) from the center and tropical storm-force winds extend outward up to 390 miles (630 km). The estimated minimum central pressure is 962 millibars.

Lorenzo’s Forecast Path

Lorenzo is expected to bring strong winds and rainfall to Ireland and portions of the United Kingdom.

The cyclone is forecast to slow down and turn eastward and then southeastward Thursday night and Friday. On the forecast track, the center of post-tropical Lorenzo will move near western Ireland on Thursday, then pass over Ireland and England on Thursday night and Friday.

Ireland Braces for Lorenzo

On Oct. 2, Met Eireann, the Irish Meteorological Service issued this forecast about Lorenzo’s approach and effects:  “Turning wet and windy on Thursday as the outer rainbands associated with Storm Lorenzo track across Ireland. Southeast winds will be strong and gusty with some damaging gusts. Very high seas are expected along the Atlantic coast. Feeling increasingly humid with temperatures of 13 to 17 degrees Celsius [55.4 to 62.6 degrees Fahrenheit]. During Thursday evening [Oct. 3] the centre of Storm Lorenzo will move closer to the northwest coast. Southerly winds will veer west to southwest, with gales and severe damaging gusts, especially along Atlantic coasts. Intense falls of thundery rain will move into the west, too.”

Interests in Ireland should monitor products issued by Met Eireann, and interests in the United Kingdom should monitor products issued by the U.K. Met Office.

Lorenzo’s Ocean Effects Over Large Area

NHC forecasters noted that swells generated by Lorenzo have spread across much of the North Atlantic basin, and are affecting the east coast of the United States, Atlantic Canada, the Bahamas, portions of the Greater and Lesser Antilles, the Azores, and portions of the coast of Europe. These swells are likely to cause life-threatening surf and rip current conditions.

Hurricanes are the most powerful weather event on Earth. NASA’s expertise in space and scientific exploration contributes to essential services provided to the American people by other federal agencies, such as hurricane weather forecasting.

GPM is a joint mission between NASA and the Japan Aerospace Exploration Agency, JAXA.

Local forecasts and warnings for Ireland can be found on the website of Met Eireann, the Irish Meteorological Service, at http://www.met.ie

Additional information on this system can be found at: https://www.metoffice.gov.uk/weather/specialist-forecasts/coast-and-sea/high-seas-forecast

By Rob Gutro 
NASA’s Goddard Space Flight Center

Lorenzo – Atlantic Ocean

Oct. 01, 2019 – NASA Satellite Sees a Large Hurricane Lorenzo Headed toward Azores

Hurricane Lorenzo was heading toward the Azores Islands when NASA-NOAA’s Suomi NPP satellite provided forecasters with an image of the storm. Satellite imagery revealed the large extent of the storm.

Suomi NPP image of Lorenzo
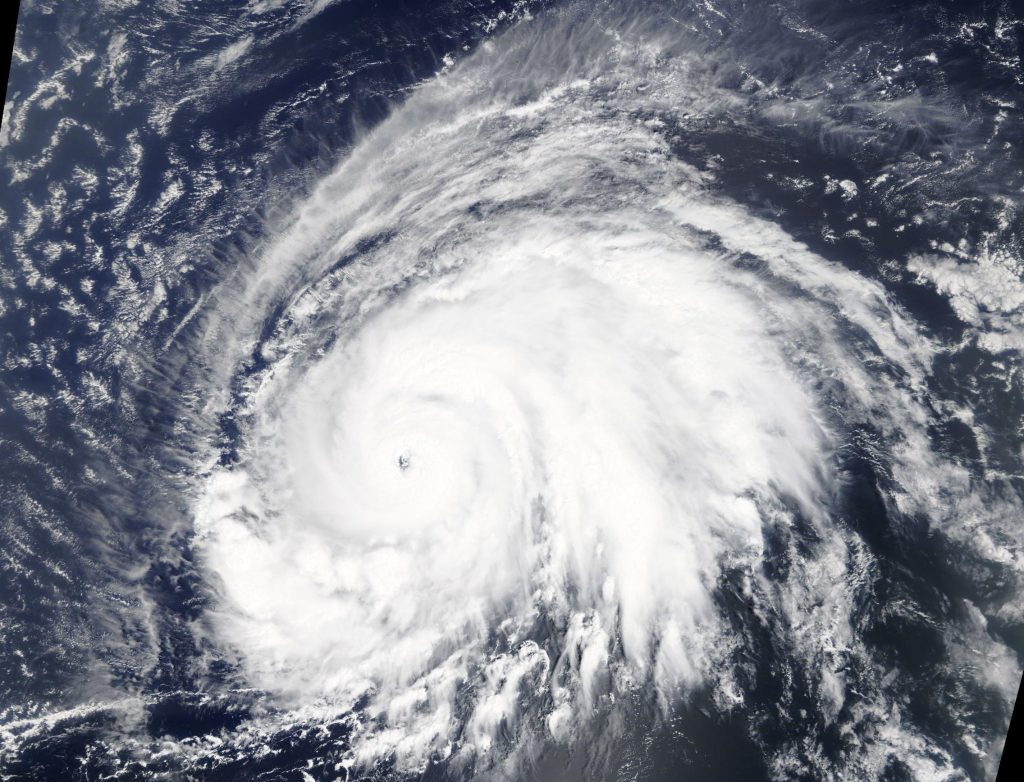
NASA-NOAA’s Suomi NPP satellite passed over Hurricane Lorenzo twice in the Northeastern Atlantic Ocean to obtain a full picture, stitched together, of the large storm. Credit: NASA Worldview, Earth Observing System Data and Information System (EOSDIS)

Visible imagery from NASA satellites help forecasters understand if a storm is organizing or weakening. The shape of a tropical cyclone provides forecasters with an idea of its organization and strength. The more circular a storm appears, the stronger it can be. The Visible Infrared Imaging Radiometer Suite (VIIRS) instrument aboard Suomi NPP provided a visible image of Lorenzo on Sept. 30 and revealed that Lorenzo has grown in size. In fact, it took two orbits of NASA-NOAA’s Suomi NPP satellite to capture the entire storm. Those two images were stitched together using the NASA Worldview, Earth Observing System Data and Information System (EOSDIS) at NASA’s Goddard Space Flight Center in Greenbelt, Md.

In the VIIRS imagery, Lorenzo’s eye had become less distinct on satellite images over Sept. 30 and Oct. 1, but the system remains very well organized with tightly curved convective bands.

Lorenzo is a very large tropical cyclone. NOAA’s National Hurricane Center or NHC noted that hurricane-force winds extend outward up to 90 miles (150 km) from the center and tropical storm-force winds extend outward up to 345 miles (555 km).

On Oct. 1, a Hurricane Warning was in effect for islands in the Azores that included Flores, Corvo, Faial, Pico, Sao Jorge, Graciosa, and Terceira. A Tropical Storm Warning is in effect for Sao Miguel, Santa Maria.

At 8 am EDT (1200 UTC) on Oct. 1, the center of Hurricane Lorenzo was located near latitude 34.3 degrees north and longitude 29.0 degrees west. It was centered about 555 miles (895 km) southwest of Flores in the Western Azores Islands. Lorenzo is moving toward the northeast near 22 mph (35 kph). Maximum sustained winds are near 100 mph (155 kph) with higher gusts.  Only slow weakening is expected during the next two days. The estimated minimum central pressure is 962 millibars.

Hurricanes are the most powerful weather event on Earth. NASA’s expertise in space and scientific exploration contributes to essential services provided to the American people by other federal agencies, such as hurricane weather forecasting.

On the forecast track, the center of Lorenzo is expected to pass near the western Azores early on Wednesday, Oct. 2.

For updated forecasts. Visit: www.nhc.noaa.gov

By Rob Gutro 
NASA’s Goddard Space Flight Center

Lorenzo – Atlantic Ocean

Sep. 30, 2019 – NASA-NOAA’s Suomi NPP Analyzes Record-Setting Hurricane Lorenzo

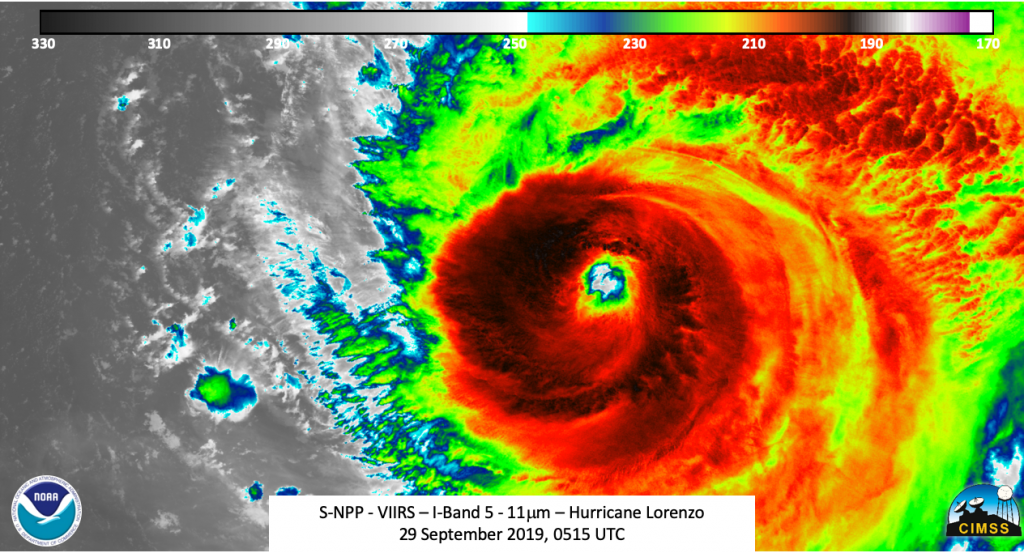
Over the weekend of Sept. 28 and 29, Hurricane Lorenzo attained Category 5 strength briefly, becoming the strongest hurricane on record in the eastern-most Atlantic Ocean. Lorenzo has also attained and contributed to some other significant statistics. NASA-NOAA’s Suomi NPP satellite provided infrared data over two days provided forecasters with changes in the storm’s eye, powerful thunderstorms and gravity waves it was creating.

Suomi NPP image of Lorenzo
The Suomi NPP satellite passed over the eastern Atlantic Ocean on Sept. 29, after Lorenzo weakened back to a Category 4 hurricane. The eye was well defined and there were mesovorticies seen. The strength of the storm also was producing mesospheric gravity waves. Credit: NASA/NOAA/UWM-CIMSS, William Straka

Record Setting

On Saturday, Sept. 28, when Lorenzo attained Category 5 (Cat 5) strength on the Saffir-Simpson Hurricane Wind Scale it was in a place more than 600 miles east-northeast of the previous record Cat 5 storm. It also had the lowest air pressure east of 50 degrees west longitude when the pressure dropped to 925 millibars.

There have been 26 Category 5 storms since 1960 with Lorenzo being the latest. Over the past 3 years, six storms attained that level of intensity. The others include Dorian, Michael, Maria, Irma and Matthew. Earlier this year Dorian reached Category 5 strength, so this year joins only six other years that contained more than one Cat 5 storm since records began. Other years with more than one Cat 5 storm include 1932, 1933, 1961, 2005, 2007 and 2017.

NASA-NOAA’s Suomi NPP Satellite Views

The Suomi NPP satellite passed over the eastern Atlantic Ocean on Sept. 29, after Lorenzo’s peak when it weakened back to a Category 4 hurricane. The Visible Infrared Imaging Radiometer Suite (VIIRS) instrument aboard Suomi NPP provided infrared data on Lorenzo.

Tropical cyclones are made of up hundreds of thunderstorms, and infrared data can show where the strongest storms are located. They can do that because infrared data provides temperature information, and the strongest thunderstorms that reach highest into the atmosphere have the coldest cloud top temperatures.

“As with other strong hurricanes, the eye was well defined along with mesovortices seen,” said William Straka III, a researcher who created some Suomi NPP images at the University of Wisconsin – Madison, Space Science and Engineering Center (SSEC), Cooperative Institute for Meteorological Satellite Studies (CIMSS). The strength of the storm also was producing mesospheric gravity waves. Straka said, “Something interesting to note is that the mesospheric gravity waves from Lorenzo could be seen up to 1,180 km (733 miles) away. This isn’t that unheard of, but still worth noting.”

Mesovortices are small-scale rotational features found in convective storms, such as found in the eyewall of tropical cyclones. They can be as big as tens of miles in diameter or smaller such as a mile or less, and can be immensely intense.

NOAA defines a gravity wave as a wave created by the action of gravity on density variations in the stratified atmosphere. A generic classification for lee waves, mountains waves, and many other waves that form in the atmosphere.

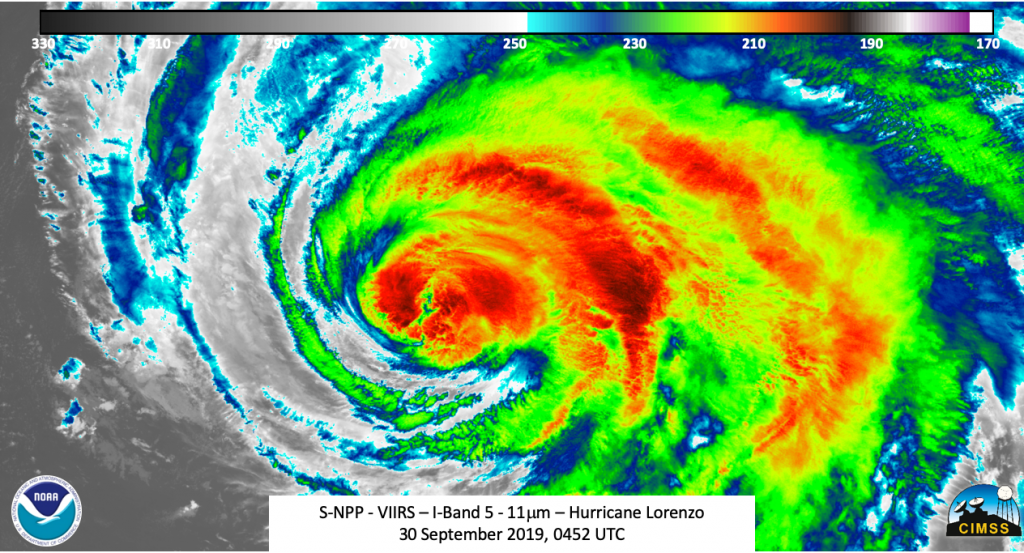
At 0300Z on  September 30 (11 p.m. EDT on Sept. 29), the National Hurricane Center or NHC Public advisory  stated that Hurricane Lorenzo had winds of 110 mph, making it just barely a Category 3 hurricane. Three hours later at 2 a.m. EDT (0600 UTC) on Sept. 30, Lorenzo had weakened to a Category 2 hurricane as wind had decreased to 105 mph. When NASA-NOAA’s Suomi NPP satellite passed over Lorenzo, it analyzed the storm again in infrared light. NPP imagery showed mesospheric gravity waves quite possibly due to the energy being released as the storm weakened. NPP also showed a cloud-filled eye with clouds expanding to the northern quadrant. Both of these observations support the NHC Forecast Discussion at 5 a.m. EDT (0900 UTC).

Suomi NPP Image of Lorenzo
On Sept. 30, NASA-NOAA’s Suomi NPP satellite imagery showed mesospheric gravity waves quite possibly due to the energy being released as the storm weakened. NPP also showed a cloud-filled eye with clouds expanding to the northern quadrant. Credit: NASA/NOAA/UWM-CIMSS, William Straka

Hurricane Lorenzo on Sept 30

On Sept. 30, 2019 at 8 a.m. EDT (1200 UTC), NOAA’s National Hurricane Center issued watches for the Azores Islands. The Azores is a self-governing region of Portugal. The Azores consist of nine inhabited islands. All of them are under a watch from Lorenzo.  NHC posted a Hurricane Watch for Flores, Corvo, Faial, Pico, Sao Jorge, Graciosa, Terceira, and a Tropical Storm Watch is in effect for Sao Miguel, Santa Maria.

At that time, the center of Hurricane Lorenzo was located near latitude 29.4 degrees north and longitude 42.9 degrees west.  Lorenzo is moving toward the north-northeast near 14 mph (20 kph). Maximum sustained winds are near 105 mph (165 kph) with higher gusts. Hurricane-force winds extend outward up to 90 miles (150 km) from the center and tropical-storm-force winds extend outward up to 255 miles (405 km). The estimated minimum central pressure is 957 millibars.

Lorenzo’s Track

On the forecast track, the center of Lorenzo is expected to pass near the western Azores early on Wednesday, Oct. 2. Some weakening is forecast over the next two day, but Lorenzo is forecast to remain a large and powerful hurricane while it passes near the Azores.

In addition to threatening the Azores, Lorenzo is having quite the impact in the North Atlantic, despite being in the Eastern North Atlantic. NHC said, “Large swells spreading across much of the northern Atlantic basin. These swells are likely to cause life-threatening surf and rip current conditions.”

Hurricanes are the most powerful weather event on Earth. NASA’s expertise in space and scientific exploration contributes to essential services provided to the American people by other federal agencies, such as hurricane weather forecasting.

By Rob Gutro
NASA’s Goddard Space Flight Center

Lorenzo – Atlantic Ocean

Sep. 27, 2019 – NASA Data Stares into the Eye of Powerful Hurricane Lorenzo

Satellite data has confirmed that Lorenzo is a major hurricane in the eastern North Atlantic Ocean with an impressive structure. NASA’s Terra Satellite provided a visible image of Lorenzo that revealed a clear eye and a solid structure of thunderstorms around the eye.

Terra image of Lorenzo
On Sept. 26, the MODIS instrument that flies aboard NASA’s Terra provided a visible image of Hurricane Lorenzo moving through the eastern North Atlantic Ocean. Credit: NASA Worldview, Earth Observing System Data and Information System (EOSDIS).

On Sept. 26, the Moderate Imaging Spectroradiometer or MODIS instrument that flies aboard NASA’s Terra satellite provided a visible image of Lorenzo as a major hurricane. The image and other satellite images showed a well-defined eye. The MODIS image revealed powerful thunderstorms around the eyewall, extending high into the troposphere. The circular shape of the storm indicated an organized and powerful storm.

At 5 a.m. EDT (0900 UTC), on Sept. 27 the center of Hurricane Lorenzo was located near latitude 18.6 degrees north and longitude 42.1 degrees west. Lorenzo is moving toward the north-northwest near 14 mph (22 km/h), and this general motion is forecast to continue today. A turn toward the north is expected on Saturday, followed by a turn toward the northeast on Sunday. Maximum sustained winds remain near 145 mph (230 kph) with higher gusts. Lorenzo is a category 4 hurricane on the Saffir-Simpson Hurricane Wind Scale. Some fluctuations in strength are possible today. Slow weakening is forecast to begin by the weekend.

Lorenzo is a large hurricane. Hurricane-force winds extend outward up to 45 miles (75 km) from the center and tropical-storm-force winds extend outward up to 265 miles (425 km).

Lorenzo, as a Category 4 hurricane has a long reach with ocean swells. Swells generated by Lorenzo are affecting portions of the northeastern coast of South America and will affect portions of the Windward Islands beginning today.

The estimated minimum central pressure is 937 mb (27.67 inches).

Hurricanes are the most powerful weather event on Earth. NASA’s expertise in space and scientific exploration contributes to essential services provided to the American people by other federal agencies, such as hurricane weather forecasting.

For updated forecasts, visit: www.nhc.noaa.gov

By Rob Gutro
NASA’s Goddard Space Flight Center

Lorenzo – Atlantic Ocean

Sep. 26, 2019 – Lorenzo Now a More Organized and Powerful Hurricane on NASA Satellite Imagery

NASA-NOAA’s Suomi NPP satellite provided a full visible image of a strengthening Hurricane Lorenzo in the eastern North Atlantic Ocean. On Sept. 26, Lorenzo attained status as a major hurricane.

Suomi NPP image of Lorenzo
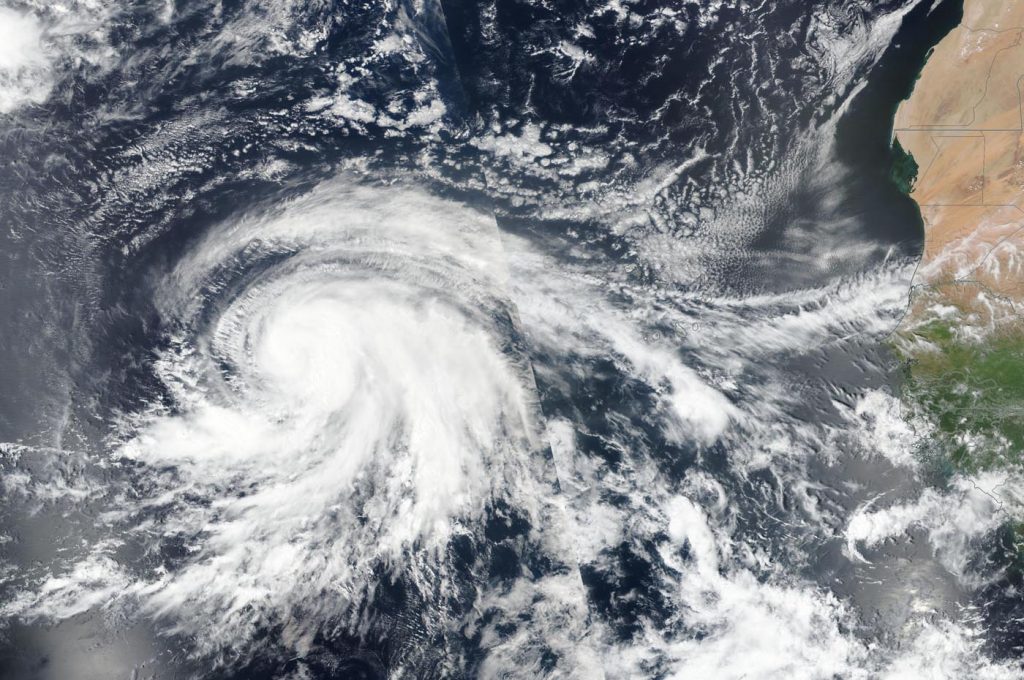
On Sept. 25, the VIIRS instrument aboard NASA-NOAA’s Suomi NPP satellite provided a visible image of Hurricane Lorenzo in the eastern North Atlantic Ocean. The African continent is east (right) in the image. Credit: NASA/NRL

A major hurricane is one that is a Category 3 or higher on the Saffir-Simpson Hurricane Wind Scale.

The Visible Infrared Imaging Radiometer Suite (VIIRS) instrument aboard Suomi NPP provided a visible image of the storm on Sept. 25. The VIIRS image showed powerful thunderstorms circling the center of Lorenzo with thick bands of thunderstorms wrapping into the low-level center from the south and east of center. The satellite imagery revealed that Lorenzo was getting better organized as it was strengthening. By 11 p.m. EDT, infrared imagery showed a small eye had been appearing intermittently.

The shape of the storm is a clue to forecasters that a storm is either strengthening or weakening. If a storm takes on a more rounded shape it is getting more organized and strengthening. Conversely, if it becomes less rounded or elongated, it is a sign the storm is weakening.

On Sept. 26, shortly after 5 a.m. EDT (0900 UTC), the National Hurricane Center (NHC) said Lorenzo’s eye quickly and drastically became more apparent in conventional satellite imagery. The slightly ragged but clearing eye of the hurricane is surrounded by very cold cloud tops, and it has become clear that Lorenzo is rapidly intensifying.

By 6 a.m. EDT (1000 UTC), the center of Hurricane Lorenzo had maximum sustained winds have rapidly increased to near 125 mph (205 kph) with higher gusts.  Lorenzo is a category 3 hurricane on the Saffir-Simpson Hurricane Wind Scale.

Lorenzo was located near latitude 15.2 degrees north and longitude 39.3 degrees west. That puts Lorenzo’s eye about 995 miles (1,600 km) west of the southernmost Cabo Verde Islands.

The hurricane is moving toward the west-northwest near 15 mph (24 kph). Lorenzo is forecast to turn toward the northwest and begin moving at a slightly slower speed later today. A turn toward the north is then anticipated on Saturday, Sept. 28.

Additional strengthening is possible today. Hurricane-force winds extend outward up to 35 miles (55 km) from the center and tropical-storm-force winds extend outward up to 205 miles (335 km). The estimated minimum central pressure is 955 millibars.

Hurricanes are the most powerful weather event on Earth. NASA’s expertise in space and scientific exploration contributes to essential services provided to the American people by other federal agencies, such as hurricane weather forecasting.

For updated forecasts. visit: www.nhc.noaa.gov

By Rob Gutro 
NASA’s Goddard Space Flight Center

Lorenzo – Atlantic Ocean

Sep. 25, 2019 – NASA-NOAA Satellite Sees Hurricane Lorenzo Strengthening

Dropping cloud top temperatures from NASA-NOAA’s Suomi NPP satellite indicated Hurricane Lorenzo was getting stronger in the North Atlantic Ocean.

Suomi NPP image of Lorenzo
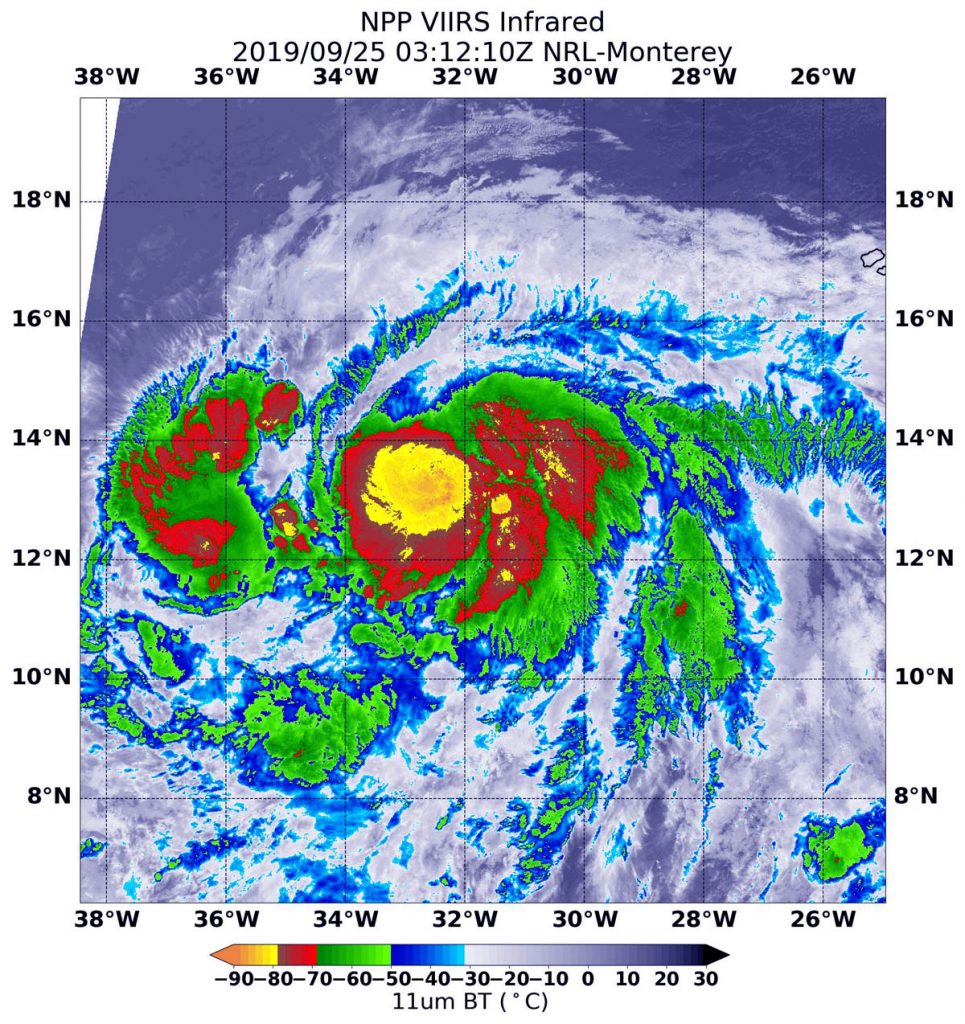
NASA-NOAA’s Suomi NPP satellite passed over Hurricane Lorenzo in the North Atlantic Ocean and the VIIRS instrument aboard captured this image of the storm on Sept. 25 at 0312 UTC (Sept. 24 at 11:12 p.m. EDT). A large area (yellow) of powerful thunderstorms circled the eye where cloud top temperatures were as cold as minus 121 Fahrenheit (minus 85 degrees Celsius). Credit: NASA/NRL

The Visible Infrared Imaging Radiometer Suite (VIIRS) instrument aboard Suomi NPP provided an infrared image of the storm. Infrared imagery reveals cloud top temperatures, and the higher the cloud top, the colder it is, and the stronger the storm. On Sept. 25 at 0312 UTC (Sept. 24 at 11:12 p.m. EDT) a large area of powerful thunderstorms circled the eye where cloud top temperatures were as cold as minus 121 Fahrenheit (minus 85 degrees Celsius). NOAA’s National Hurricane Center (NHC) forecasters cited that data in their Discussion at that time.

NASA research has shown that storms with cloud tops that cold have been found to generate heavy rainfall.

Later in the day, at 11 a.m. EDT (1500 UTC), the center of Hurricane Lorenzo was located near latitude 14.1 degrees north and longitude 35.1 degrees west. That is about 715 miles (1,155 km) west of the southernmost Cabo Verde islands.  Lorenzo is moving toward the west-northwest near 17 mph (28 kph), and this motion is expected to continue through Thursday.

A turn toward the northwest is expected late Thursday. Maximum sustained winds have increased to near 85 mph (140 kph) with higher gusts.  Additional strengthening is forecast during the next couple of days, and Lorenzo is forecast to become a major hurricane by Thursday [Sept. 26]. The estimated minimum central pressure is 983 millibars.

Hurricanes are the most powerful weather event on Earth. NASA’s expertise in space and scientific exploration contributes to essential services provided to the American people by other federal agencies, such as hurricane weather forecasting.

For updated forecasts. visit: www.nhc.noaa.gov

By Rob Gutro 
NASA’s Goddard Space Flight Center

Lorenzo – Atlantic Ocean

Sep. 24, 2019 – NASA-NOAA Satellite Find Tropical Storm Lorenzo Organizing

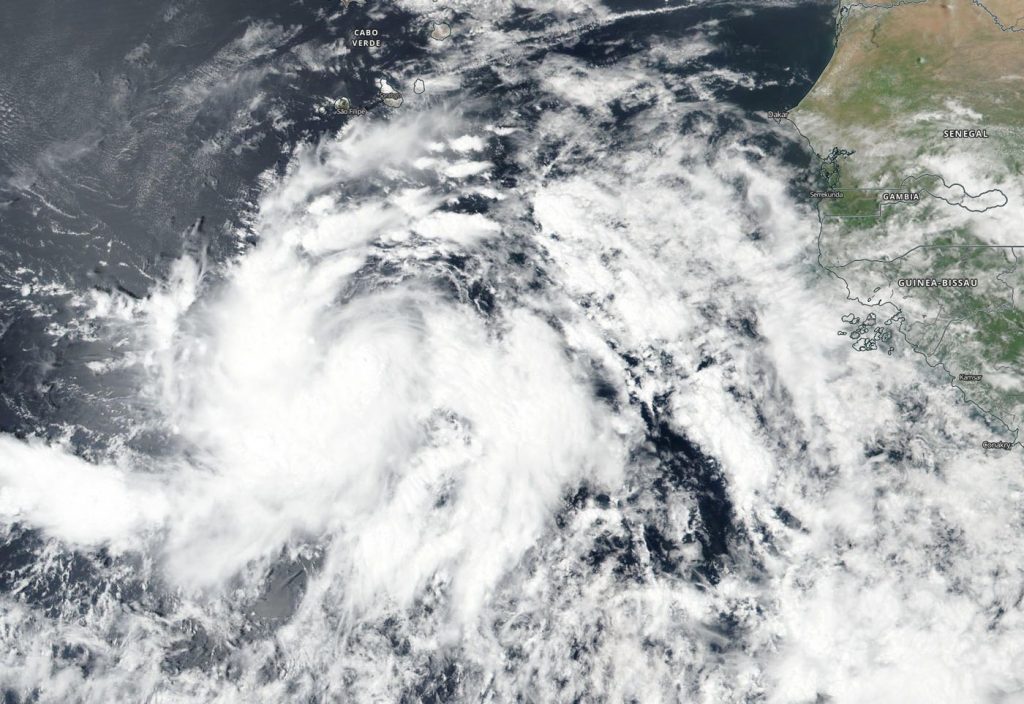
Tropical Storm Lorenzo continued to strengthen and appeared more organized on visible imagery from NASA-NOAA’s Suomi NPP satellite.

Suomi NPP image of Lorenzo
On Sept. 24, NASA-NOAA’s Suomi NPP satellite passed over the eastern Atlantic Ocean and provided forecasters with this visible image of a more organized Tropical Storm Lorenzo. Credit: NASA/NOAA/NRL

The shape of the storm is a clue to forecasters that a storm is either strengthening or weakening. If a storm takes on a more rounded shape it is getting more organized and strengthening. Conversely, if it becomes less rounded or elongated, it is a sign the storm is weakening.

On Sept. 24, the Visible Infrared Imaging Radiometer Suite (VIIRS) instrument aboard Suomi NPP provided a visible image of Lorenzo and showed it had become more organized over the previous 24 hours. The VIIRS image showed that many curved bands of thunderstorms have formed around the low-level center and there is a newly formed central dense overcast. A microwave image taken in the overnight hours showed that Lorenzo already had a very small central core.

NOAA’s National Hurricane Center or NHC said Lorenzo is located near latitude 12.0 degrees north and longitude 28.0 degrees west. Lorenzo is centered about 301 miles (500 km) southwest of the southwestern most Cabo Verde Islands. Lorenzo is moving toward the west-northwest near 16 mph (26 kph). This general motion with some decrease in forward speed is expected for the next couple of days, followed by a turn to the northwest on Thursday. Maximum sustained winds have increased to near 65 mph (100 kph) with higher gusts. The estimated minimum central pressure is 999 millibars.

Conditions seem to be ripe for further intensification because Lorenzo is moving over warm waters, is surrounded by humid mid-level air, and is only dealing with weak to moderate wind shear (outside winds that if strong enough can weaken a storm). Lorenzo is forecast to become a hurricane later today, Sept. 24. NHC forecasters said that Lorenzo could become a major hurricane on Thursday, Sept. 26.

Hurricanes are the most powerful weather event on Earth. NASA’s expertise in space and scientific exploration contributes to essential services provided to the American people by other federal agencies, such as hurricane weather forecasting.

For updated forecasts. Visit: www.nhc.noaa.gov

By Rob Gutro 
NASA’s Goddard Space Flight Center

Lorenzo – Atlantic Ocean

Sep. 23, 2019 – Heavy Rainfall found in Tropical Storm Lorenzo by NASA

NASA calculated the rainfall rates in the Atlantic Ocean’s newest tropical cyclone, Lorenzo.

GPM image of Lorenzo
The GPM core satellite passed over the eastern Atlantic Ocean on Sept. 23 at 7:46 a.m. EDT (1146 UTC) and provided rainfall rates in Tropical Storm Lorenzo. The heaviest rainfall (pink) was occurring around the center, falling at a rate of over 36 mm (about 1.4 inch) per hour and at a rate of (orange) 25 mm (about 1 inch) per hour around a band of thunderstorms southeast of center. Credit: NASA/JAXA/NRL

NASA has the unique capability of peering under the clouds in storms and measuring the rate in which rain is falling. Global Precipitation Measurement mission or GPM core satellite passed over the region from its orbit in space and measured rainfall rates in the storms.

The Global Precipitation Measurement mission or GPM core satellite passed over the eastern North Atlantic Ocean on Sept. 23 at 7:46 a.m. EDT (1146 UTC) and provided rainfall rates in Tropical Storm Lorenzo. The heaviest rainfall was occurring around the center, falling at a rate of over 36 mm (about 1.4 inch) per hour and at a rate of 25 mm (about 1 inch) per hour around a band of thunderstorms southeast of center. Both the Japan Aerospace Exploration Agency, JAXA and NASA manage GPM.

Forecasters at NOAA’s National Hurricane Center or NHC noted at 11 a.m. EDT (1500 UTC), the center of Tropical Storm Lorenzo was located near latitude 11.1 degrees north and longitude 24.1 degrees west. Interests in the Cabo Verde Islands should monitor the progress of this system.

Lorenzo is moving toward the west near 18 mph (30 kph). Maximum sustained winds have increased to near 40 mph (65 kph) with higher gusts. Additional strengthening is forecast, and Lorenzo is expected to become a hurricane by Wednesday. The estimated minimum central pressure is 1006 millibars. A motion toward the west-northwest is expected starting tonight, and this is forecast to continue through the middle of the week. On the forecast track, the center of the tropical storm should pass well to the south of the Cabo Verde Islands today and tonight.

Hurricanes are the most powerful weather event on Earth. NASA’s expertise in space and scientific exploration contributes to essential services provided to the American people by other federal agencies, such as hurricane weather forecasting.

For updated forecasts, visit: www.nhc.noaa.gov

By Rob Gutro
NASA’s Goddard Space Flight Center