Nestor – Atlantic Ocean

Oct. 19, 2019 – NASA Finds Heaviest Rain on Tropical Storm Nestor’s Eastern Side

NASA imagery revealed that the eastern quadrant of Tropical Storm Nestor contains the storm’s heaviest rain rates. That side of the storm has been drenching Florida, as seen in a satellite image from the Global Precipitation Measurement mission or GPM core satellite on Oct. 19.

GPM image of Nestor
GPM passed over the Gulf of Mexico on Oc. 19 at 3:51 a.m. EDT (0751 UTC) and provided rainfall rates in Tropical Storm Nestor. The heaviest rainfall was occurring in the eastern side of the storm, over Florida and falling at a rate of over 36 mm (about 1.4 inch) per hour and at a rate of 25 mm (about 1 inch) per hour. Credit: NASA/NRL

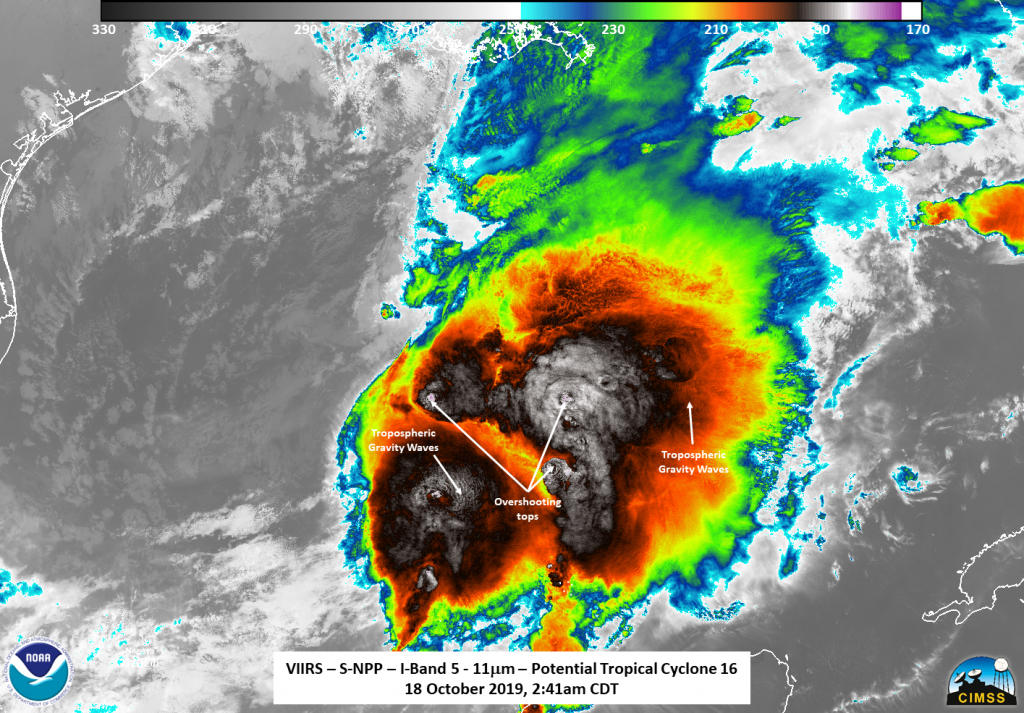
NASA has the unique capability of peering under the clouds in storms and measuring the rate in which rain is falling. GPM passed over the region from its orbit in space and measured rainfall rates in these storms.

GPM passed over the Gulf of Mexico on Oct. 19 at 3:51 a.m. EDT (0751 UTC) and provided rainfall rates in Tropical Storm Nestor. The heaviest rainfall was occurring in the eastern side of the storm, over Florida and falling at a rate of over 36 mm (about 1.4 inch) per hour and at a rate of 25 mm (about 1 inch) per hour.

Forecasters at NOAA’s National Hurricane Center or NHC incorporate the rainfall data into their forecasts. NHC said, “Nestor is expected to produce total rainfall accumulations of 2 to 4 inches this weekend across portions of the southeastern United States, with isolated maximum amounts of 8 inches.”

On Oct. 19, a Tropical Storm Warning is in effect from Florida’s Okaloosa/Walton County line to Yankeetown, Florida. A Storm Surge Warning is in effect from Indian Pass, Florida to Clearwater Beach, Florida.

At 8 a.m. EDT (1200 UTC), satellite imagery, NOAA Doppler weather radar data, and surface observations indicate that the center of Tropical Storm Nestor has redeveloped farther west near latitude 29.5 north, longitude 86.8 west. That’s just 80 miles(125 km) west-southwest of Panama City, Florida.

Nestor is moving toward the northeast near 17 mph (28 kph). A turn toward the east-northeast is forecast to occur Sunday. Doppler radar data and surface observations indicate that maximum sustained winds remain near 50 mph (85 km/h) with higher gusts.

Tropical-storm-force winds extend outward up to 160 miles (260 km) mainly to the east of the center. The minimum central pressure based on nearby surface observations is estimated to be 996 millibars.

The Tyndall Air Force Base Tower located south of Apalachicola, Florida, recently reported a sustained wind of 49 mph (80 km/h) and a gust of 61 mph (98 km/h) at an elevation of 115 feet (35 m). A National Ocean Service tide gauge at Apalachicola, Florida, recently measured a water level of 3.2 feet above Mean Higher High Water.

No change in strength is anticipated before Nestor reaches the coast, but weakening is forecast to begin after the cyclone moves inland. Nestor is expected to lose tropical characteristics and become post-tropical by early afternoon today, Oct. 19. On the forecast track, Nestor is expected to make landfall on the Florida Panhandle around mid-day, Oct. 19, and will then move across portions of the southeastern United States later today and Sunday as a post-tropical cyclone. Nestor is expected to move offshore of the coast of North Carolina into the western Atlantic by late Sunday also as a post-tropical cyclone.

Hurricanes are the most powerful weather event on Earth. NASA’s expertise in space and scientific exploration contributes to essential services provided to the American people by other federal agencies, such as hurricane weather forecasting.

For updated forecasts, visit: www.nhc.noaa.gov

By Rob Gutro
NASA’s Goddard Space Flight Center

Nestor – Atlantic Ocean

Oct. 18, 2019 – NASA-NOAA Satellite Finds Overshooting Tops, Gravity Waves in Tropical Storm Nestor

NASA-NOAA’s Suomi NPP satellite provided night-time and infrared views of developing Tropical Storm Nestor in the Gulf of Mexico and found over-shooting cloud tops and gravity waves. When the satellite passed over the potential tropical depression early on Oct. 18, it was consolidating. Less than 12 hours later, it became a tropical storm.

Suomi NPP image of NEstor
NASA-NOAA’s Suomi NPP satellite provided a night-time view of developing Tropical Storm Nestor in the Gulf of Mexico on Oct. 18 at 3:41 a.m. EDT. The image revealed lightning, overshooting cloud tops into the stratosphere and gravity waves. Credit: NASA/NOAA/UWM-CIMSS, William Straka III

The Visible Infrared Imaging Radiometer Suite (VIIRS) instrument aboard Suomi NPP provided a night-time and an infrared image of the storm.

Night-time Imagery of Nestor: Overshooting Tops, Gravity Waves

The night-time image was captured on Oct. 18 at 3:41 a.m. EDT and revealed lightning, overshooting cloud tops into the stratosphere and gravity waves. An overshooting cloud top is a dome-like protrusion above a cumulonimbus anvil cloud, often penetrating into the lower stratosphere. It indicates a very strong updraft in the convective cloud or thunderstorm.

Gravity waves are the mark of a powerful storm. They are created when air moving around the atmosphere gets pushed to another place as in the case of tropical cyclones. Powerful thunderstorms around a tropical cyclone’s center can move air up and down and generate these waves in quick, short bursts. They can be seen as ripples in some imagery of clouds in a tropical cyclone.

Infrared Imagery Shows Very Cold Cloud Tops

Suomi NPP image of Nestor
NASA-NOAA’s Suomi NPP satellite provided an infrared view of developing Tropical Storm Nestor in the Gulf of Mexico on Oct. 18 at 3:41 a.m. EDT. Around the center of circulation cloud top temperatures were as cold as or colder than minus 112 degrees Fahrenheit (minus 80 Celsius) (n black). Credit: NASA/NOAA/UWM-CIMSS, William Straka III

The infrared imagery captured by Suomi NPP’s VIIRS instrument on Oct. 18 at 3:41 a.m. EDT showed powerful thunderstorms with cloud tops colder than minus 112 degrees Fahrenheit (minus 80 degrees Celsius) within the eastern part of the storm.

Visible satellite imagery and data from an Air Force Reserve Hurricane Hunter aircraft also showed a rather large and elongated surface circulation.

Warnings and Watches

NOAA’s National Hurricane Center or NHC said a Tropical Storm Warning is in effect from the Mississippi/Alabama border to Yankeetown, Florida and from Grand Isle, Louisiana to the Mouth of the Pearl River. A Storm Surge Warning is in effect from Indian Pass, Florida to Clearwater Beach, Florida.

Nestor’s Status on October 18, 2019

At 2 p.m. EDT (1800 UTC), the center of Tropical Storm Nestor was located near latitude 26.3 degrees north and longitude 89.5 degrees west. That is 195 miles (315 km) south of the mouth of the Mississippi River. Nestor is moving toward the northeast near 22 mph (35 kph), and this general motion is expected to continue through Sunday, followed by a turn toward the east-northeast by early Monday. Maximum sustained winds are near 60 mph (95 kph) with higher gusts. Some strengthening is expected later today, with weakening forecast after Nestor moves inland. Nestor is expected to lose tropical characteristics and become post-tropical on Saturday. The estimated minimum central pressure is 1001 millibars.

Nestor’s Forecast

The National Hurricane Center forecast calls for the center of Nestor to approach the northern Gulf Coast later on Oct. 18 and move inland across portions of the southeastern United States Saturday and Sunday as it becomes a post-tropical cyclone. Nestor is expected to move offshore of the coast of North Carolina into the western Atlantic by late Sunday.

Hurricanes are the most powerful weather event on Earth. NASA’s expertise in space and scientific exploration contributes to essential services provided to the American people by other federal agencies, such as hurricane weather forecasting.

For updated forecasts. Visit: www.nhc.noaa.gov

By Rob Gutro 
NASA’s Goddard Space Flight Center