Vongfong – Northwestern Pacific Ocean

May 17, 2020 – NASA Finds Vongfong a Depression, Last Advisory Issued

NASA-NOAA’s Suomi NPP satellite provided a look at the cloud top temperatures of Vongfong, once a typhoon, now weakened to a tropical depression and expected to dissipate by May 17.
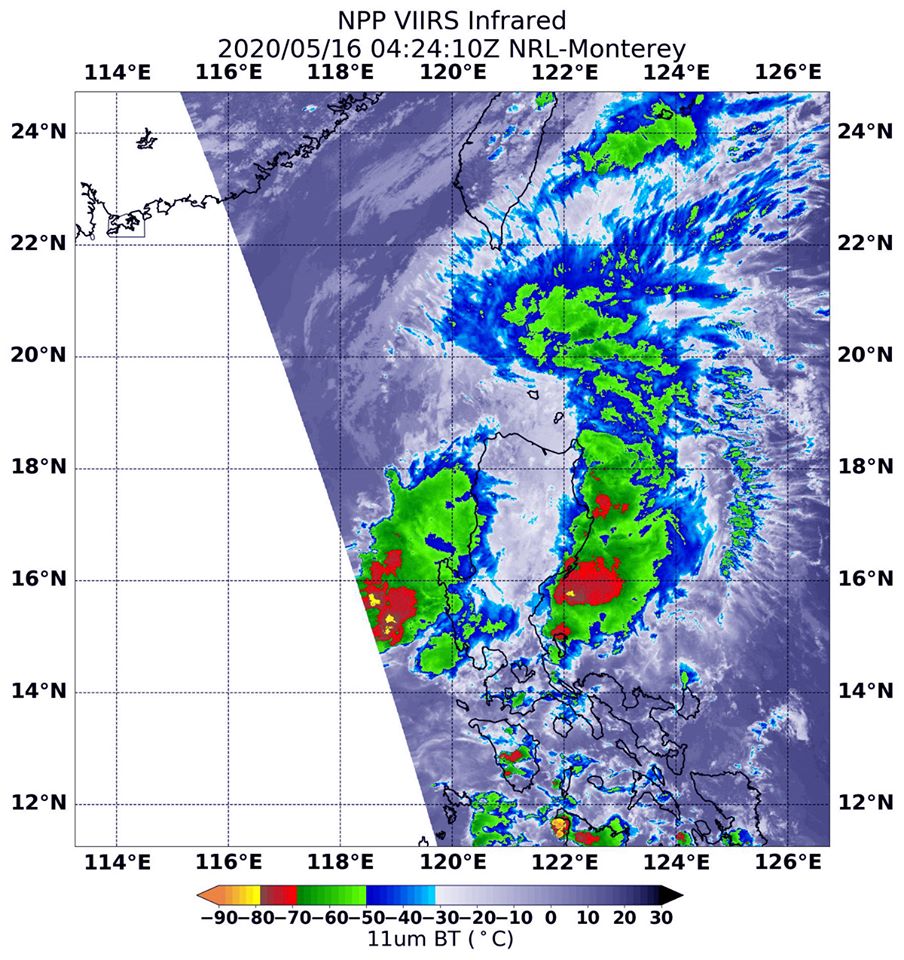
Suomi NPP image of Vongfong
On May 17, NASA-NOAA’s Suomi NPP satellite provided an infrared image of the storm that showed strongest storms were off shore from Luzon, located northeast and northwest of Luzon, where cloud top temperatures were as cold as minus 70 degrees Fahrenheit (red color). Those storms were generating heavy rain. Credit: NASA/NOAA/NRL

At 5 a.m. EDT (0900 UTC) on Saturday, May 16, the Joint Typhoon Warning Center or JTWC issued the final advisory on Tropical Depression Vongfong.  At that time, Tropical Depression Vongfong (Philippines designation Ambo) was located near latitude 19.3 degrees north and longitude 120.5 degrees east, about 101 miles north of Vigan, Philippines. Vongfong was moving northeast. Maximum sustained winds dropped to 25 knots (28.7 mph)

The Visible Infrared Imaging Radiometer Suite (VIIRS) instrument aboard NASA-NOAA’s Suomi NPP satellite provided an infrared image that showed the strongest storms associated with the depression were located offshore, northeast and northwest of Luzon. In those strongest storms, cloud top temperatures were as cold as minus 70 degrees Fahrenheit. Those storms were generating heavy rain.

On May 16, Philippines warnings were still in effect. They included Tropical cyclone wind signal number 2 for Luzon: Ilocos Norte. In addition, Tropical cyclone wind signal number 1 was in effect for these areas in Luzon: Apayao, Abra, Ilocos Sur, La Union, Batanes, Babuyan Islands, and the northwestern portion of Cagayan.

Vongfong’s center had emerged over water west of Luzon and was dissipating.

By Rob Gutro 
NASA’s Goddard Space Flight Center


May 16, 2020 – NASA’s IMERG Measures Typhoon Vongfong’s Rainfall
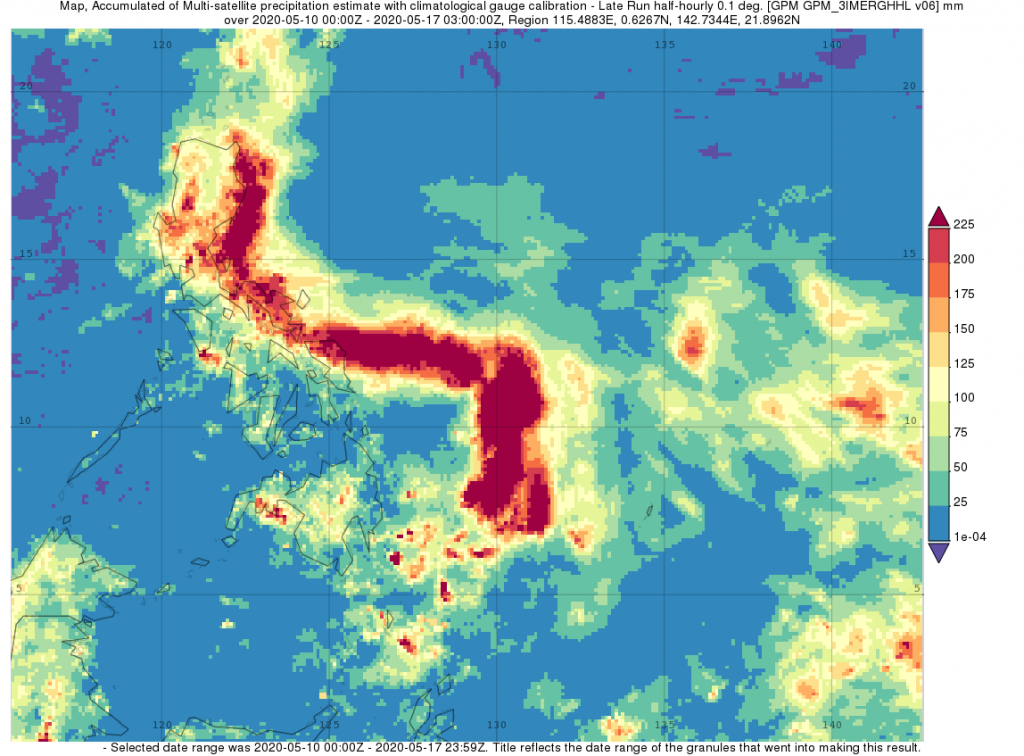
Surface rainfall accumulations (mm) estimated from the NASA IMERG satellite precipitation product from 10 to 17 May 2020 in association with the passage of Typhoon Vongfong. Image from NASA GSFC using IMERG data archived at https://giovanni.gsfc.nasa.gov/giovanni/. This image was produced with the Giovanni online data system, developed and maintained by the NASA GES DISC.

The first typhoon of the season, Vongfong, struck the central Philippines this past week (where it is known as Ambo) as a strong category 2 storm, bringing strong winds and locally heavy rainfall. NASA’s IMERG calculated  locally heavy rainfall on the order of 200 mm (~8 inches) or more to the northern half of Samar where it made landfall as well as to southern, far eastern and isolated parts of central Luzon.  For the full story:  https://gpm.nasa.gov/articles/typhoon-vongfong-hits-philippines

By Steve Lang
NASA Goddard Space Flight Center


May 15, 2020 – Look Back: Vongfong Makes Landfall in the Philippines
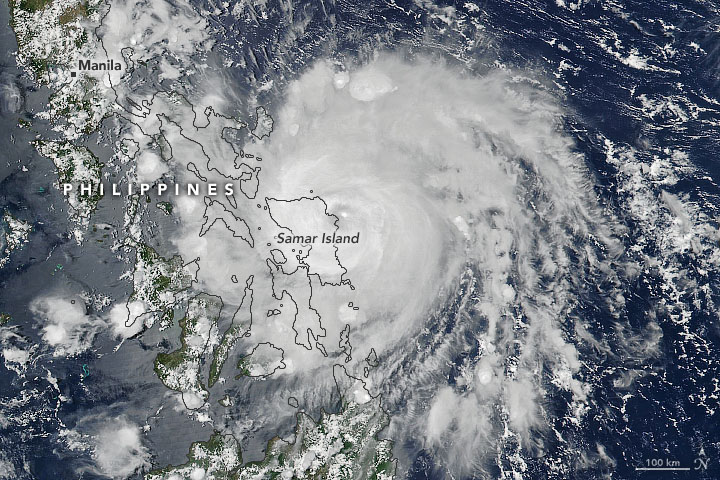
Suomi NPP image of Vongfong
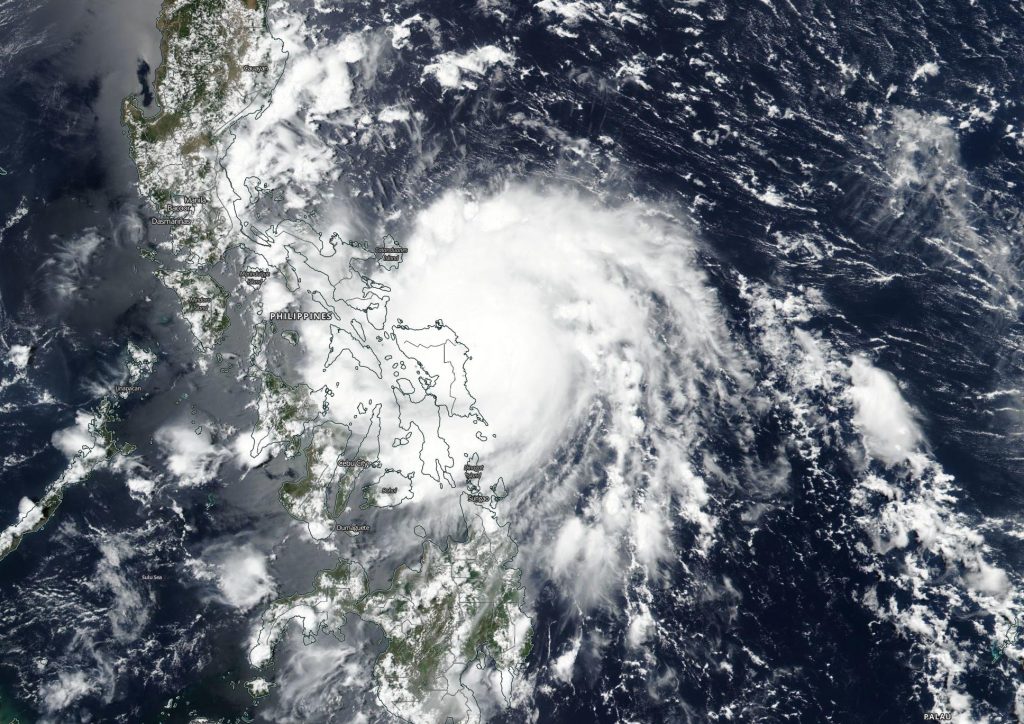
Just after midday on May 14, the Visible Infrared Imaging Radiometer Suite (VIIRS) on the NOAA-NASA Suomi NPP satellite acquired this natural-color image of Typhoon Vongfong. Credit: NOAA/NASA

The first tropical storm in the Western Pacific Ocean in 2020 did not form until May 12. By May 14, it was making landfall in the Philippines with fierce winds and heavy rainfall. Civil authorities worked to evacuate tens to hundreds of thousands of people from coastal and mountainous areas prone to flooding and landslides. For the entire story: https://earthobservatory.nasa.gov/images/146719/vongfong-makes-landfall-in-the-philippines/?src=eoa-iotd

By NASA Earth Observatory–image by Joshua Stevens, using VIIRS data from NASA EOSDIS/LANCE and GIBS/Worldview and the Suomi National Polar-orbiting Partnership. Story by Michael Carlowicz.

Vongfong – Northwestern Pacific Ocean

May 15, 2020 – NASA-NOAA Satellite Shows a Weaker Tropical Cyclone Vongfong Over the Philippines

After Tropical Cyclone Vongfong made landfall in the Philippines early on May 14 and began tracking through the country, imagery from NASA-NOAA’s Suomi NPP satellite showed the storm was weakening.

Suomi NPP infrared image of Vongfong
On May 14 at 1:34 p.m. EDT (1734 UTC), NASA-NOAA’s Suomi NPP infrared satellite imagery showed the eye has now closed and convection has diminished within the eastern semicircle of the system, evident in the warming cloud tops. The diminished convection could also be seen in imagery as compared to yesterday, where convection surrounded the circulation. The darker red indicates colder cloud tops and stronger storms. Credit: NASA/NOAA/UWM-CIMSS, William Straka III

On May 14, 2020, Typhoon Vongfong became the first typhoon of the 2020 West Pacific season. It came ashore as a typhoon and by May 15, it had weakened to a tropical storm.

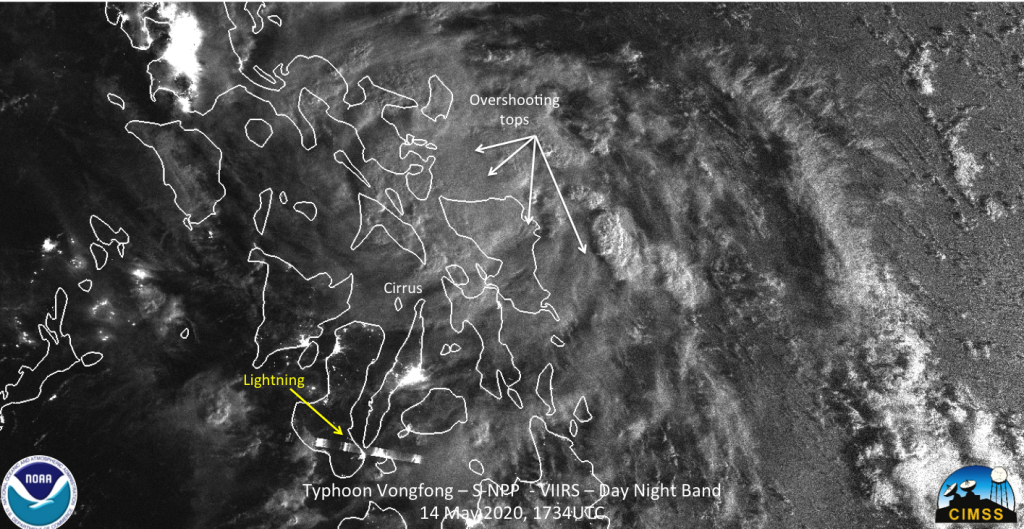
On May 14, NOAA-20 satellite imagery showed features that one would expect from a tropical system, including overshooting tops and tropospheric gravity waves. On May 14 at 1:34 p.m. EDT (1734 UTC), “NASA-NOAA’s Suomi NPP infrared satellite imagery showed the eye has now closed and convection has diminished within the eastern semicircle of the system, evident in the warming cloud tops,” said William Straka III of the University of Wisconsin-Madison, who created night-time and infrared images. “The diminished convection could also be seen in imagery as compared to yesterday, where convection completely surrounded the circulation.”

Suomi NPP image of Vongfong
On May 14 at 1:34 p.m. EDT (1734 UTC), night-time NASA-NOAA’s Suomi NPP infrared satellite imagery showed convection (developing thunderstorms) in Vongfong had diminished within the eastern semicircle of the system. The diminished convection could also be seen in imagery as compared to yesterday where convection surrounded the circulation. The nighttime image also showed a lightning streak on one of the southern feeder bands. Credit: NASA/NOAA/UWM-CIMSS, William Straka III

The nighttime image also showed a lightning streak on one of the southern feeder bands around Vongfong’s center. The imagery also showed that the circulation was not surrounded by convection (thunderstorms). The surface rain product showed potentially some clear air (no rain) intruding into the circulation.  “The 88.0 GHz ATMS imagery from the Suomi-NPP satellite, while at lower resolution, did not show a circulation surrounded by convection. Rather, it showed just cold temperatures in the northeastern part of the storm where the convection was located,” Straka said.

On May 15 at 5 a.m. EDT (0900 UTC),  Tropical storm Vongfong (Philippines designation Ambo) was located near latitude 14.1 degrees north and longitude 121.9 degrees east, about 60 nautical miles east-southeast of Manila, Philippines. Vongfong was moving to the northwest and had maximum sustained winds 60 knots (69 mph/111 kph).

Because of the impacts to the Philippines, the Philippine Atmospheric, Geophysical and Astronomical Services Administration (PAGASA) are also tracking Typhoon Vongfong, which is called Ambo by PAGASA, to assess the impacts on the various islands in the path of the storm.

On May 15, PAGASA still had many warnings in effect, especially for the northern region of the Philippines as Vongfong moves through that area. Tropical cyclone wind signal number 2 is in effect for Luzon: that includes Ilocos Norte, Ilocos Sur, Apayao, Abra, Kalinga, La Union, Ifugao, Mountain Province, Benguet, Nueva Vizcaya, Quirino, Tarlac, Nueva Ecija, Aurora, Pampanga, Bulacan, Rizal, Metro Manila, Laguna, the eastern portion of Pangasinan, the western portion of Isabela, Cavite, Quezon including Pollilo Islands, Camarines Norte, western portion of Camarines Sur , Marinduque, and Batangas. Tropical cyclone wind signal number 1 is in effect for Luzon: Cagayan including Babuyan Islands, Batanes, the rest of Pangasinan, Zambales, Bataan, Oriental Mindoro, Burias Island, the rest of Camarines Sur, the rest of Isabela, and the northern portion of Albay.

Vongfong will continue to move northwest across the island of Luzon and is forecast to turn northeast and become extra-tropical.

By Rob Gutro
NASA’s Goddard Space Flight Center

Vongfong – Northwestern Pacific Ocean

May 14, 2020 – Satellites Eye Typhoon Vongfong Landfall in the Philippines

NASA and NOAA satellites have been providing forecasters with satellite data that showed the strength and extent of Typhoon Vongfong as it made landfall in the Philippines and continued to track through the country. Warnings were in effect throughout several areas of the Philippines on May 14.

JPSS image of Vongfong
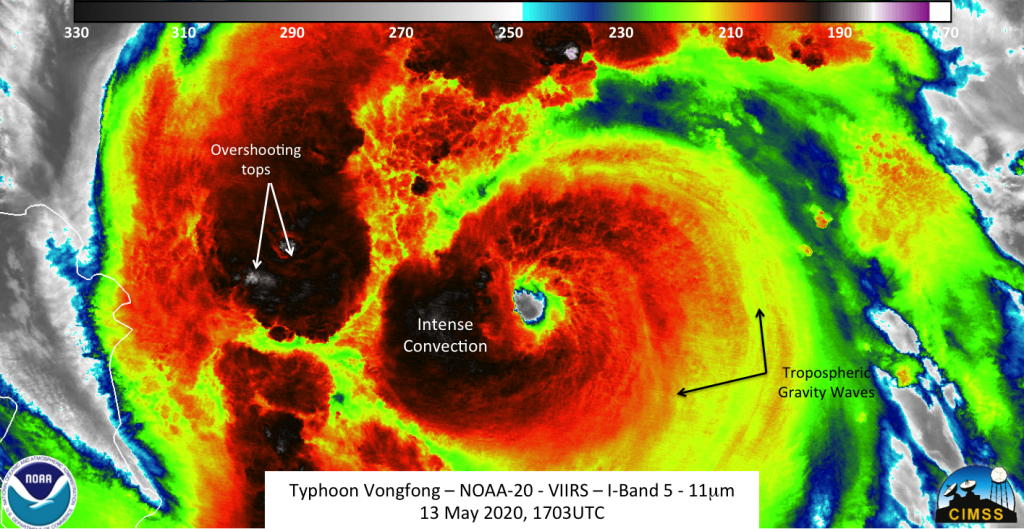
The NOAA-20 satellite saw Typhoon Vongfong at 12:03 p.m. EDT (1703 UTC) on May 13. The imagery showed features that’s expected from an intensifying storm, including overshooting tops and tropospheric gravity waves. In addition, a clear eye could be seen as well. Credit: NOAA/William Straka III, Univ. of Wisconsin Madison

The NOAA-20 satellite saw Typhoon Vongfong at 12:03 p.m. EDT (1703 UTC) on May 13. “The imagery showed features that one would expect from an intensifying storm, including overshooting tops and tropospheric gravity waves,” said William Straka III of the University of Wisconsin- Madison, who created the imagery using the satellite data. “In addition, a clear eye could be seen as well.”

The infrared image also showed cloud top temperatures. Coldest cloud top temperatures are indicative of strongest storms because their cloud tops are pushed high into the atmosphere by strong uplift of air. NOAA-20 showed that the colder temperatures (where the convection is located) surrounds the circulation center, a sign of a mature tropical system.

The Visible Infrared Imaging Radiometer Suite (VIIRS) instrument aboard NASA-NOAA’s Suomi NPP satellite provided a visible image of Typhoon Vongfong as it was making landfall in the east central Philippines on May 14. Vongfong made landfall in Samar. Samar is the third largest island in the Philippines, and is located in eastern Visayas region.

Suomi NPP Image of Vongfong
NASA-NOAA’s Suomi NPP satellite provided a visible image of Typhoon Vongfong as it was making landfall in the east central Philippines on May 14. The image revealed the eye was no longer visible. Credit: NASA Worldview

The VIIRS image showed bands of powerful thunderstorms north of the center and tightly around the center of circulation. Visible imagery has revealed that the eye has closed as the storm has started to weaken.

Warnings are posted throughout the Philippines on May 14.  Tropical cyclone wind signal number #3 is in effect for Visayas: including Northern Samar and northern parts of eastern Samar and of Samar Luzon: Sorsogon, Albay, Masbate, Ticao Islands, Burias Islands, Catanduanes, southern parts of Camarines Sur. Tropical cyclone wind signal number 2 is also in effect for Visayas: for the northernmost part of Leyte, rest of Samar and rest of eastern Samar. Wind signal 2 is also in effect for Luzon: Camarines Norte, rest of Camarines Sur, southern parts of Quezon and Marinduque.  Tropical cyclone wind signal number 1 covers Visayas and Luzon. In Visayas: Wind Signal 1 covers the rest of northern portion of Leyte, northeastern parts of Capiz and of Iloilo, and in Luzon: it covers Aurora, Bulacan, Metro Manila, Cavite, Laguna, Batangas, Rizal, rest of Quezon, Romblon, Bataan and Pampanga.

At 11 a.m. EDT (1500 UTC) on May 14, the Joint Typhoon Warning Center (JTWC) noted that the center of Vongfong was located near latitude 12.5 degrees north and longitude 124.5 degrees east, about 266 nautical miles east-southeast of Manila, Philippines. Vongfong was moving to the northwest and maximum sustained winds had decreased from 100 knots (115 mph/185 kph) to 85 knots (98 mph/157 kph) over the previous six hours.

The forecast from JTWC has Typhoon Vongfong weakening as it moves on a northerly track over the Visayas and Luzon regions of the Philippines, and then finally curving back into the Northwestern Pacific Ocean.

By Rob Gutro/ William Straka III
NASA’s Goddard Space Flight Center/University of Wisconsin Madison/SSEC/CIMSS

Vongfong – Northwestern Pacific Ocean

May 13, 2020 – NASA Finds Vongfong at Typhoon Strength Philippine Warnings Up

NASA’s Terra satellite revealed powerful storms in Vongfong as it ramped up from a tropical storm to a typhoon. Vongfong is known locally in the Philippines as Typhoon Ambo.

Terra image of Vongfong
On May 13 at 9:25 a.m. EDT (1325 UTC), the MODIS instrument aboard NASA’s Terra satellite gathered temperature information about Typhoon Vongfong’s cloud tops. MODIS found two large areas of powerful thunderstorms (red) where temperatures were as cold as or colder than minus 70 degrees Fahrenheit (minus 56.6 Celsius). Credit: NASA/NRL

NASA’s Terra satellite used infrared light to analyze the strength of storms in Vongfong. Infrared data provides temperature information, and the strongest thunderstorms that reach high into the atmosphere have the coldest cloud top temperatures.

On May 13 at 9:25 a.m. EDT (1325 UTC), the Moderate Resolution Imaging Spectroradiometer or MODIS instrument aboard NASA’s Terra satellite gathered temperature information about Typhoon Vongfong’s cloud tops. MODIS found two large areas of powerful thunderstorms north and west of the center of circulation where temperatures were as cold as or colder than minus 70 degrees Fahrenheit (minus 56.6 Celsius). Cloud top temperatures that cold indicate strong storms with the potential to generate heavy rainfall.

Warnings in the Philippines include Tropical cyclone wind signal number #1 for the Visayas region: northern parts of Samar and northern parts of eastern Samar; and for the Luzon region:  Sorsogon, Ticao Island, Catanduanes, southern parts of Albay.

At 5 a.m. EDT (0900 UTC) on May 13, 2020, the Joint Typhoon Warning Center noted that Vongfong (Ambo) was located near latitude 12.0 degrees north and longitude 128.5 degrees east, about 465 nautical miles east-southeast of Manila, Philippines. Vongfong was moving to the west-northwest and had maximum sustained winds 70 knots (80 mph/130 kph).

Vongfong is strengthening. The storm is expected to peak at 100 knots (115 mph/185 kph) as it passes east of the Visayas islands, and then begin to weaken.

Typhoons and hurricanes are the most powerful weather events on Earth. NASA’s expertise in space and scientific exploration contributes to essential services provided to the American people by other federal agencies, such as hurricane weather forecasting.

By Rob Gutro
NASA’s Goddard Space Flight Center

Vongfong – Northwestern Pacific Ocean

May 12, 2020 – NASA Sees Tropical Storm Vongfong Form and Threaten the Philippines

A low-pressure area that formed in the Northwestern Pacific Ocean several days ago has consolidated and organized into a tropical storm. NASA’s Aqua satellite provided forecasters with a visible image of newly formed Tropical Storm Vongfong.

Aqua image of Vongfong
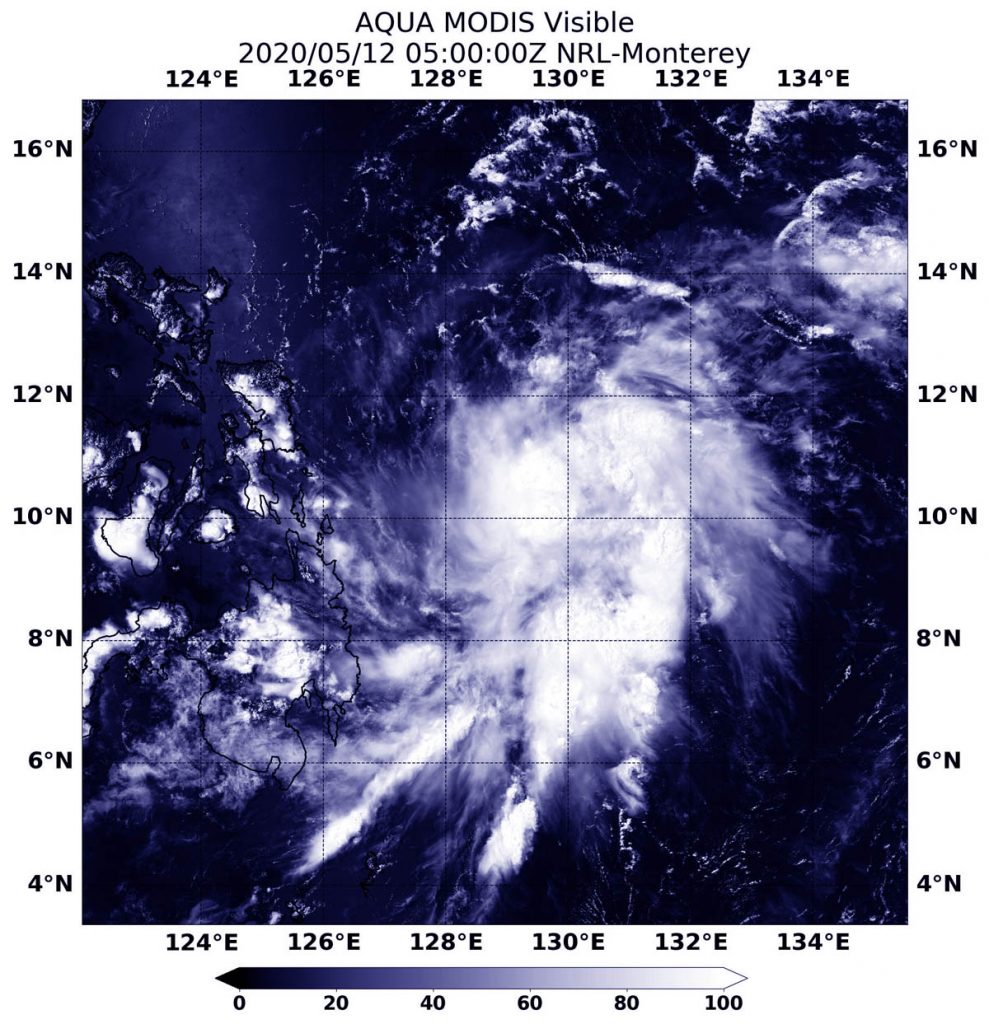
On May 12, 2020, the MODIS instrument that flies aboard NASA’s Aqua satellite provided a visible image of newly developed Tropical Storm Vongfong, known locally in the Philippines as Ambo, in the Northwestern Pacific Ocean. Credit: NASA/BRL

Vongfong, known locally as Ambo in the Philippines, threatens that country, according to the forecasts from the Joint Typhoon Warning Center or JTWC. The storm is also the first of tropical cyclone of the Northwestern Pacific Ocean typhoon season.

On May 12, the Moderate Resolution Imaging Spectroradiometer or MODIS instrument that flies aboard NASA’s Aqua satellite provided a visible image of Vongfong that showed the storm had a more rounded shape than it did the previous day, as it continued to consolidate. A more rounded shape in a tropical cyclone indicates it is becoming a more organized storm. Infrared satellite imagery also indicated cooling cloud top temperatures, which means that cloud tops are extending higher into the troposphere. The higher the cloud top, the stronger the uplift of air in a storm, and usually, the stronger the storm.

At 11 a.m. EDT (1500 UTC) on May 12, the JTWC noted that Vongfong had maximum sustained winds near 35 knots (40 mph/65 kph) with higher gusts. It was located near latitude 11.4 degrees north and longitude 128.8 degrees east, about 495 miles east-southeast of Manila, Philippines. Vongfong was moving to the north-northwest.

JTWC forecasters expect Vongfong (Ambo) will move west-northwest, and then later northwest before finally turning to the north. The storm is expected to strengthen to typhoon force with maximum sustained winds near 65 knots (75 mph/120 kph) as it passes over the Philippines archipelago.

PAGASA, Philippine Atmospheric, Geophysical and Astronomical Services Administration, the entity that issues forecasts and warnings for the country noted, “Between tonight and tomorrow (13 May) evening, Ambo (Vongfong) will bring scattered light to moderate with at times heavy rain showers during thunderstorms over Mindanao and Eastern Visayas. Between tomorrow evening and Thursday (14 May) evening, Ambo (Vongfong) will bring moderate to heavy rains over Eastern Visayas, Catanduanes, Albay, Sorsogon, and Masbate. Tropical Cyclone Wind Signal (TCWS) #1 may be raised over Eastern Samar and the eastern portion of Northern Samar in the next 6 to 12 hours in anticipation of strong winds associated with the approaching tropical storm.”

NASA’s Aqua satellite is one in a fleet of NASA satellites that provide data for hurricane research.

Tropical cyclones/hurricanes are the most powerful weather events on Earth. NASA’s expertise in space and scientific exploration contributes to essential services provided to the American people by other federal agencies, such as hurricane weather forecasting.

For additional forecasts and updates from PAGASA, visit: http://bagong.pagasa.dost.gov.ph/

By Rob Gutro
NASA’s Goddard Space Flight Center