Making It Work in the Field with ORACLES

Visible haze layer above and around some small cumulus clouds, as seen from the window of NASA’s Orion P-3 aircraft. Credit: NASA/Kristina Pistone

by Kristina Pistone / NASA Ames Research Center /

I’m not gonna lie: field work is probably my favorite part of the job as a scientist. Aside from my personal interest in visiting new places and cultures, having firsthand experience in data collection is valuable for when we return home and start doing the hard work of interpreting our observations to understand new things about Earth’s climate. While it’s often physically and mentally exhausting, being in the field provides a context that is difficult to get even from the most thorough notes by colleagues.

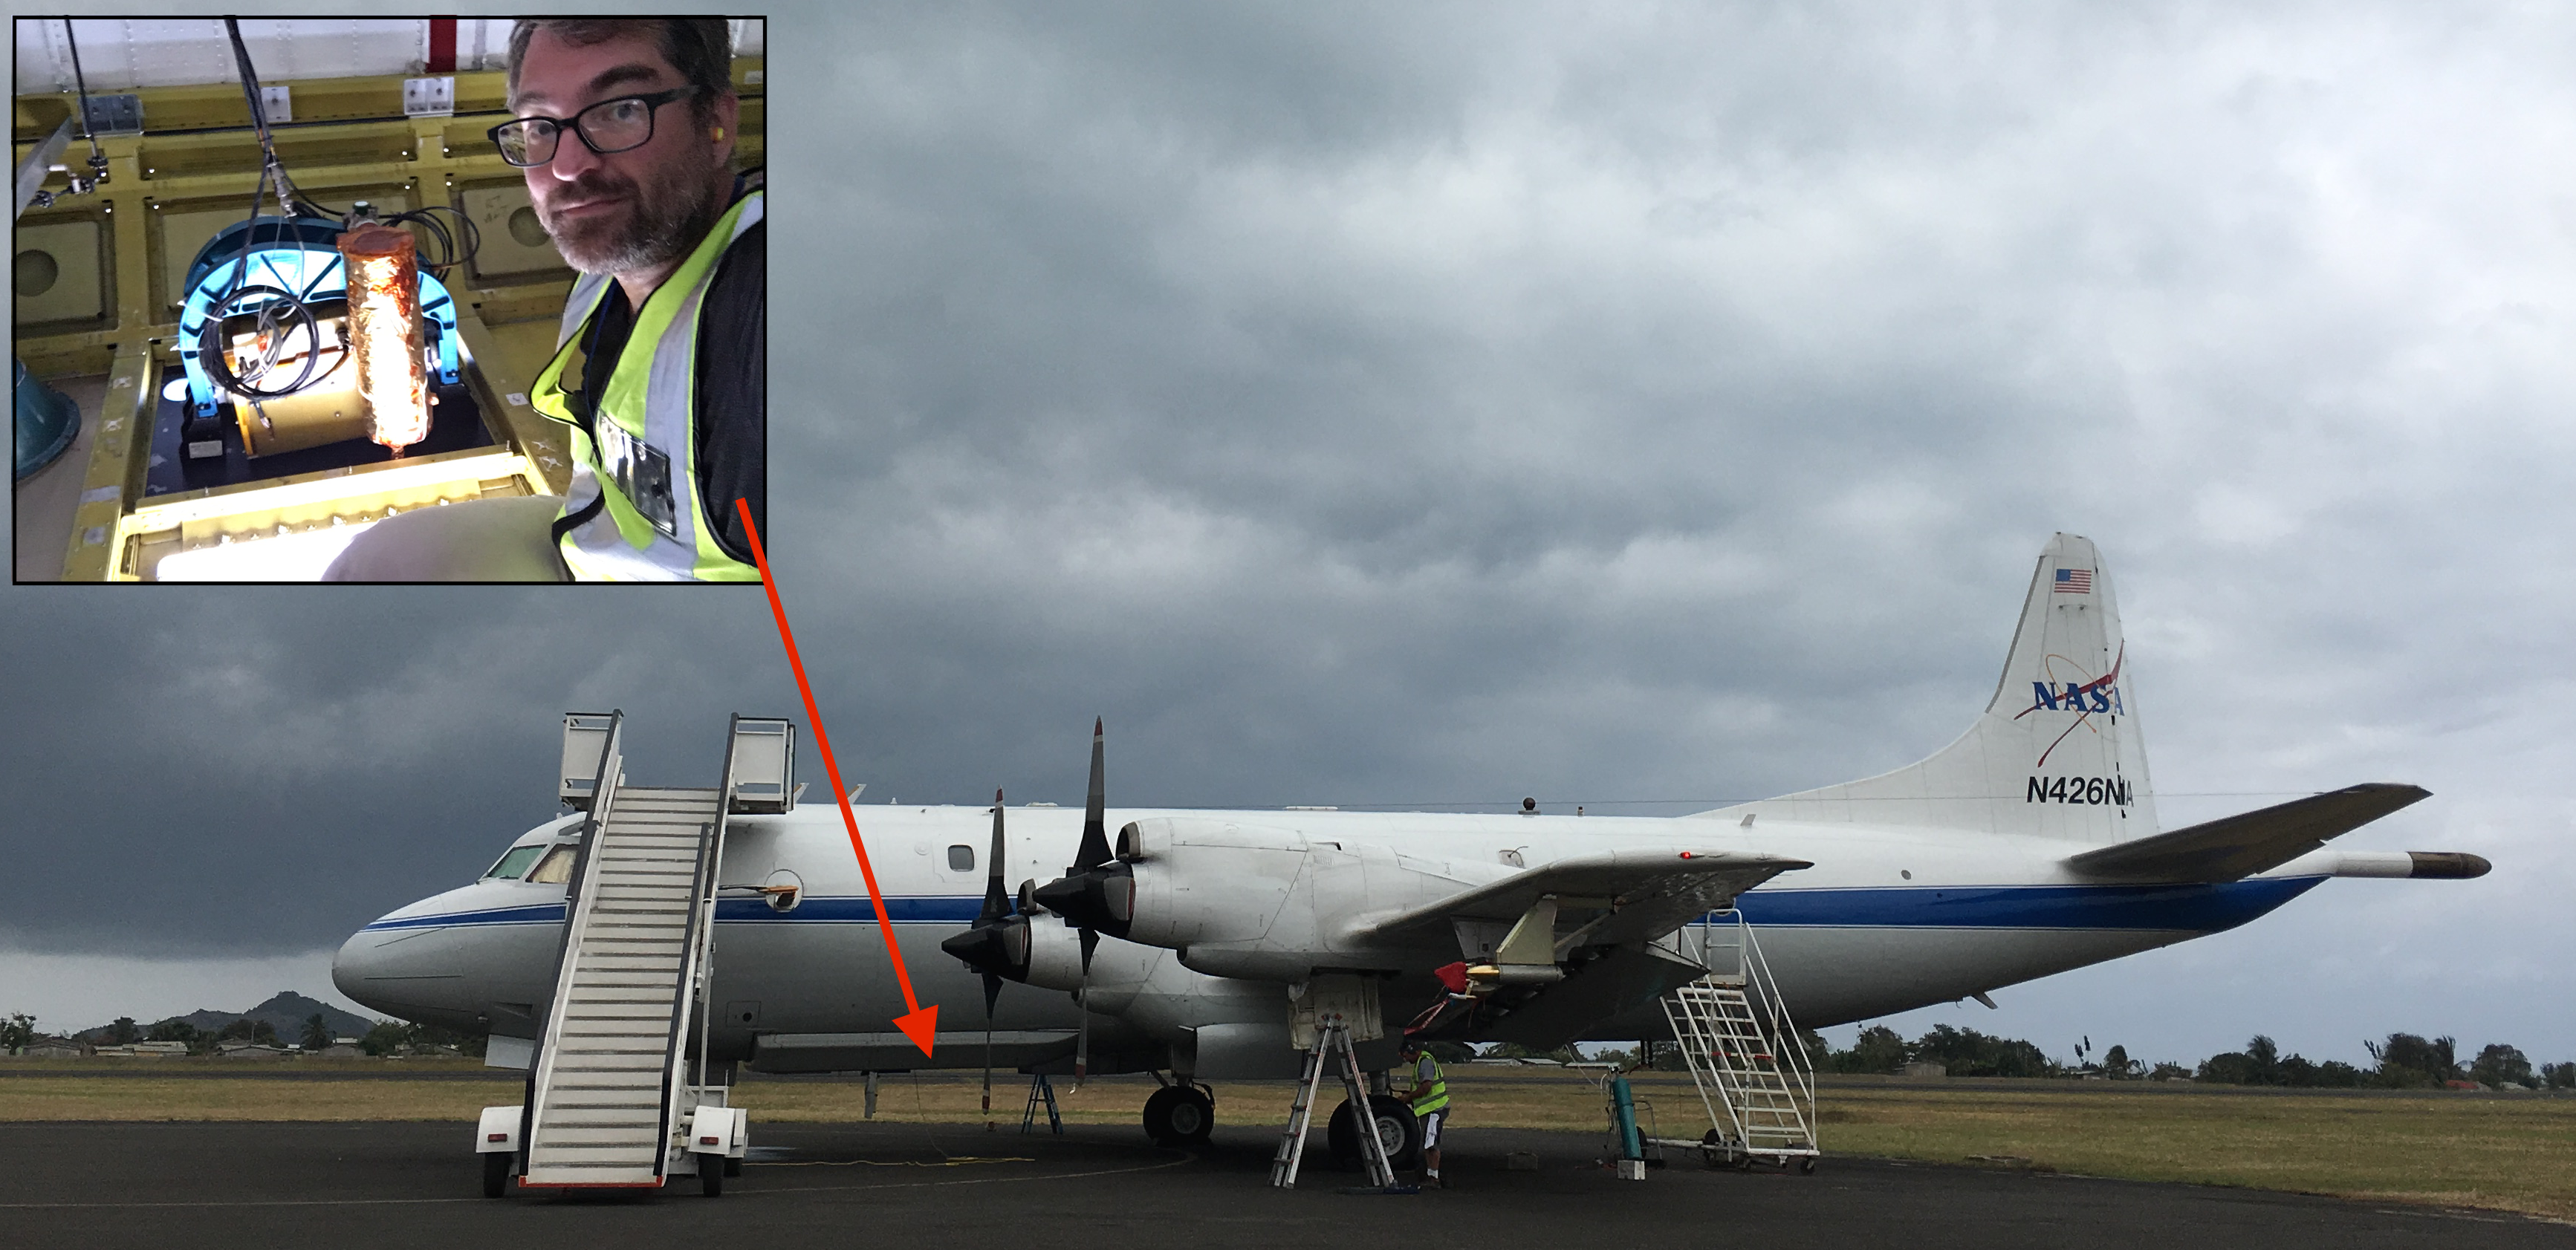
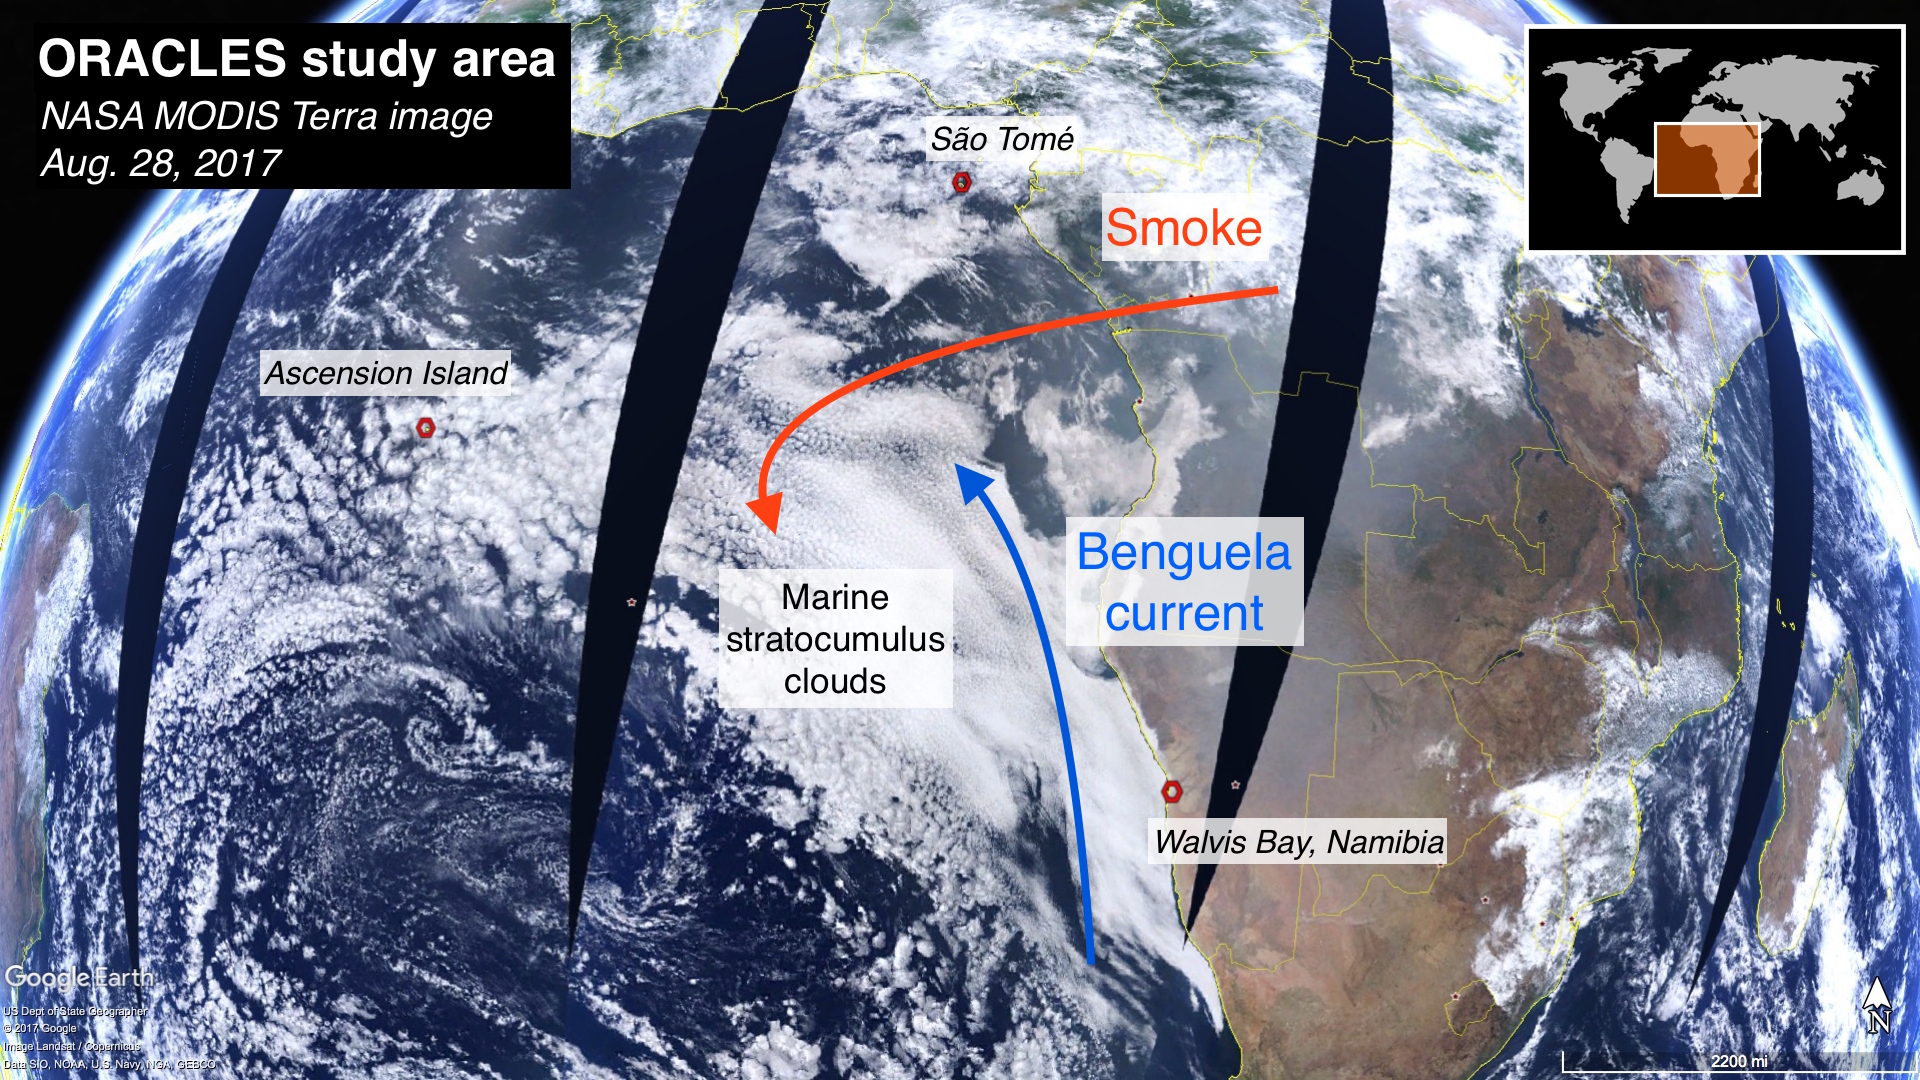
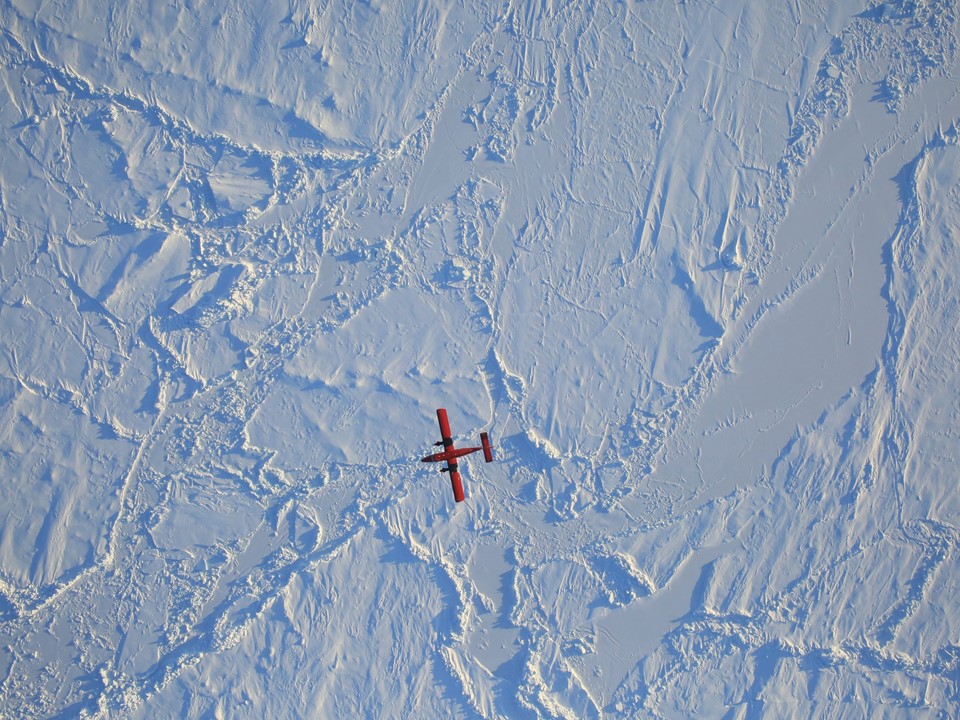
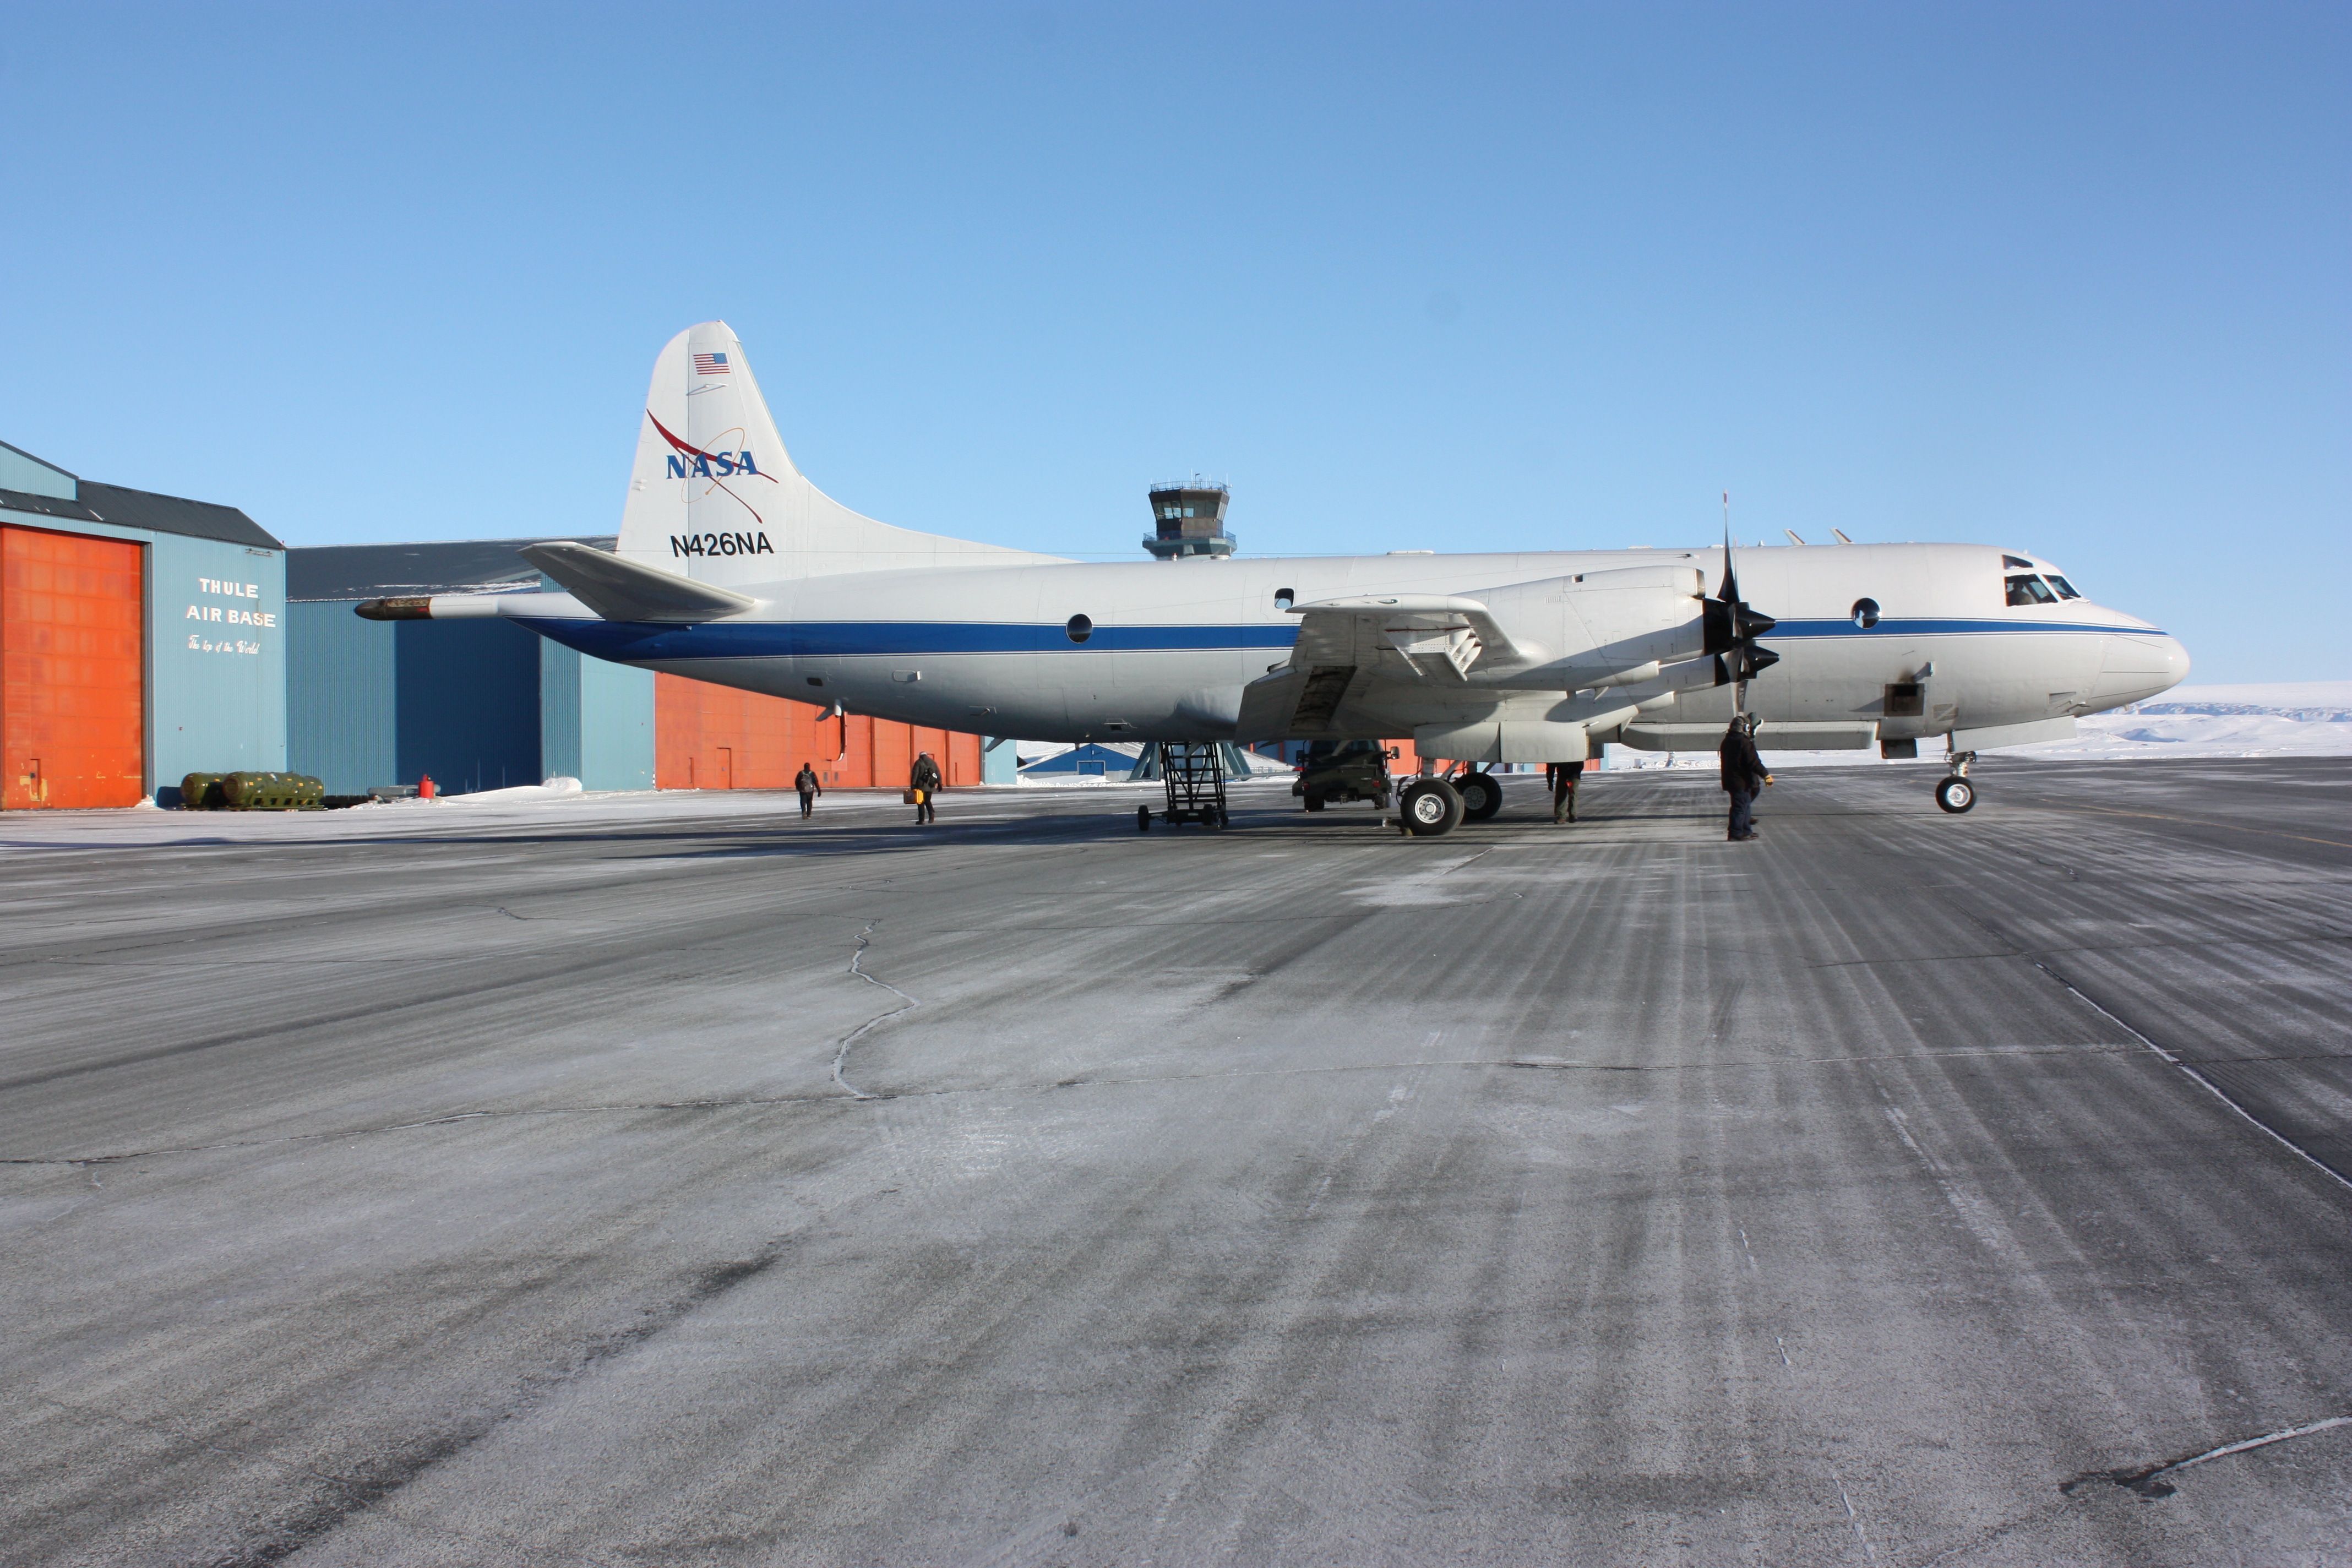
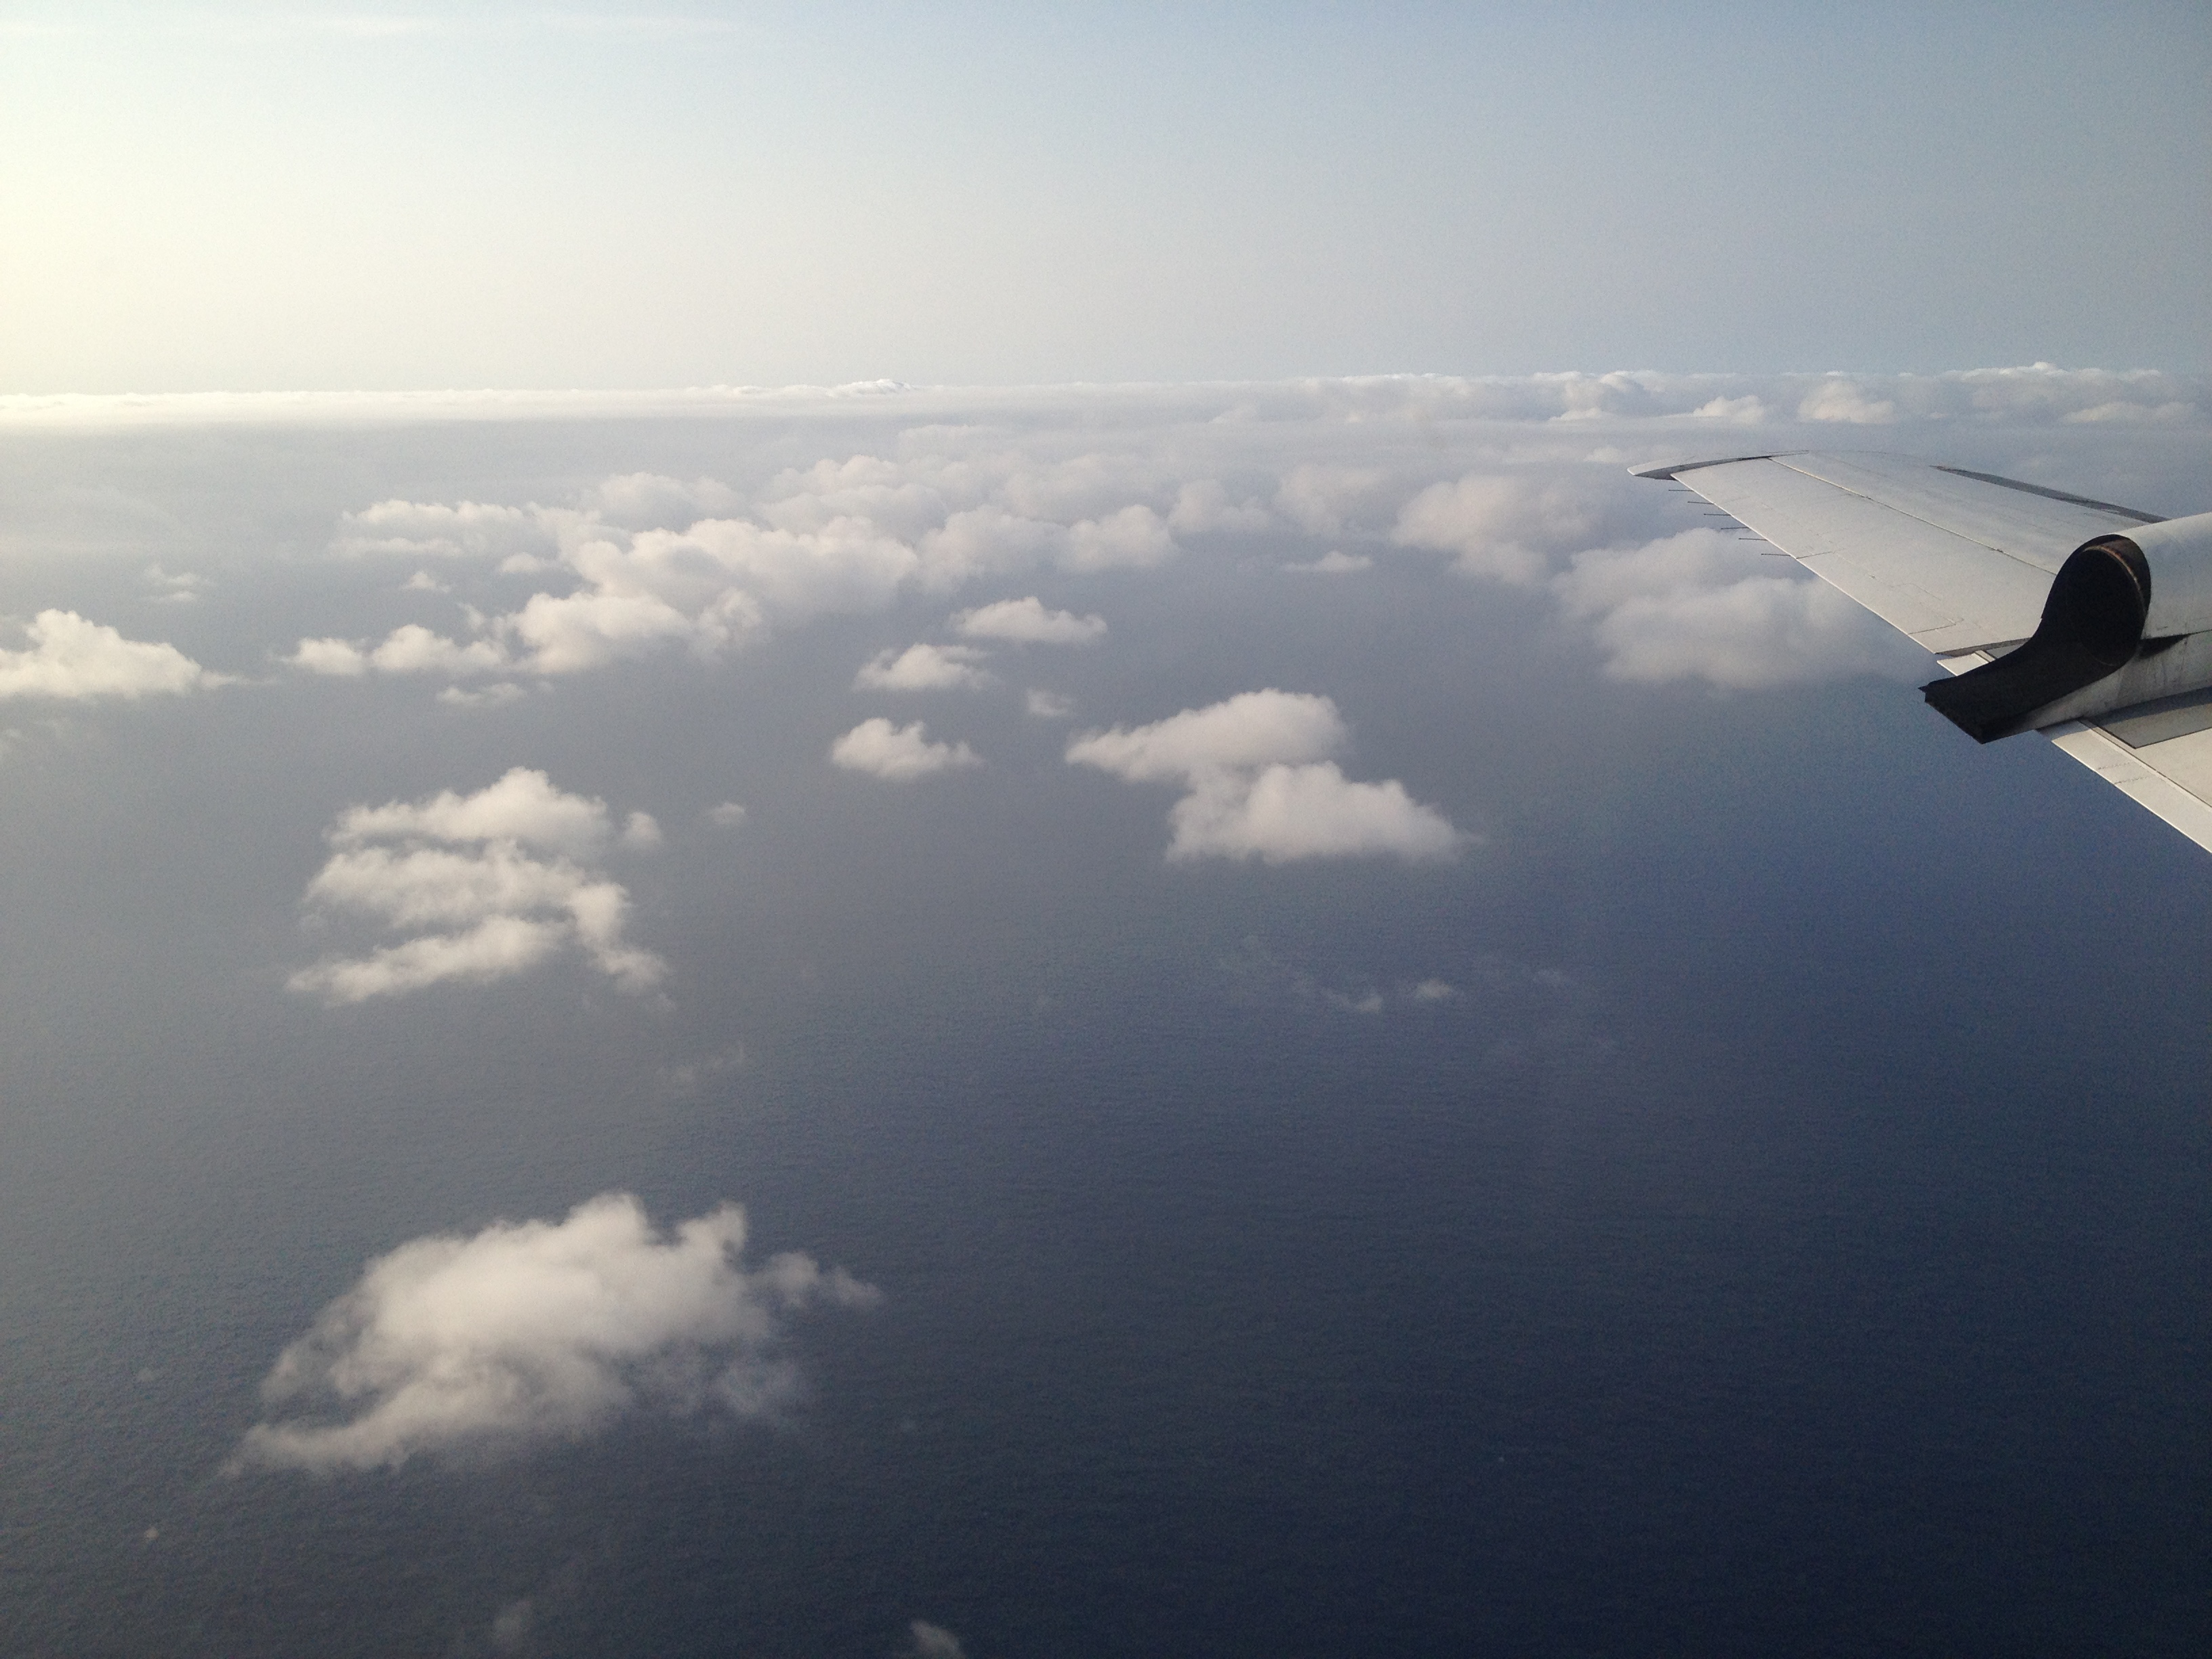
Thus, I was very excited to be able to participate in the ORACLES-2017 deployment in São Tomé, a tiny island in the crook of Africa’s arm, where we flew NASA’s Orion P-3 aircraft to understand how pollution affects clouds in this region. My colleagues Kirk Knobelspiesse and Michael Diamond have already posted a couple of great pieces, which include an overview of ORACLES, the general science questions we are studying, and how we go about doing that in the middle of the Atlantic Ocean.

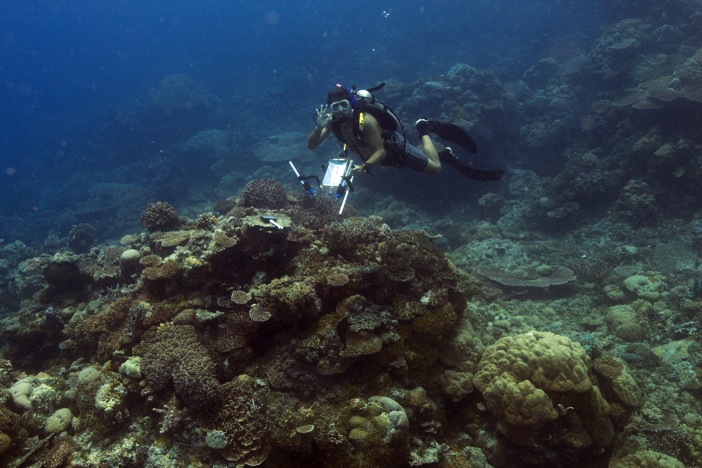
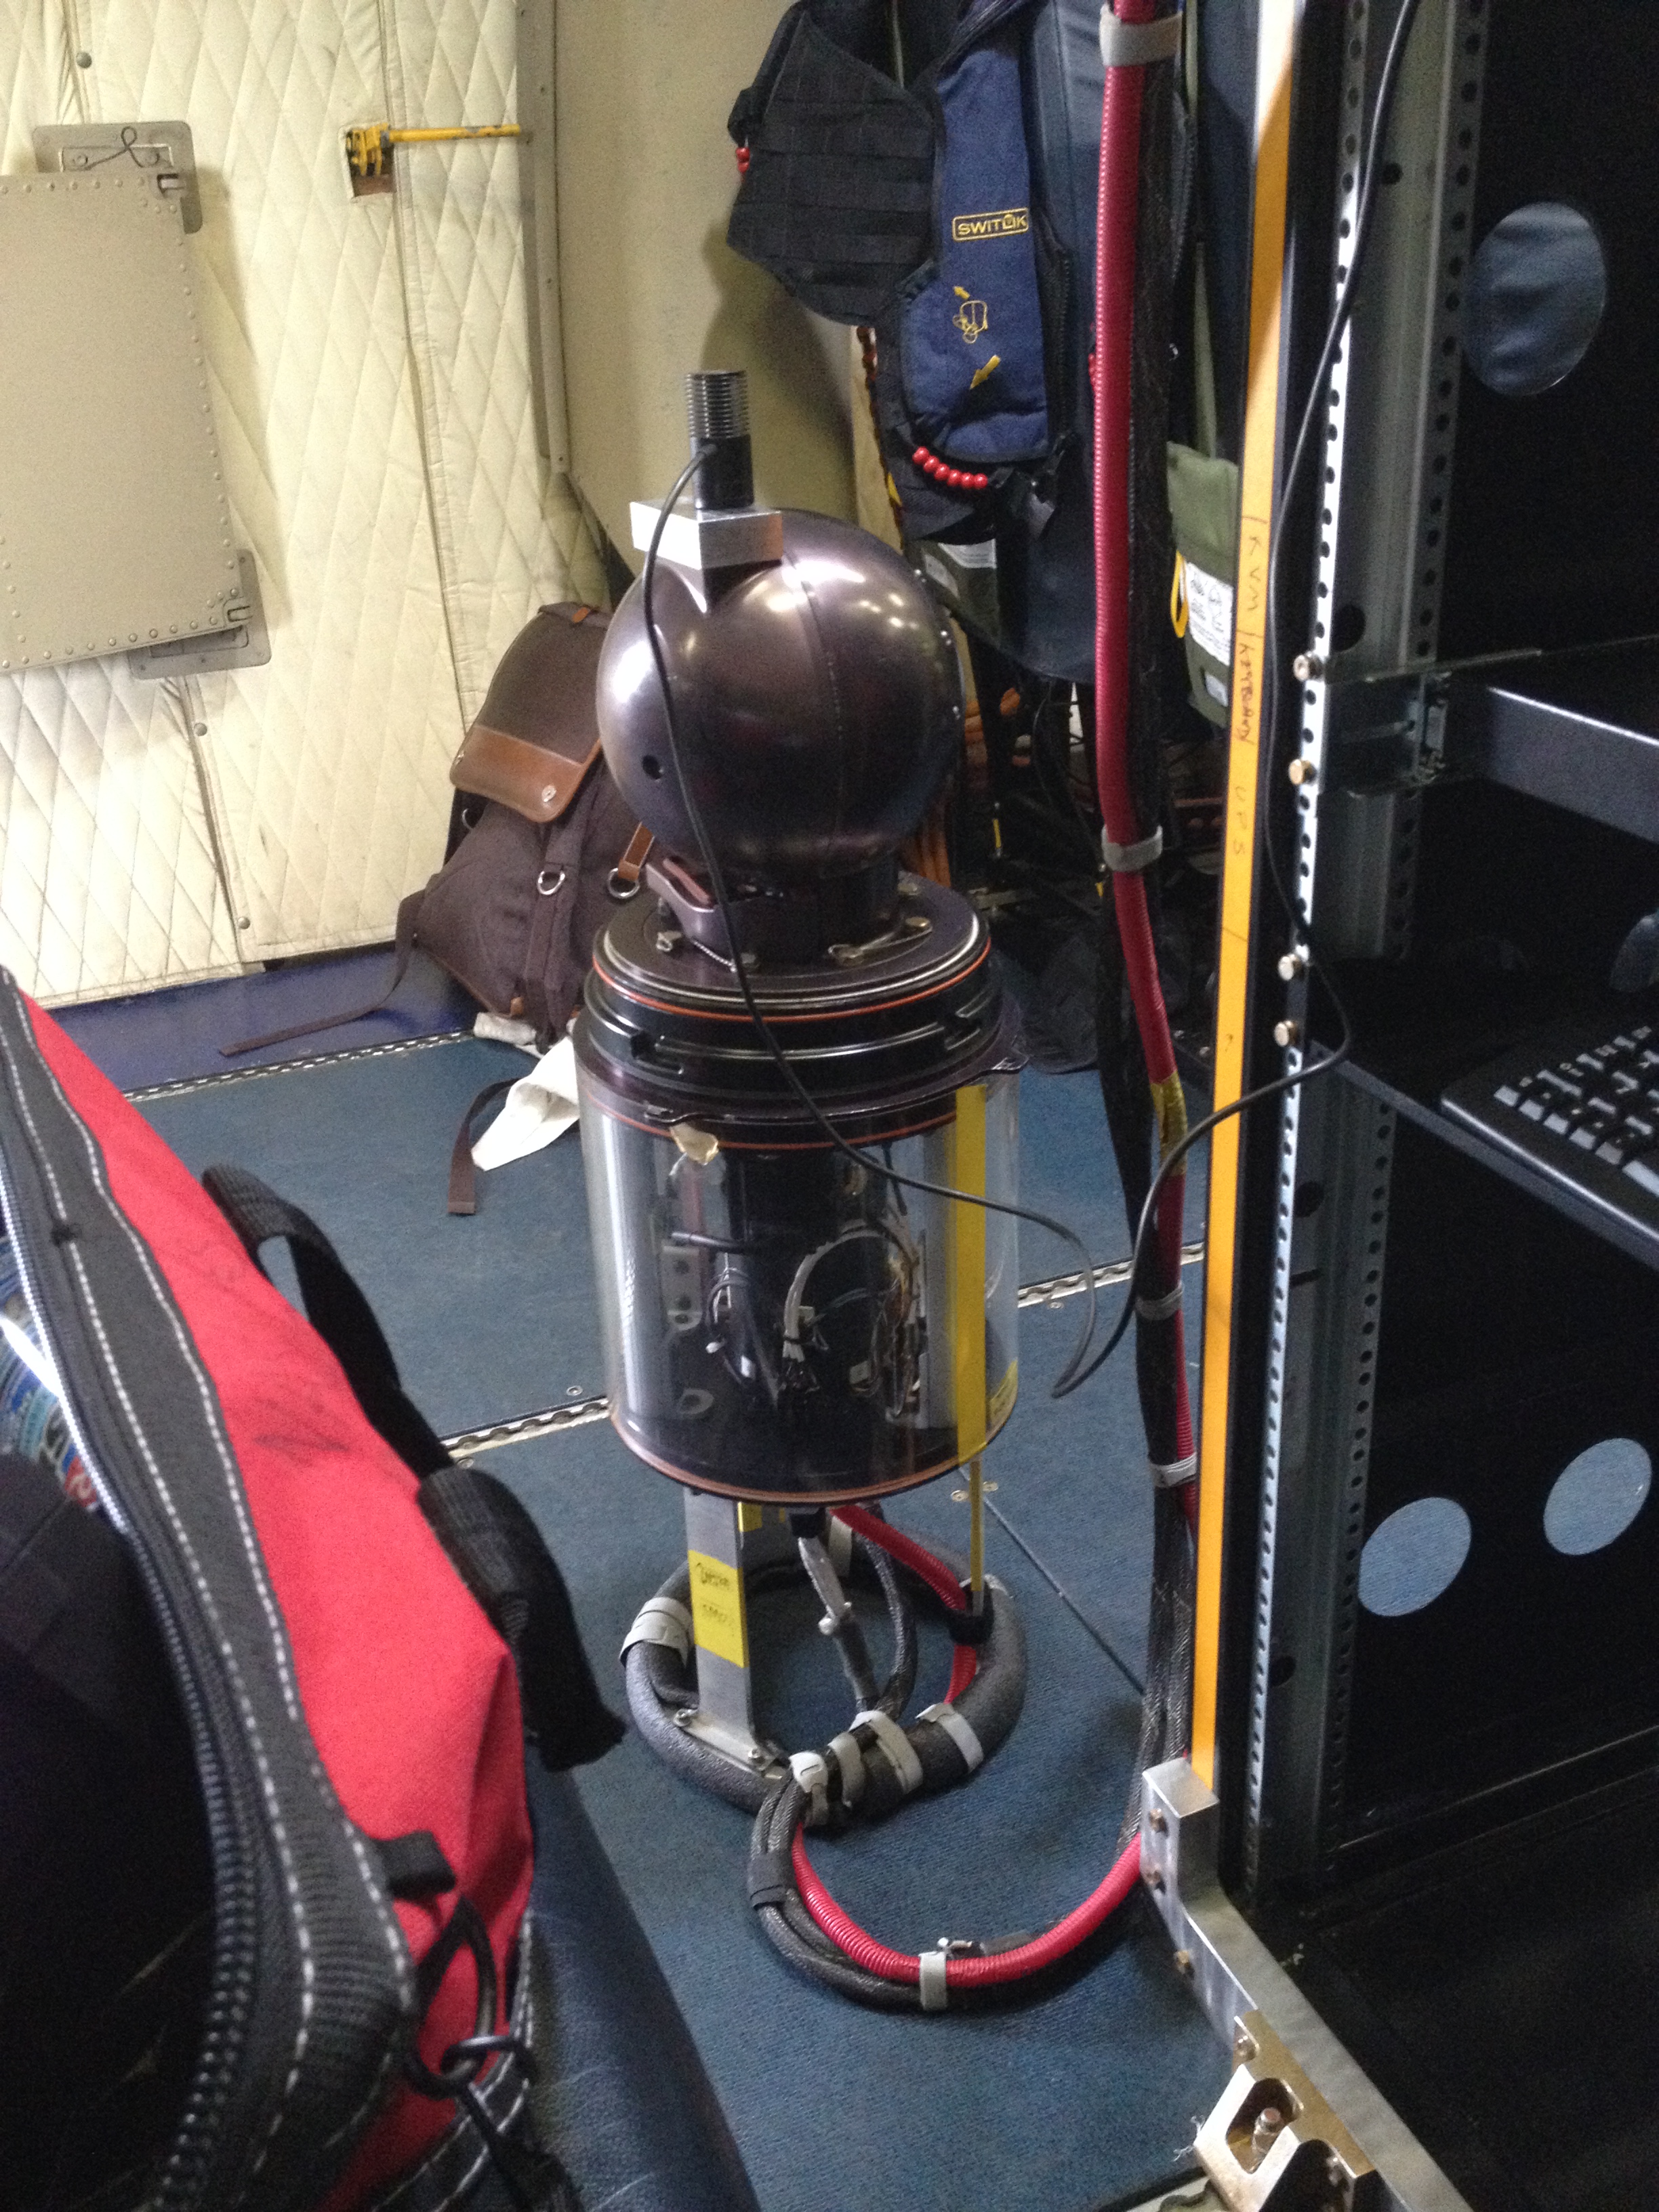
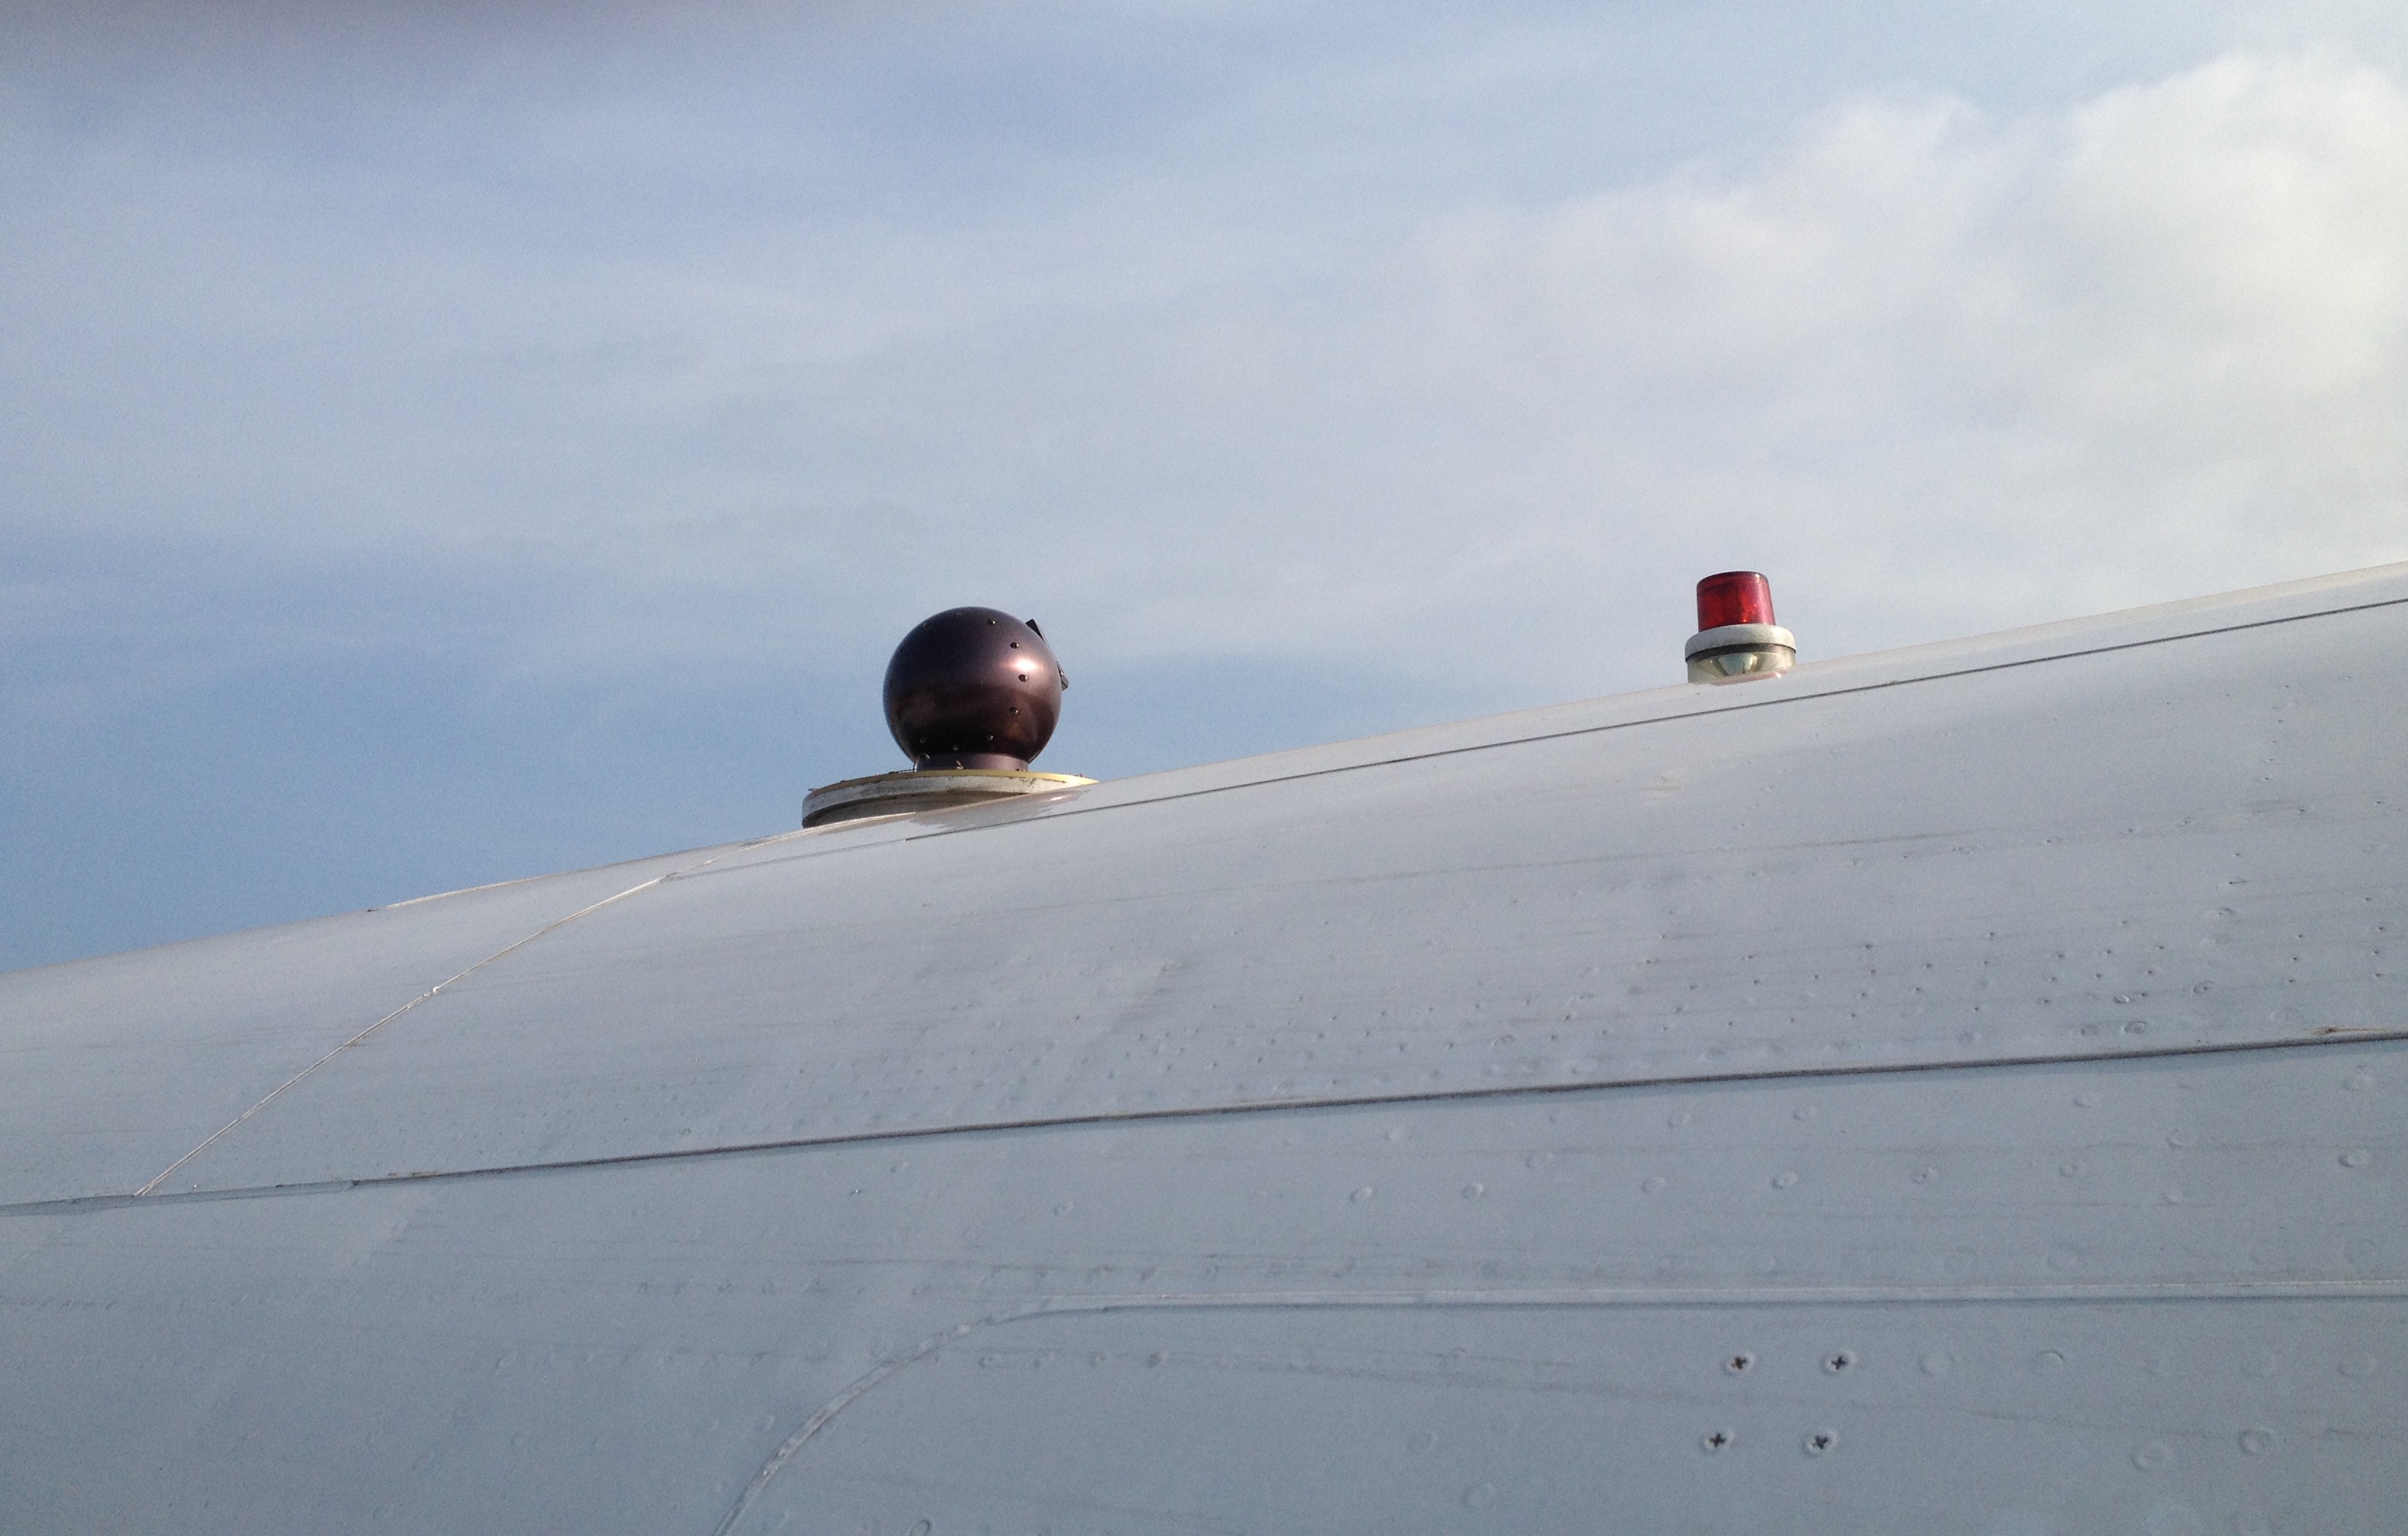
I work primarily with 4STAR, the Spectrometer for Sky-Scanning, Sun-Tracking Atmospheric Research, a pretty cool instrument which we use to learn about pollution in the atmosphere. (See a more detailed post about the instrument here.) For 4STAR, deployment involves not only having an operator on every flight to make sure the instrument is in the right mode at the right time, but also cleaning and calibrating it before and after each flight to make sure everything is going as expected and that we’re able to process and interpret the data when we get home.

The Spectrometer for Sky-Scanning, Sun-Tracking Atmospheric Research, or 4STAR, down inside the plane, with its lamp attached during a post-flight cleaning and calibration. During flight, only the black spherical part is outside of the aircraft. Credit: NASA/Kristina Pistone
4STAR installed in the roof of the plane. Yes, it goes through a hole in the plane, but the hole (or lack thereof) is inspected and secured by the crew before each flight. Credit: NASA/Kristina Pistone
4STAR tracking the sun pre-flight, on a rare sunny morning! (Most days were overcast in São Tomé). 4STAR is able to find the location of the sun and adjust itself in real time to always stare at it, which allows us to get measurements even as the plane does complicated maneuvers. Credit: NASA/Kristina Pistone

Of course, despite months and even years of planning and organization, sometimes field work doesn’t go quite as expected. It’s a huge feat to pull off a massive, international, multi-institutional observing campaign, especially when it’s happening on the other side of the world and in a country where the infrastructure, where it even exists, is less well-maintained than we’re used to in the United States. Even with an excellent logistics team (which we had) things can still go wrong: shipments are delayed, the weather doesn’t cooperate, hardware suddenly fails for no apparent reason and then, right as you’ve fixed it, something different breaks. Part of the job is to make things work in the face of unexpected challenges. ORACLES-2017 was no exception. While we’ll be processing and analyzing the data we collected for months to come, there were some notable ordeals.

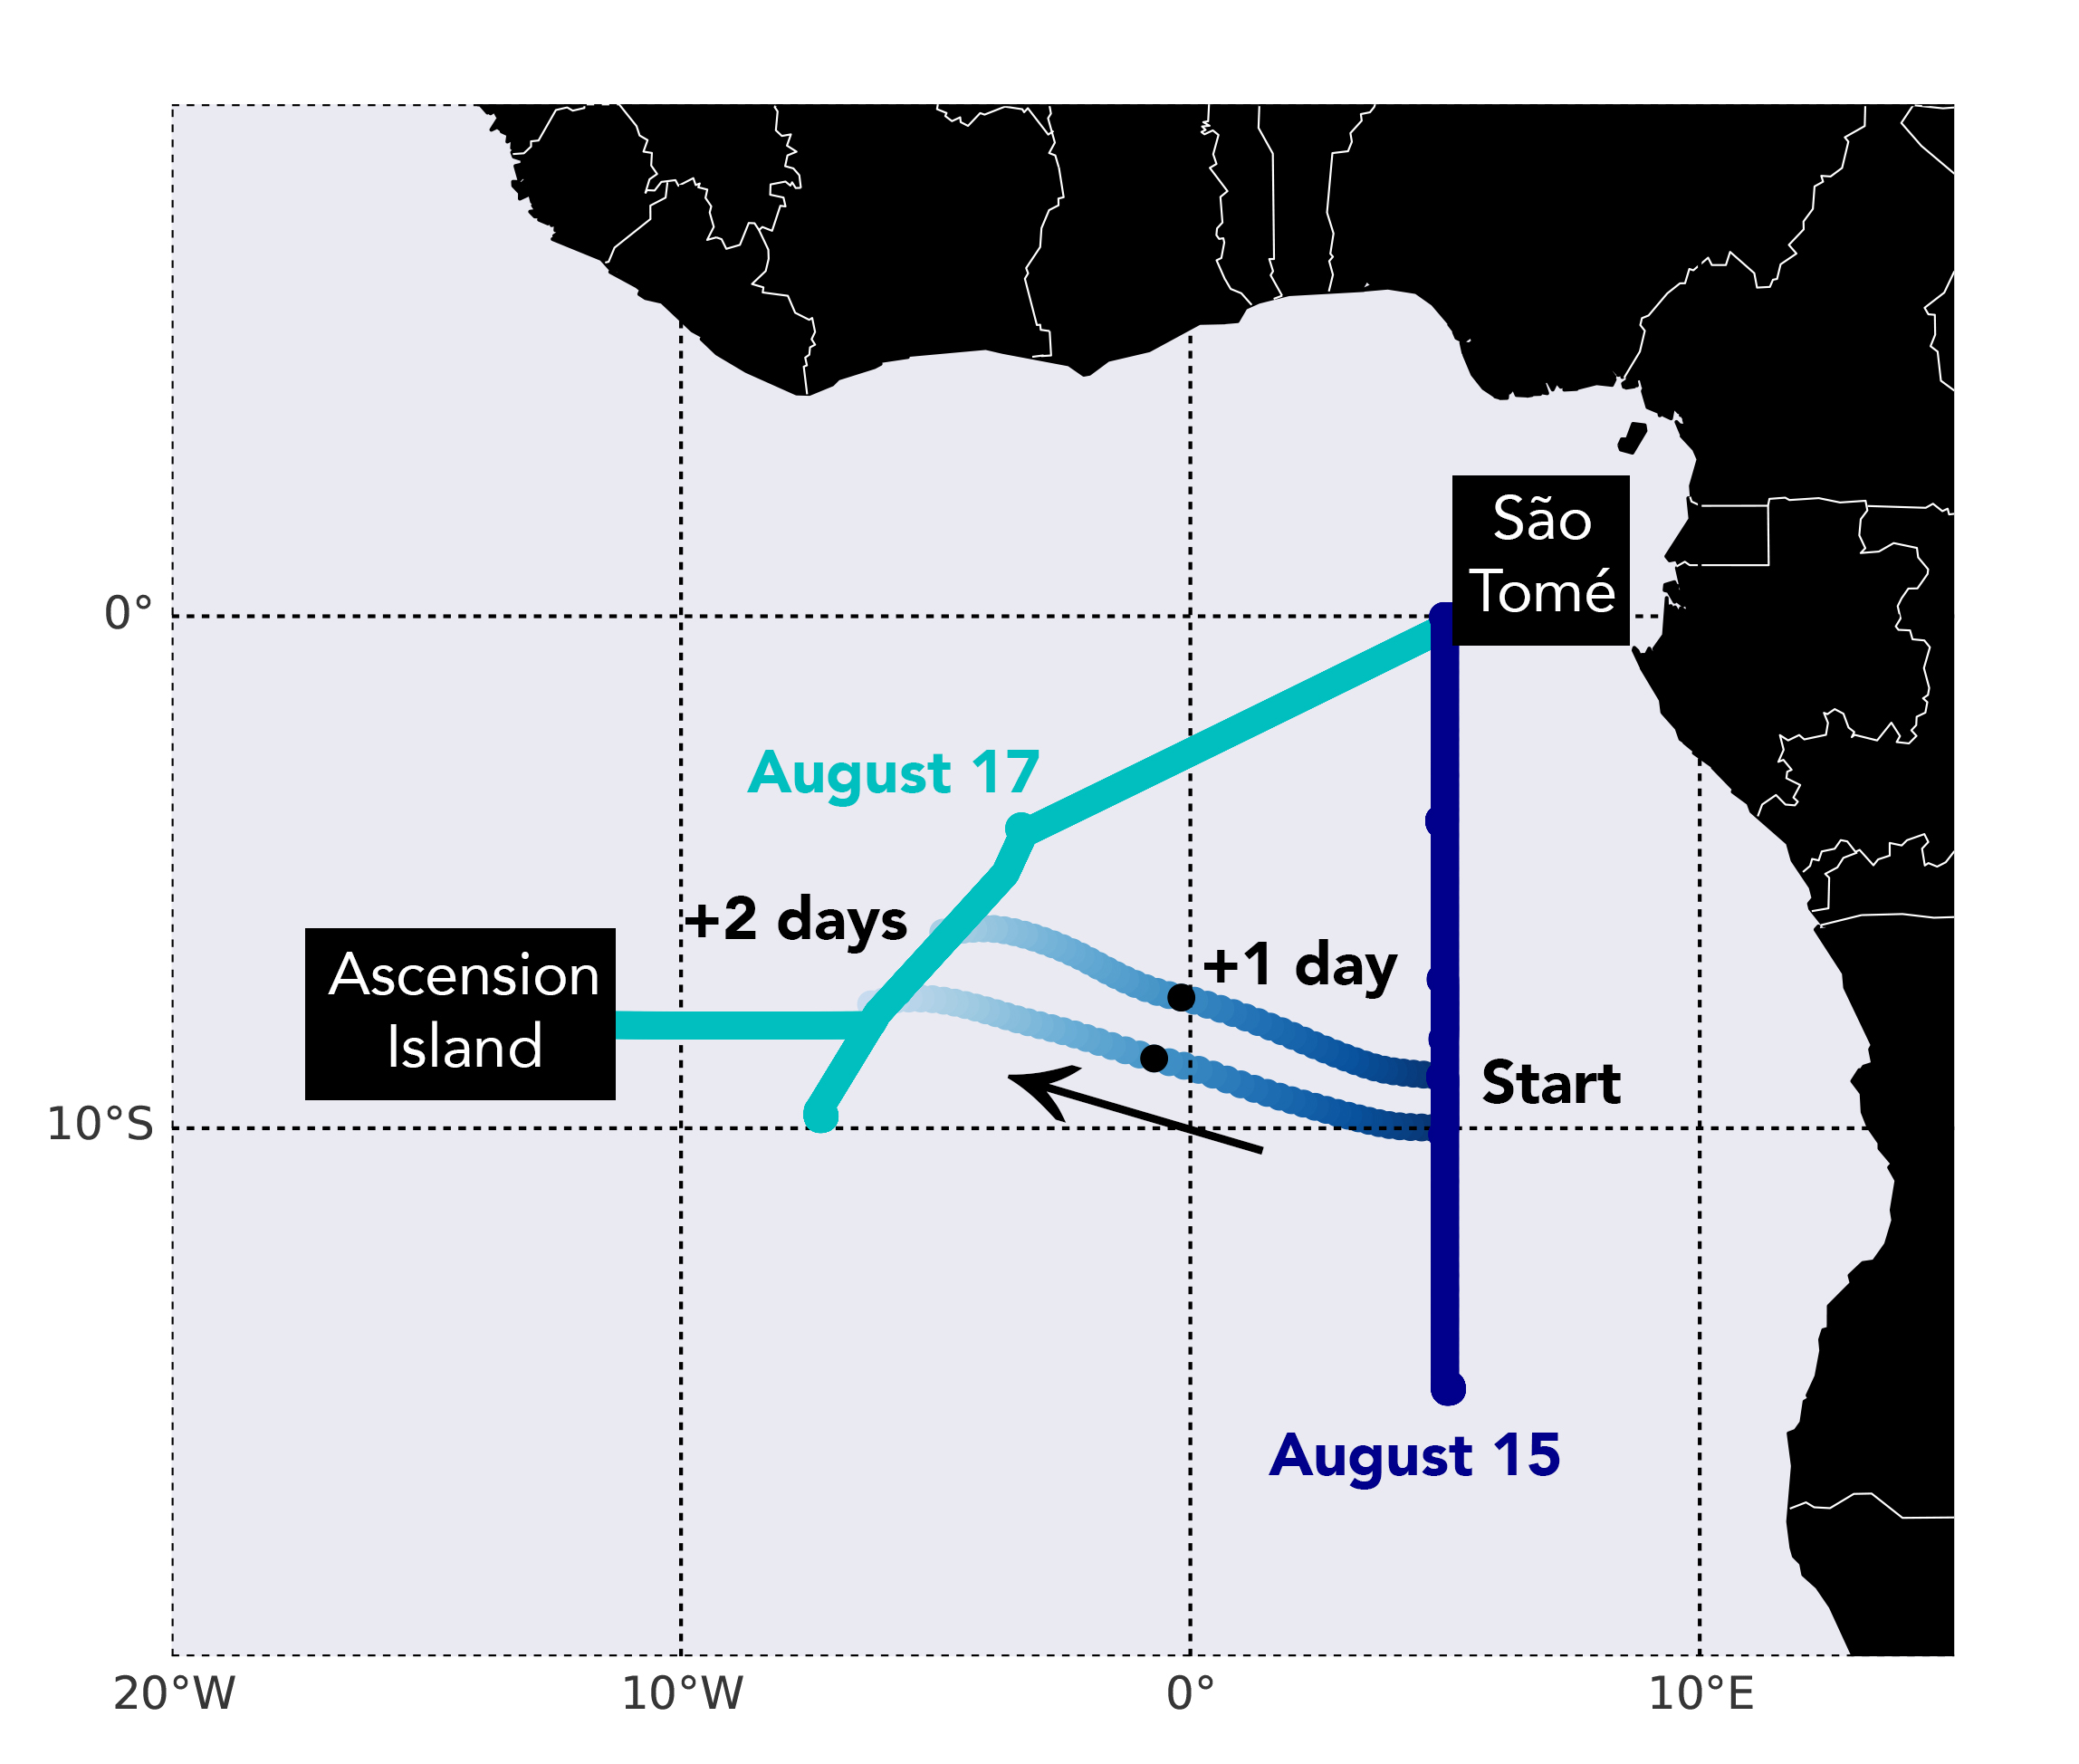
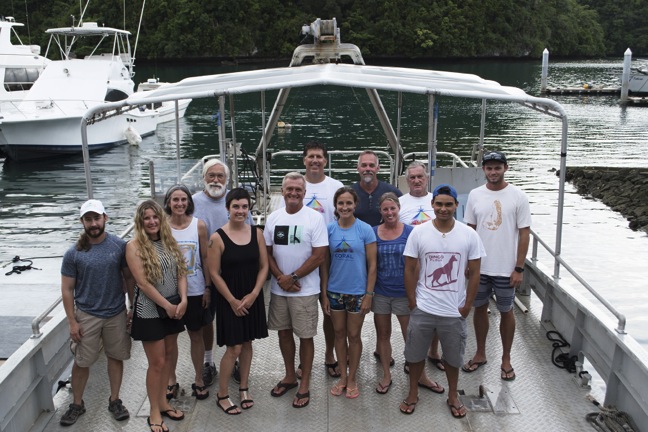
When I arrived in the second half to relieve my colleagues, the team had already had to deal with several mechanical issues that, while minor, meant that in the name of safety we couldn’t fly on the schedule that was initially planned. The team had to develop a new flight schedule on the fly, so to speak, while still taking into account how the atmospheric conditions changed from day to day so that each flight maximized the amount of data toward our science goals.

Daily morning forecast briefing at the airport. This may have been the day when the power went out for about three hours, but our logistics crew was able to use a backup generator to get us back on the internet so we were still able to communicate with the scientists who were out on the day’s science flight. Credit: NASA/Kristina Pistone

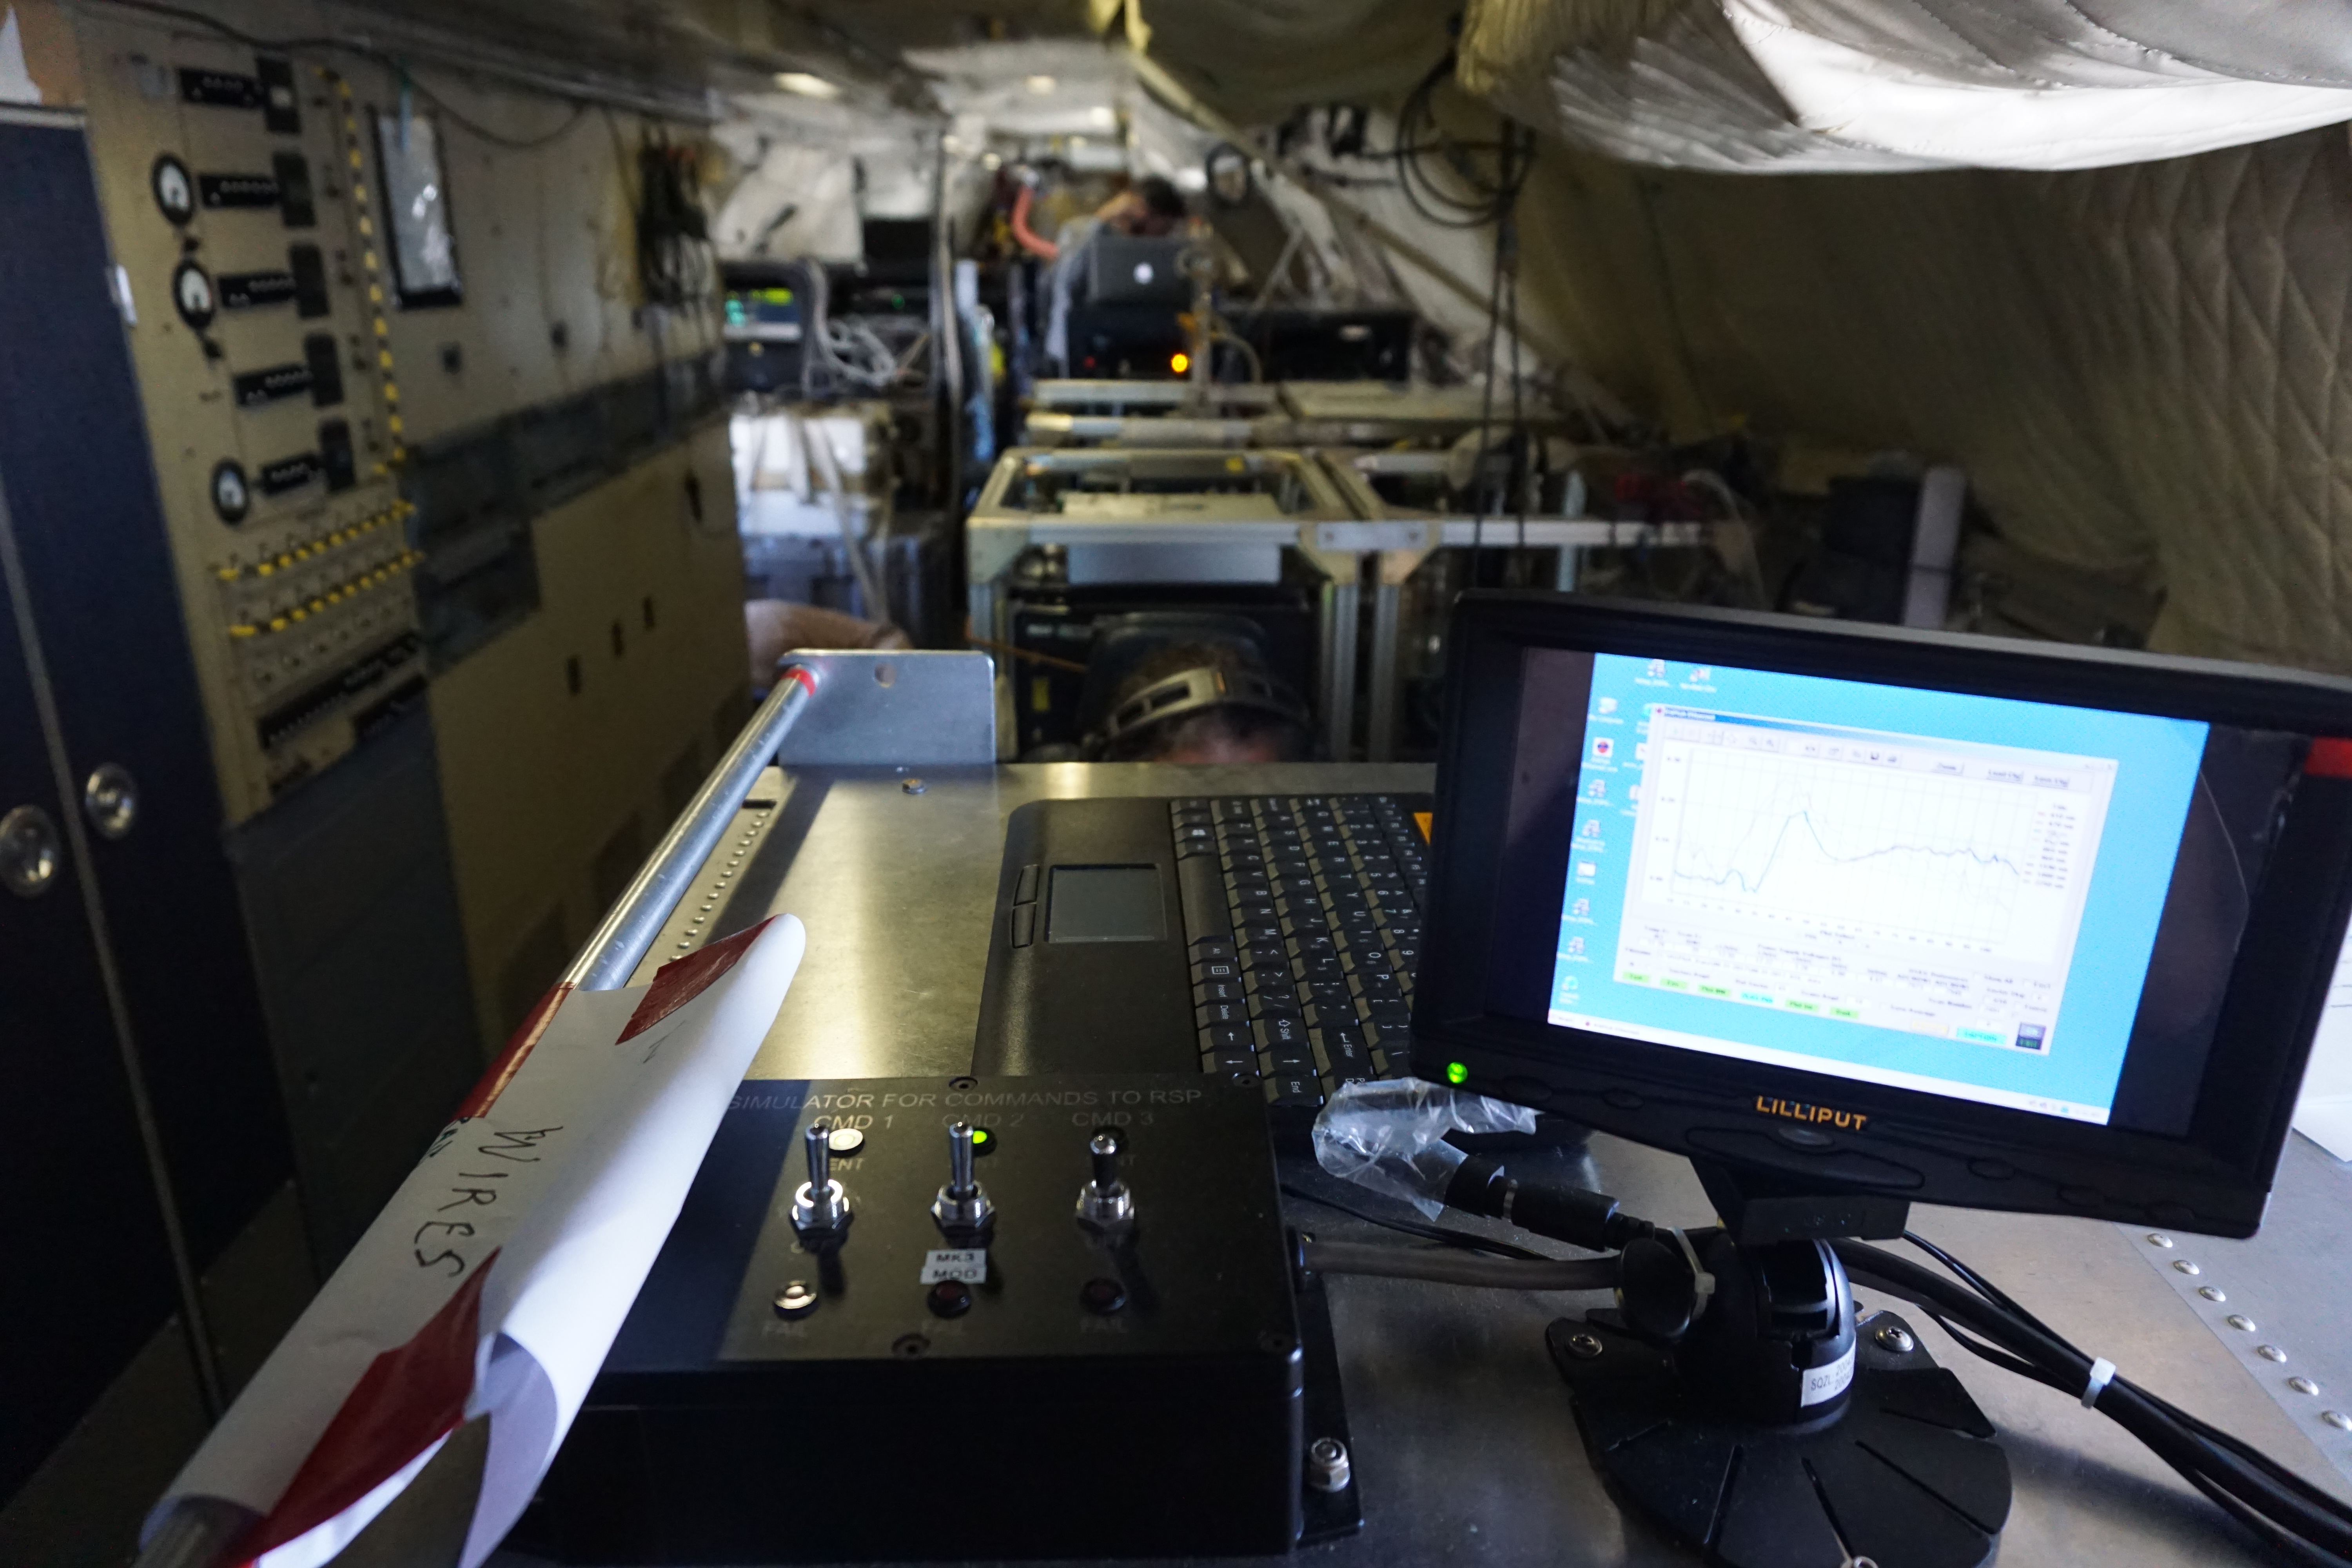
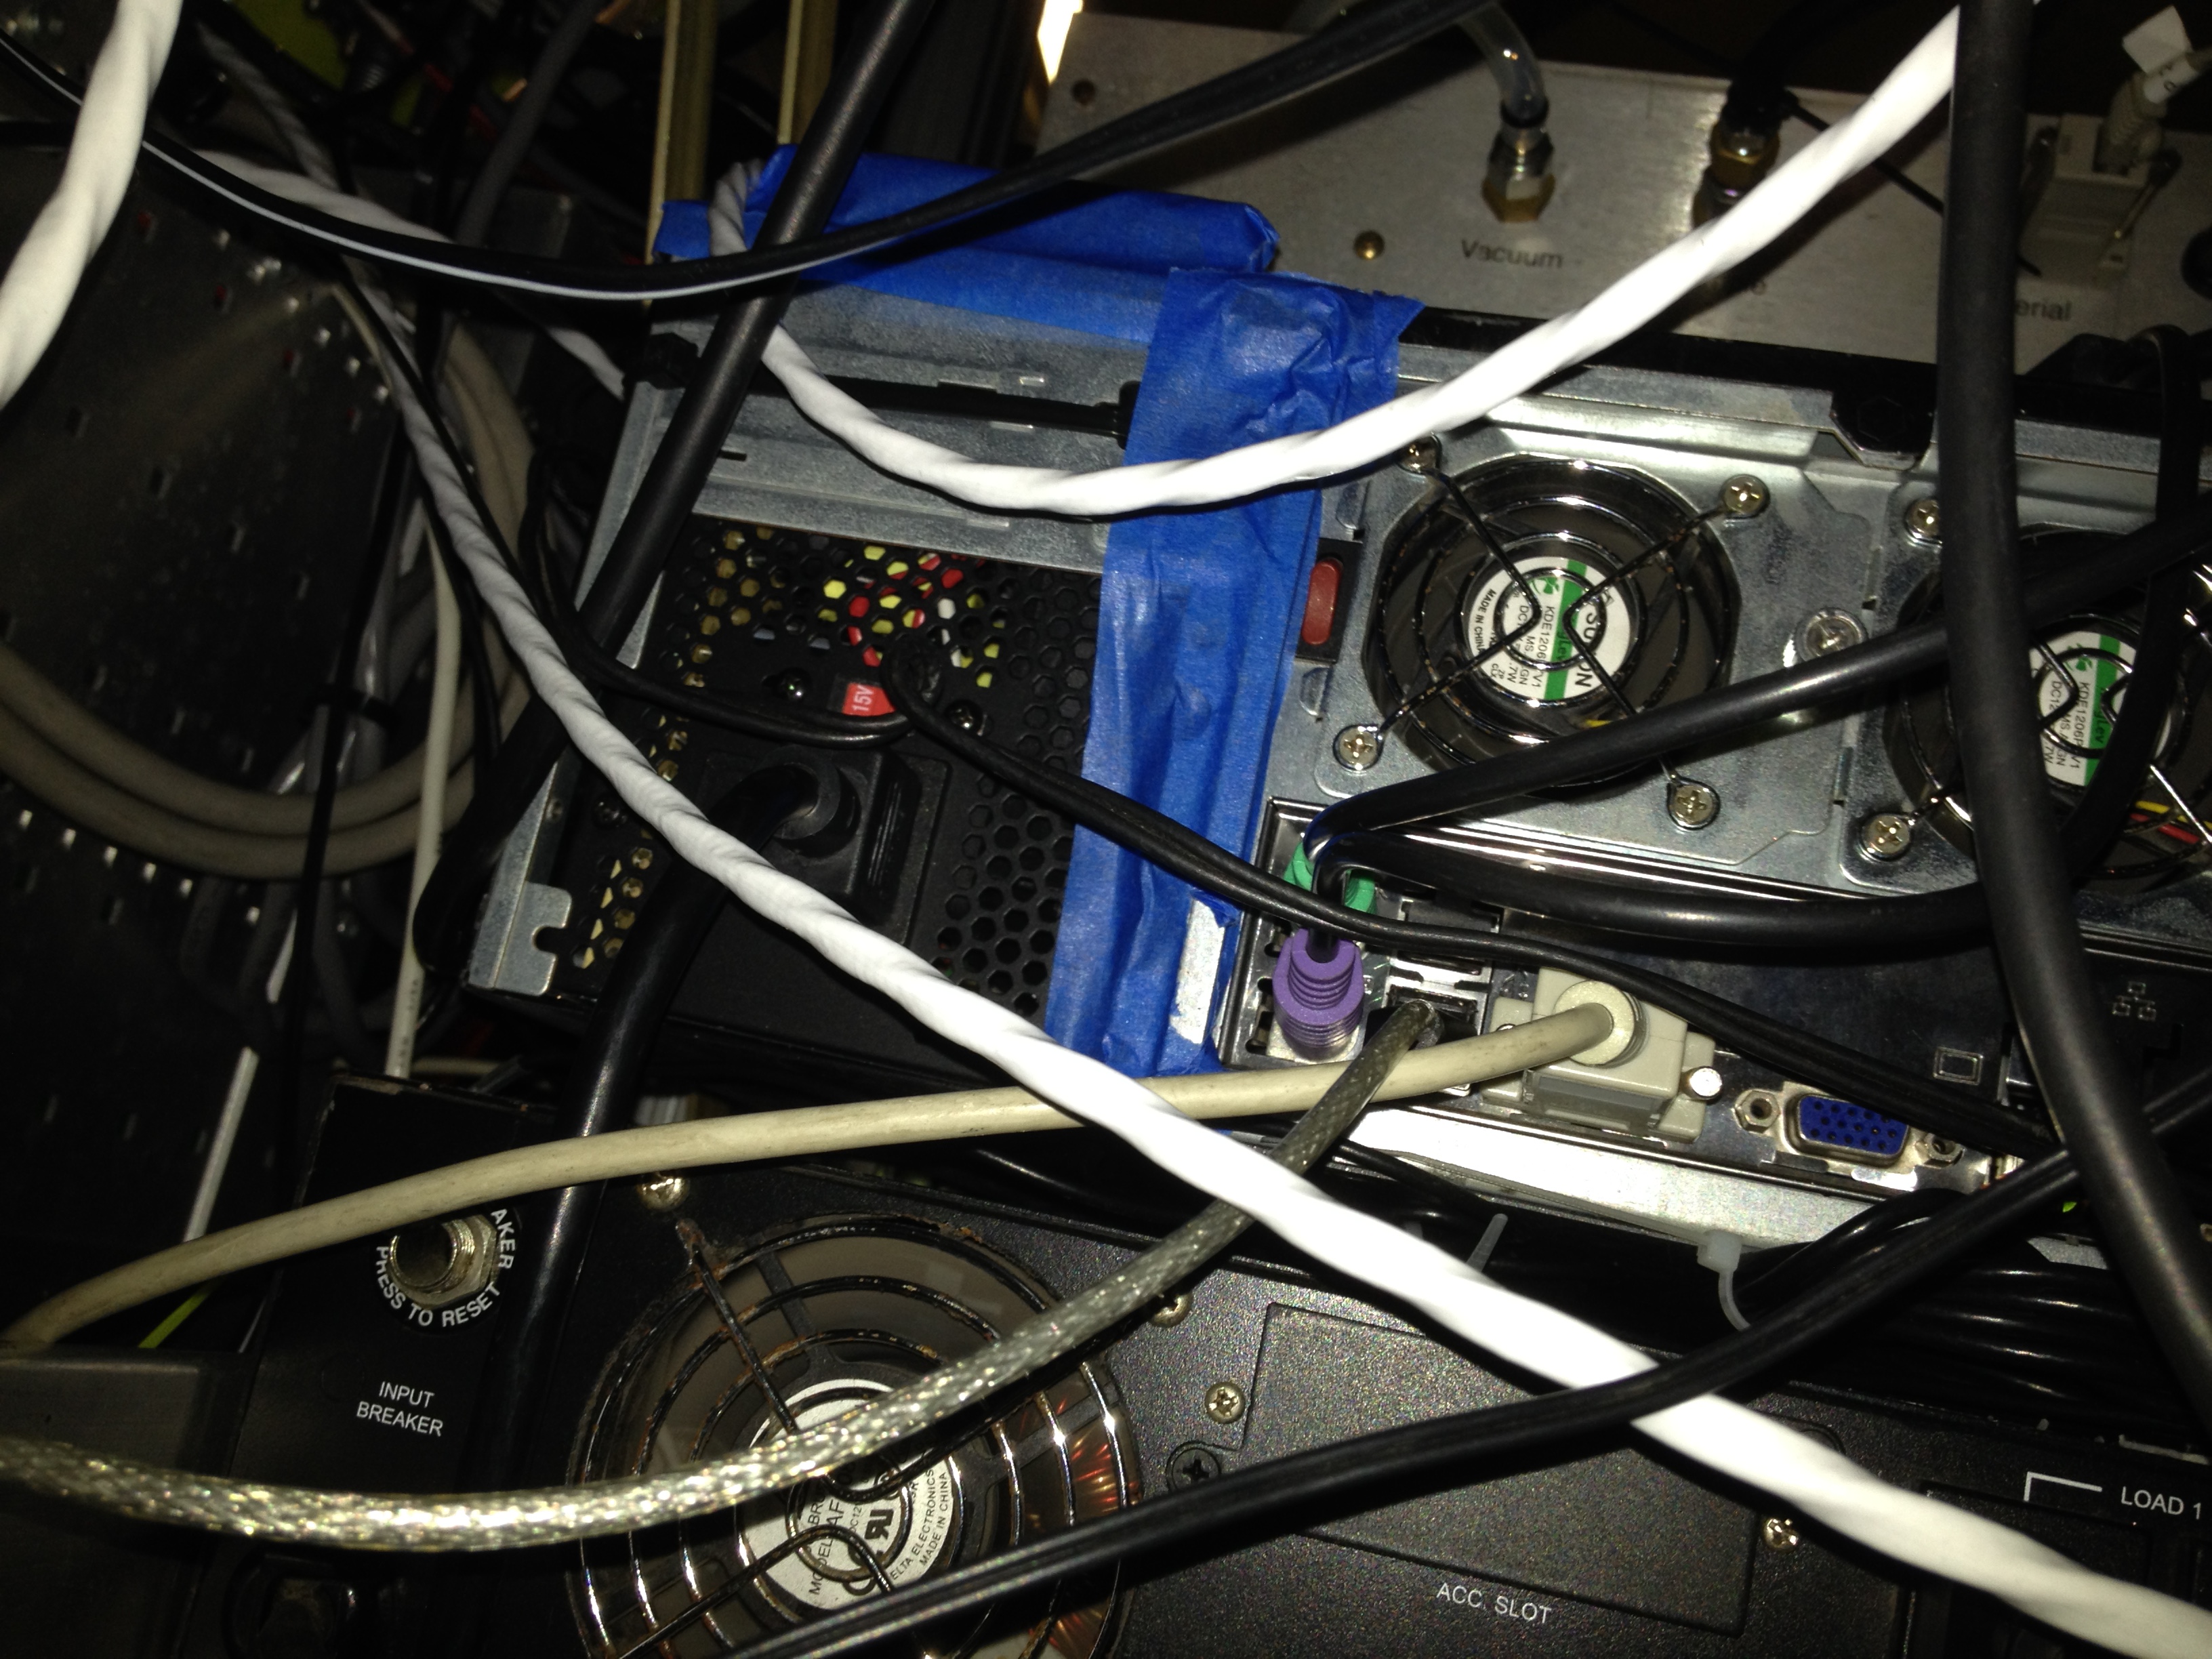
Instruments break. When the aerosol mass spectrometer’s (AMS) instrument power supply died with three flights still remaining, we were able to get the system working again by opening 4STAR’s spare computer and donating its power supply to the other instrument team (known as HiGEAR, since they’re from the University of Hawaii and scientists love acronyms). It ended up being functional if inelegant, due to the slightly different sizes of the two computers.

Not the clearest photo of the AMS, but as you can imagine, the blue tape is not usually present. You can just see how the replacement power supply sticks out the top, too. But it worked! Credit: NASA/Kristina Pistone

On one of our non-flying days we walked to the equator, which ran south of where we were staying (a change from flight days, when we would fly over it on our way to sample clouds). A couple of locals ended up walking along with us and between their limited English and my broken Spanish-inspired Portuguese and a lot of gesturing towards the ORACLES logo on other team members’ t-shirts, I tried to explain what exactly we were doing in their country: why we’re measuring pollution and clouds, why particularly São Tomé is the place we chose to come to measure these conditions, and how understanding the conditions of ORACLES is important to our broader understanding of Earth’s climate.

I’m not sure I got all the way through those points, but I hope it was at least partially intelligible, as part of our job as scientists is to convey to non-scientists why what we do is important. And having conversations with people who otherwise might not be exposed to Earth science is particularly important to me since we all live on the same planet, and as recent events have sadly reminded us, what goes on in Earth’s climate system often has very immediate impacts on people’s lives.

At the equator marker, with one foot in either hemisphere. Credit: NASA

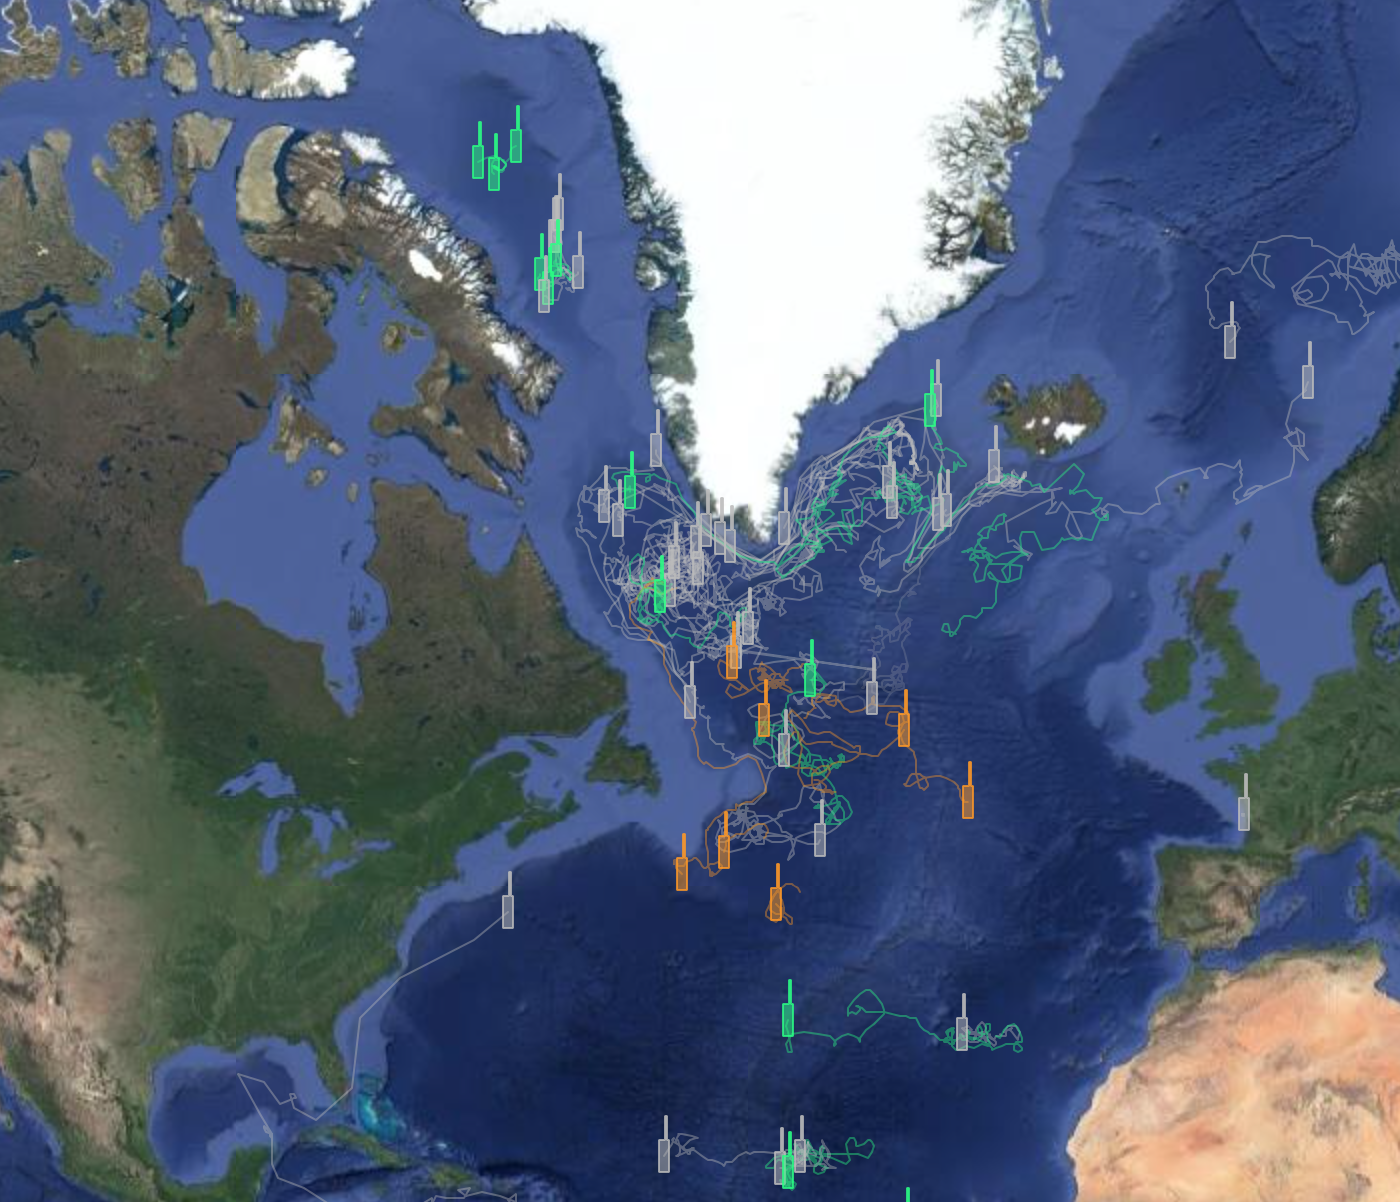
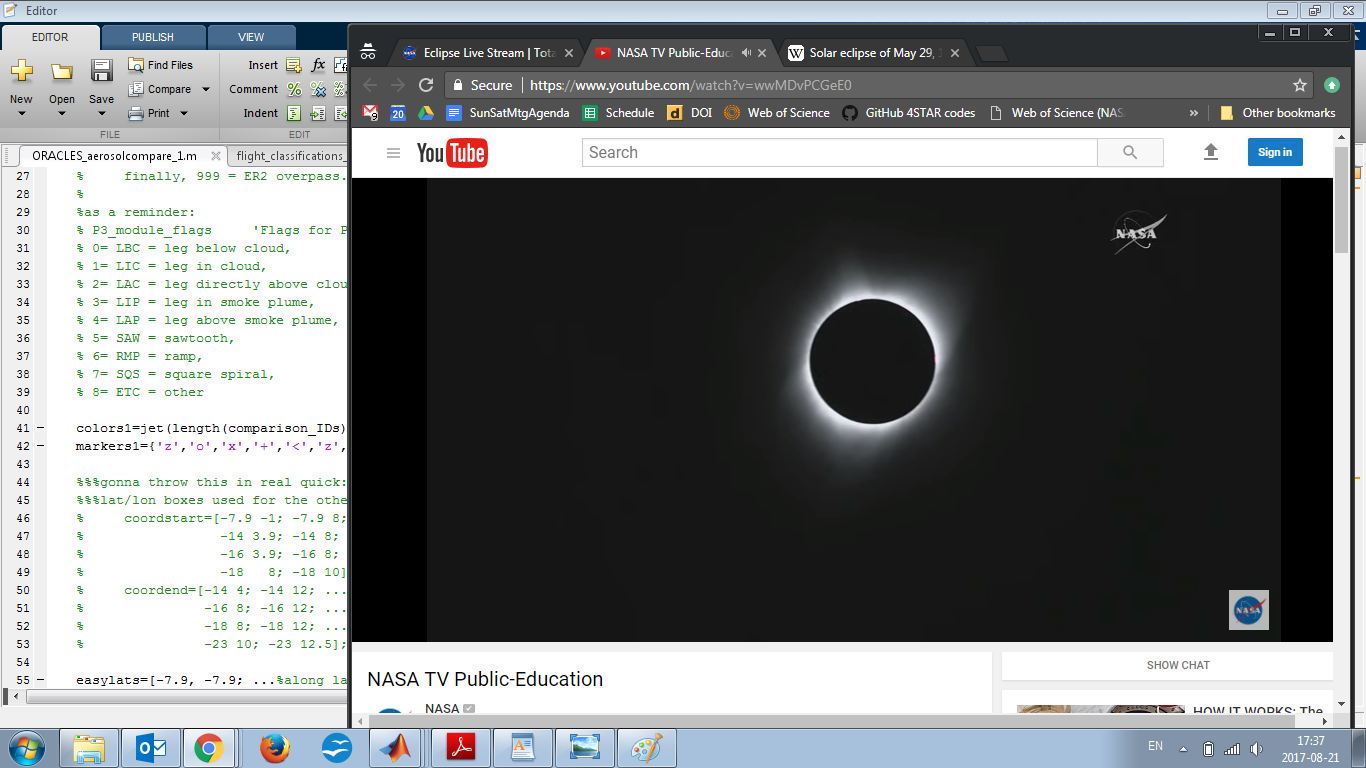
One final note: a lot of us scientists, despite being Earth scientists, were super bummed to miss out on the North American eclipse last month. I think it led to a couple hours of computer screens looking like this:

Credit: NASA

But did you know that São Tomé and Príncipe played a role in another scientific eclipse event? It was one of the locations to which scientists traveled in 1919 to make observations during a different total solar eclipse that would then be used to verify Einstein’s theory of general relativity. It’s amazing to think that a hundred years ago there were scientists who probably had to overcome their own field work challenges very near to the places we were staying. Just another reminder of how global an endeavor this thing we call science is.

Up in Smoke (and Clouds) over the Southeast Atlantic

Smoke from small-scale burning on the northern side of São Tomé island. Although burning was prevalent across São Tomé, the vast majority of the smoke in our study area originated from the south-central African continent, in countries like Angola and the Democratic Republic of the Congo. Credit: Michael Diamond

by Michael Diamond / SÃO TOMÉ & PRÍNCIPE /

In August, dozens of scientists from across the United States descended on the small island nation of São Tomé and Príncipe. Nestled on the equator off the coast of western central Africa, São Tomé was an ideal location to study the phenomenon we had all gathered to observe: a seasonal plume of smoke from agricultural and forest fires that gets lofted by the prevailing winds from the African continent to over the southeast Atlantic Ocean. As part of the NASA field campaign Observations of Aerosols above Clouds and their Interactions, or ORACLES, our aim was to better understand how all that smoke over the ocean affects the amount of sunlight that gets absorbed in the atmosphere and at Earth’s surface.

Aerosols—small airborne particles, like smoke, desert dust, and sulfates from power plants—affect the amount of energy the southeastern Atlantic Ocean gets from the sun, not only by absorbing and reflecting sunlight directly, but also through its effects on clouds. A large expanse of very bright low clouds covers much of the southeastern Atlantic, very similar to the clouds off the coast of California that create San Francisco’s characteristic fog. Smoke can change the properties of these clouds in various ways, including brightening the clouds by creating lots of small droplets, which, interestingly, make the clouds less likely to drizzle and thus stick around for a longer time. Both of those changes allow the clouds to reflect more sunlight, creating a cooling effect.

As anyone who’s been outside on an overcast day knows, clouds play a major role in regulating the amount of the sun’s energy that gets to Earth’s surface, so any changes in the clouds over the southeast Atlantic and those like them across the globe can have big implications for Earth’s energy balance. It is well-known that the heat-trapping effect of man-made greenhouse gas emissions have led to a net warming over the 20th and early 21st centuries. However, unresolved scientific questions about the potential cooling effects of aerosol-cloud interactions over the past century represent a large fraction of the uncertainty in estimates of how much humans have affected the present-day climate.

Snapshot of the smoke-cloud system over the southeast Atlantic Ocean, taken from the window of the P-3 during the August 24th routine flight. A thick plume of milky-gray smoke overlies a blue ocean surface dotted with puffy white low clouds. Credit: Michael Diamond

For ORACLES, NASA’s P-3 Orion aircraft was our primary transport for measuring the smoke-cloud system. On the P-3 we have a set of instruments that can be broadly separated into two categories: in-situ and remote sensing.

In-situ instruments, like those in the picture collage below, measure things in place through air inlets. For example, we have particle counters that can measure the number and size of smoke particles in a plume, and cloud probes that can measure how much liquid water is in a cloud.

In contrast, remote sensing instruments sense things remotely; that is, they tell us about the properties of clouds and smoke from far away, like how we use a telescope to observe stars. In our case, we use instruments like a radar to look at precipitation and a lidar (a laser that provides information about a what’s between the plane and the ground) to look at the smoke plume’s structure.

Top-left: Mary Kacarab and Amie Dobracki operate in-situ instruments studying the chemical properties and cloud-forming ability of aerosol particles. Top-right: One of the P-3 propellers visible outside an aircraft window. Bottom-right: Cody Winchester and Nikolai Smirnow operate a suite of in-situ instruments to study a variety of smoke properties. Bottom-left: The P-3 post-landing in São Tomé after the August 24 flight. Credit: Michael Diamond

Of course, the in-situ instruments that measure clouds aren’t much use when flying through smoke above the clouds, and when we fly high to get good lidar profiles, we can’t get in-situ smoke measurements. In addition, some of the remote sensing instruments don’t work well when high clouds are present, and the smoke and low clouds aren’t always in the same place from one day to the next. How do we balance all these competing objectives to produce a flight that collects high-quality, usable data? That’s where the forecasting and flight-planning team comes in.

As a graduate student at the University of Washington in Seattle, my role in ORACLES is to look at model forecasts from computer simulations and satellite imagery and then use flight-planning software to create flight plans that will meet our scientific objectives. On what we call routine flights, that mostly means picking altitudes and aircraft maneuvers rather than locations, because for these flights we always stick to the same north-south track to build up statistics that can be used to compare our observations with various computer models.

One example of the choices that have to be made here is whether to do stacked legs, in which we fly over the same location at different heights, or sequential legs, which let us cover more ground because we don’t need to backtrack and instead gives us observations at slightly different locations that might be harder to interpret. A similar choice has to be made when we switch between altitudes: we can ramp down and cover a lot of ground, or do a square spiral and get a vertical profile over the same location.

Time-lapse video of a square spiral maneuver over a relatively uniform field of low clouds during the August 24th routine flight. About 10 minutes elapse in the span of this video. Video credit: Michael Diamond.

The other type of flight we call a flight of opportunity, in which we have more latitude in choosing our flight location to sample interesting features, or to avoid pitfalls like high clouds, that are identified by the models.

We were also able to combine flight plans so that the flights of opportunity could resample air that we observed a day or two earlier. Ideally, to study how the smoke evolves during the course of its journey over the Atlantic, we would be able to follow it as the winds push it westward and downward over a period of days. Unfortunately, this is not at all practical in an aircraft with nine hours’ worth of fuel. Instead, we can run a weather forecast model to predict where the air we sampled during a routine flight will end up in a few days. Then, like an advanced game of connect-the-dots, we can design our next target of opportunity flight to hit the right location and altitude to resample that air to see how it’s evolved.

Example of a resampling flight plan conducted on the August 15th routine flight (dark blue line) and August 17th flight of opportunity (cyan line). The blue gradient lines represent the motion of air parcels first sampled on the 15th (dark blue) and then resampled 2 days later on the 17th (light blue). Black dots represent the location of the air parcels after 1 day. Credit: NOAA Air Resources Laboratory/Michael Diamond

Our August 17 flight of opportunity was a bit special because, rather than return to São Tomé, the P-3 landed on Ascension Island in the middle of the South Atlantic Ocean so we could do some joint flights with a British team studying similar science questions. On the way to Ascension, we planned our track to intersect the new (forecasted) locations of a few different smoke plume air parcels that we sampled on August 15.

Now that the 2017 ORACLES deployment is over, the task ahead of us will be to analyze the data we collected in flights like the August 15-17 resampling mission to produce new scientific insights into this unique smoke-cloud system. Within a year, all of our data will become public at https://espoarchive.nasa.gov/archive/browse/oracles so that other researchers across the country and around the world will be able to contribute their own research and generate new ideas and solutions. The data from last year’s deployment, which took place in September and was based out of Walvis Bay, Namibia, is already available. However, we’re not done with data collection just yet: We’ll be heading back into the southeast Atlantic next year for one last deployment, this time in October to characterize the end of the southern African fire season.

Over the Cloudbow with ORACLES in the South Atlantic

A view from the window of the P-3. A layer of smoke is visible over patchy clouds. This is somewhere over the Atlantic Ocean, quite possibly near the [0˚, 0˚] point, where the Prime Meridian crosses the Equator. Credit: NASA/Kirk Knobelspiesse

by Kirk D. Knobelspiesse / SÃO TOMÉ & PRÍNCIPE /

We can’t build a scale model of planet Earth to study in a laboratory, but we can on a computer. But how do we know a computer model we’ve built is right—or even how to build it in the first place? For atmospheric scientists like myself, the answer is measurements: from satellites, from instruments on the ground, and from airplanes.

This is how I find myself on the small African island of São Tomé, curled up inside the ‘bomb bay’ of a NASA P-3 aircraft pouring liquid nitrogen into a specialized camera called the Research Scanning Polarimeter (RSP). This is a long way from home: I work at the NASA Goddard Space flight center in Greenbelt, Maryland.

The NASA P-3 aircraft on the ground in São Tomé. The Research Scanning Polarimeter (RSP) is located in the “bomb bay,” in the fuselage just forward of the engines. It has a small amount of space for somebody to crawl in and perform instrument maintenance. Credit: NASA/ Kirk Knobelspiesse

So, why São Tomé? We’re pretty close to a phenomenon that beguiles climate models and is difficult to observe by satellites – so we need to fly there instead. It all starts with ocean currents, which bring cold, deep ocean water to the surface (known as upwelling). There’s a strong current off the southwest coast of Africa called the Benguela current. The upwelled water, in turn, causes a low, semi-permanent cloud deck to form at certain times of the year – much like June Gloom in Southern California, for example. From a climate perspective, these clouds can be cooling because they reflect the sun’s energy back to space. What’s unique about where we are is that there is a tremendous amount of biomass burning nearby in sub-Saharan Africa, from both agricultural fires and natural forest fires. The smoke from these fires gets blown west, out over the clouds.

A map of our study area off the western coast of Africa. The image, from the NASA’s Moderate Resolution Imaging Spectroradiometer, or MODIS, instrument on the Terra satellite, shows the persistent marine stratocumulus cloud deck created by cold water from the Benguela current (the black stripes being unobserved segments between orbits). Smoke is visible as a haze over the African continent. São Tomé, Walvis Bay, Namibia (where we were last year) and Ascension Island (where we have flown for overnight stays) roughly bound our region of interest. Credit: NASA

Atmospheric scientists call suspended particulate matter “aerosols”—and smoke is a type of aerosol. When suspended above clouds, aerosols can do a couple of things that impact climate. Most directly, smoke aerosols make the clouds look darker, meaning that less of the sun’s energy is reflected back to space. But the aerosols can also modify cloud properties by serving as seeds for cloud droplet formation, for example, or modifying the temperature of the atmosphere, changing how clouds form.

We know all of these things happen, and we include them in our climate models. The uncertainty boils down to how often they occur, and to what magnitude. The root of the problem is that we don’t have all the measurements we need. Satellites provide a nice snapshot, and many of our colleagues at NASA and elsewhere develop instruments especially devoted to the measurement of clouds and aerosols. They don’t, however, simultaneously measure all of the things we need to know, such as the optical and chemical properties of smoke and its exact location, or smoke in the act of modifying cloud properties.

This is why field campaigns, which make targeted observations to resolve specific scientific questions, are so important. I’m here as part of the ObseRvations of Aerosols above CLouds and their intEractionS (ORACLES) field campaign. (Yes, we love our tortured acronyms.). Last year, we sent two airplanes stuffed to the gills with instruments to Walvis Bay, Namibia, and we flew northwest to our area of interest. This year, we’re flying south and west from São Tomé. We’ll return again next year.

This year we’re working with one aircraft: the NASA P-3. The P-3 is a four-engine turboprop designed as a maritime surveillance aircraft for the US Navy. It is ideal for our purposes because of its endurance, size and ability to fly at very low altitudes. We have a wide variety of instruments on the P-3. Some are in situ, meaning they sample the air as the P-3 flies through a cloud or the aerosols, and they tell us size, chemical composition, and other information specific to the aircraft location. Others are remote sensing instruments, meaning they observe the scene from a distance (usually above). Examples include a downward looking precipitation radar, or a lidar, similar to a radar but using a pulsed laser beam instead of radio waves.

The RSP instrument station inside the P-3 aircraft. Our job in flight is relatively simple: only three switches, a keyboard, and a tiny display to manage. Credit: NASA/Kirk Knobelspiesse

The Research Scanning Polarimeter (RSP) also falls in the remote sensing category. It is a passive scanner, meaning it makes a measurement of light reflected from a location under the aircraft at many different angles. One thing we’re looking at is the cloud bow, which is similar to a rainbow, but involves refraction of light from cloud—not rain—droplets. Precise measurements of the cloudbow can tell us the size of the cloud droplets at the top of a cloud, which in turn indicates the cloud meteorological state, whether or not the aerosols are interacting with the cloud, and so forth. We can also determine optical properties of aerosols above the cloud, but analysis of the data requires lots of computing power and can’t be performed easily in the field. My primary role in ORACLES is to improve this analysis, and along with my colleague, Michal Segal Rozenhaimer, we’re looking into using a type of artificial intelligence to “train” a computer to analyze our data.

This is largely done at home, so here in the field my job is to be one of the team members that ensures the RSP is working properly. This means operating the instrument in flight, participating in creating flight plans, and, yes, periodically pouring liquid nitrogen inside. (The instrument sensors work best when they’re very cold.) So even if the “bomb bay” is cramped and noisy, and I’m quite literally thousands of miles from home, I feel very fortunate to be here and a part of this field campaign.

Drifters that Float and Floats that Sink

A snapshot of scientific floats in the North Atlantic Ocean. Credit: Biogeochemical Argo.

by Denise Lineberry / WOODS HOLE, MASSACHUSETTS /

Each year the world’s largest phytoplankton bloom in the North Atlantic goes through distinct phases. In Fall, the plankton are declining after the summer climax. And there are many factors, such as sunlight, water depth, available nutrients and carbon, that control it. Understanding those processes enables more accurate forecasting of this bloom, and others, for ocean management and assessing ecosystem change.

With those goals in mind, for the third time NASA’s North Atlantic Aerosols and Marine Ecosystems Study, or NAAMES, has set sail.

On August 29, about 60 people—half NAAMES scientists and half crew—boarded the R/V Atlantis to test and strap down instruments before settling into their home away from home for the next month. On August 30, despite the possibility of stormy seas, they departed from Woods Hole, Massachusetts, for the wide open North Atlantic.

Sunset from the R/V Atlantis. Credit: NASA/Aimee Amin

With it being the third deployment, the ship crew has some clear expectations on what they want to find out, some really cool instruments to get the data, and an undeniable sense of humor and comradery that has grown from doing life and science on a ship.

“James can be a bit cranky sometimes,” said Cleo Davie-Martin, a postdoctoral scholar at Oregon State University’s Department of Microbiology. But James isn’t a person, it’s a mass spectrometer that measures, or essentially sniffs out, volatile compounds from plankton that can move into the air.  

Some of the crew jokingly refers to the ship’s main lab as the ‘meat locker’ due to the low temperatures needed to maintain the integrity of samples collected and stored by several groups who study the microbial food web. Scenes there include bundled up scientists among rows of tables with latched down filtration systems, microscopes, imagers, monitors and countless other scientific tools.

Water filters in the main lab of the R/V Atlantis. Credit: NASA/Aimee Amin

The floats used for NAAMES are definitely not your average float. In fact, they sink. But depending on the type of float used and depth they sink to, they return to the surface within two to six hours with data on the vertical structure of the ocean, salinity, pressure, light, chlorophyll, oxygen and more. These important bits of data are key to understanding phytoplankton growth and decline.

Using an Iridium Antenna, the floats can be powered and tracked.

“It’s basically like AT&T for satellites,” said Nils Haëntjens, an oceanography student from the University of Maine, as he began testing and calibrating the floats prior to departure.

Atlantis researchers test and calibrate floats aboard the R/V Atlantis prior to NAAMES deployment. Credit: NASA/Aimee Amin

The Atlantis has planned stations that serve as research pit stops for the crew. Just before and while at each stop, they toss about three drifters out to sea. The drifters do float, but more importantly, they drift.

“Drifters help us to do research, because while we stay in one spot at a station, they can move about 20 miles within four days,” said Peter Gaube, research scientist from the University of Washington’s Applied Physics Laboratory.

Baskets filled with 60 drifters sit on the deck of the R/V Atlantis, waiting to be named, painted and tossed to sea by NAAMES researchers. Credit: NASA/Aimee Amin

While at sea, the Gulf Stream current carries the drifters through eddies like a skier going through moguls. There are 60 drifters aboard Atlantis and the crew will sign up for slots to toss a drifter. But first, they get to name and decorate them with paint.

The drifters track changes in the physics of the water over time, providing a snapshot of water properties back to the ship. And often times, they continue to provide this data long after the ship has returned to port.

The sensors on the drifters serve as tiny breadcrumbs for NASA’s C-130 as it flies over the North Atlantic to eventually fly over the Atlantis. The drifters report current positions that allow the aircraft to measure the same locations as the ship.

From space, satellites play an integral role in measuring what’s over the plane. From 20,000 to 30,000 feet in the air, the aircraft validates down-looking measurements from space. And the Atlantis and its full suite of measurements provide ground, or ocean, truth to aircraft and space measurements.

Other instruments aboard Atlantis study ocean optics, atmospheric aerosols, cloud condensation, dissolved organic carbon, cell characterization, growth rates, species composition and predation, grazing and mortality of plankton.

The combined ship-airborne measurement strategy used by NAAMES makes a critical contribution to the ocean ecosystem scientific record by capturing the full range of scales of the plankton ecosystem.

Stay tuned, as NASA’s C-130 is in St. John’s, Newfoundland, preparing to follow the drifting breadcrumbs for its first of many science flights during the fall 2017 campaign.

In Arctic Tundra, It’s Getting Easy Being Green

A view of tundra and native spruce trees in the valley. Credit: NASA/Katy Mersmann

by Katy Mersmann / DENALI NATIONAL PARK, ALASKA /

As I walk up the Alpine Trail in Denali National Park, I can see the vegetation changing before my eyes. Deciduous plants, like willows and smaller shrubs, start huge, as tall as my head and shoulders. But as the trail leads up, and as the altitude grows, the vegetation shrinks.

Over the course of the roughly 1,300-foot elevation gain, the plant life gets shorter and shorter until suddenly it’s almost gone—we’ve reached the tundra. By climbing up the side of this hill, we’ve mimicked traveling north into the colder parts of the Arctic, reaching the tundra much faster.

Tundra is like the Arctic’s desert: an expanse of treeless land with little available water. Most water in the tundra is below the ground in a layer of continuously frozen soil known as permafrost. Between the tundra’s low temperatures and the permafrost, it’s not a hospitable location for much plant life.

In some places, the trail bisects the hill, with large deciduous plant life on one side and tundra on the other. Credit: NASA/Katy Mersmann

On the tundra, Peter Griffith, project manager for the Arctic Boreal Vulnerability Experiment (ABoVE), points out the same shrubs we encountered lower down, although here, instead of towering over our heads, they’re only a few inches above the ground.

But that could be changing. It’s one element of the ABoVE team’s research: understanding how native Arctic vegetation responds to a warming climate.

Griffith describes the shrubs as “ready and waiting to march up the mountain.” They’re opportunistic plants, and all it takes is a little warmth and thawed ground for them to dig in and start growing larger, a process known as “shrubification” and one of the causes of the greening trends seen from long-term satellite records.

Shrubs that grow as tall as a person further down the hill carpet parts of the tundra, waiting to take advantage of slightly warmer temperatures and more available water. Credit: NASA/Katy Mersmann

As greenhouse gases change Earth’s climate, the Arctic is warming much faster than the rest of the world. And the changes are staggering. Permafrost is thawing, and the shrubs aren’t the only ones taking advantage. Within the soil, bacteria are growing and beginning to metabolize organic matter that’s been frozen in permafrost for thousands of years.

As they feast, bacteria release carbon dioxide and methane, which are released into the air. Plants like shrubs use carbon dioxide to grow even faster. In some ways, it seems like a race.

Will the bacteria respire more carbon dioxide than the growing plants can absorb? At some sites, that already seems to be the case. How this race plays out across the Arctic is another question the ABoVE team is investigating.

Using measurements of carbon dioxide and methane taken from flux towers sitting directly on the tundra, to instruments mounted on airplanes and satellites in low Earth orbit, NASA scientists are finding out how the land ecosystem influences the atmosphere in a greening Arctic, and what the consequences are for not only the Arctic but also the world.

Taking in Some Arctic Air

As the DC-8 spirals closer to Inuvik, Canada, a view emerges of the huge Mackenzie River and the standing water that flanks it. Credit: NASA/Katy Mersmann

by Katy Mersmann / SKIES OVER ALASKA AND CANADA /

The Arctic Boreal and Vulnerability Experiment (ABoVE) covers 2.5 million square miles of tundra, forests, permafrost and lakes in Alaska and Northwestern Canada. ABoVE scientists are using satellites and aircraft to study this formidable terrain as it changes in a warming climate.

In some ways, NASA’s DC-8 feels like a commercial airplane, with its blue leather seats and tiny bathrooms in the back. But once the plane starts to spiral down over Arctic towns, I remember I’m riding on a flying laboratory studying the amount and distribution of carbon dioxide and methane in the atmosphere.

Over the course of these big, looping spirals, the plane descends from a cruising altitude of about 30,000 feet down to just about 100 feet above the ground. The pilots fly us over the runway, as though we’re about to land, before pulling up at the last minute and returning to the sky, a maneuver known as a “missed approach.”

The DC-8 crew take turns flying out from Fairbanks, Alaska. Credit: NASA/Katy Mersmann

The whole process of spiraling down is a little scary the first few times we do it, but it’s necessary as an accuracy check for our science instruments, and by the third or fourth spiral down, it’s become a somewhat routine experience for me.

From the windows, I get a good look at the varied Arctic landscapes—twisting, braided rivers, carpets of spruce trees, and broad expanses of flat tundra all spread out underneath us. Each of those landscapes offers interesting scientific insights into how carbon emissions are changing as the climate warms.

As the DC-8 flies low over McGrath, Alaska, a tableau appears of spruce trees lining the Kuskokwim River. Spruce trees are native to the Arctic forest regions, but after frequent wildfires, some have been replaced by deciduous plants. Credit: NASA/Katy Mersmann

The plane is carrying five instruments designed to measure the spatial distribution of carbon dioxide from the air. They’re placed along the plane in place of some the seats and are operated by scientists monitoring screens mounted on their sides.

Someday, a descendent of these instruments will fly on the Active Sensing of Carbon dioxide Emissions over Nights, Days and Seasons, or ASCENDS, satellite, and the spiraling helps the researchers verify their measurements by flying right through the columns of air they’re studying from far above.

Jim Abshire is the project lead for the ASCENDS campaign. He sits near the front of the plane, plugged into the communications system and periodically checking with each instrument’s operators, making sure everything is running smoothly and requesting the occasional altitude change from the plane’s navigators.

He describes the spiral down maneuvers as a check on the lidar measurement systems, specifically ensuring that the instruments are sensitive enough to make precise measurements from space.

As Earth’s climate continues to warm, the Arctic warms much faster, and the subsequent changes in the Arctic regions are resulting in some soils releasing more carbon. More carbon in the atmosphere traps heat, causing more warming, which in turn causes the Arctic soils to release even more carbon, a process called the carbon-climate feedback.

Understanding this vicious cycle is one of the primary goals of the Arctic Boreal Vulnerability Experiment (ABoVE), a NASA campaign that includes the ASCENDS flights, as well as many other experiments, all designed to better understand how the rapid environmental change in the Arctic regions of the world impact ecosystems and society.

Summer School: NASA Airborne Science 101

Inside the cramped quarters of the NASA Sherpa with the racks of scientific instruments. Credit: Megan Schill, Megan Schill photography

by Madison Lichak / SKIES OVER CALIFORNIA /

Thirty-two undergraduates from across the country had the experience of a lifetime flying on the NASA C-23 Sherpa and UC-12B King Air laboratories as part of the NASA Student Airborne Research Program (SARP) summer internship.  One student, Madison Lichak, a biology major from Barnard College in New York, shares her flight experiences.

It is stifling hot inside the aircraft, and I fidget nervously in my seat. A towering metal rack of scientific instruments stands before me, blocking my view toward the front of the plane, close enough that my knees are almost pressed against it. Motion sickness bags, tucked inside their cheerful blue paper wrappers, lie littered across an unused shelf. I try to breathe normally. I have taken many flights in my life, but the flight today is going to be unlike anything I have ever experienced.

The plane I am on, NASA’s C-23 Sherpa, is not your normal commercial aircraft. An old army cargo plane outfitted to carry scientific instruments, the Sherpa reminds me of a bumblebee; with its tiny wings, you have to marvel at the fact that it can even stay up in the air. Loveably ugly and swamp green, the Sherpa is our laboratory for the next two and a half hours. As part of the Student Airborne Research Program (SARP), I, along with 31 other students from across the country, have the unique opportunity to work with NASA scientists to examine Earth from the air.

The 2017 NASA Student Airborne Research Program (SARP) participants, faculty, mentors and pilots pose in front of the NASA C-23 Sherpa at NASA Armstrong Flight Research Center in Palmale, California. Credit: Megan Schill, Megan Schill Photography

The previous day, while other students flew in the Sherpa over Los Angeles, I donned a flight suit and flew aboard NASA Langley’s UC-12B with the Geostationary Trace Gas and Aerosol Sensor Optimization (GeoTASO) instrument. It was a thoroughly pleasant, if somewhat cramped, flight at 20,000 feet.  Throughout the flight we monitored the instrument as it made measurements of the atmospheric gases below us.

Madison Lichak, an undergraduate student at Barnard College in New York,  poses by the NASA Langley UC-12B. Credit: Megan Schill, Megan Schill Photography

However, on the Sherpa we will be taking physical samples of the air, so we need to fly right through the air we want to collect. This means we will be flying at an average height of 1,000 feet above the ground. As the last flight of the day, the hot air will have had plenty of time to become uneven, making for a very turbulent ride. The previous day’s final flight had been so bumpy that several students became sick, and I stare at the blue motion sickness bags in front of me with a mixture of trepidation and relief.

Luckily, there isn’t much time for me to be nervous, as the Sherpa is only on the ground for a few minutes between flights. It’s almost 100 degrees Fahrenheit outside on the runway at NASA’s Armstrong Flight Research Center in Palmdale, California, and the longer the non-airconditioned plane sits on the ground, the hotter it gets inside and the greater the chance that the instruments will overheat. The turnover between flights has to be quick, so I scurry toward my seat where I begin to sweat nervously as other students and scientists remove used air collection canisters and tubes, affectionately known as “snakes” (due to the way the metal tubing snakes through them), and load new ones onto the plane.

Students Mario Autore and Sean Leister load air canisters onto the NASA Sherpa aircraft in between flights. Credit: Megan Schill, Megan Schill photography

Once the transition is complete, the pilots start the engines, and because the Sherpa isn’t insulated, the noise is deafening. I quickly put my noise-cancelling headset on, just in time to hear the pilots ask if we’re ready for takeoff. I only have time for one more forlorn look at the blue motion sickness bags before we’re up in the air and I begin to relax. The air isn’t as hot and stagnant up here, and the turbulence isn’t that bad. The whole air sampling group gets up to begin taking air samples, and next to me the air quality monitoring research group turns on their instrument to begin collecting data.

Student Natasha Dacic takes an air sample in-flight aboard the NASA Sherpa. Credit: Megan Schill, Megan Schill Photography

I sit back and watch as we fly over the massive redwoods of Sequoia National Park, a wildfire that billows smoke thousands of feet into the air, and oil fields so expansive they seem never-ending. As we spin in endless loops around the landscape, I marvel at all of the ways that scientific research seems to defy boundaries.

Before I know it we are touching down at Armstrong. As the Sherpa makes its way toward the hangar, I revel in the fact that we just did science on an airplane, and I am so grateful to the scientists, pilots and staff that made this wonderful opportunity possible. We gather up our things and shut down the instruments, opening the Sherpa’s rear door to the jubilant cries of our fellow scientists and students waiting on the ground, and see that they are holding up their hands above their heads to create a human tunnel. Running underneath their arms, I smile and yell, too, laughing and sharing in their joy.

Lichak emerges from a human tunnel formed by SARP participants at the NASA Sherpa after the final research flight on June 27, 2017. Credit: Megan Schill, Megan Schill Photography

The Magic of the Marianas and Micronesia

Eric Hochberg gives the “OK” sign after completing a set of benthic reflectance measurements in Palau. Credit: Stacy Peltier

by Ali Hochberg / WESTERN PACIFIC OCEAN /

Many people are familiar with—or have at least heard of—the Mariana Trench. Located in the western Pacific Ocean, this crescent-shaped feature on Earth’s crust is the deepest part of the world’s ocean, reaching a maximum depth of 10,994 meters (36,070 feet) in an area known as “Challenger Deep.”

Fewer people, however, are familiar with the Mariana Islands—a chain of 15 islands that include ten uninhabited volcanic islands to the north and five limestone islands to the south. The Marianas are divided into two political regions: the Commonwealth of the Northern Mariana Islands (a Commonwealth of the United States comprising Saipan, Tinian, and Rota) and Guam (a US territory). Fringing the coasts of each of these islands are lush coral reefs that support indigenous fishing and a large tourism economy, including many ecotourism opportunities.

For six weeks in April and May, the coral reefs of the Mariana Islands also supported a cadre of scientists deploying instruments and collecting data as part of NASA’s COral Reef Airborne Laboratory (CORAL) mission. Using a state-of-the-art sensor—the Portable Remote Imaging Spectrometer (or PRISM)—housed in a Gulfstream-IV airplane, CORAL will provide a new perspective on the function and future of coral reef ecosystems.

The CORAL team in Palau (from left): Brandon Russell (UConn), Chiara Pisapia (CSUN), Lori Colin (CRRF), Pat Colin (CRRF), Stacy Peltier (BIOS), Bob Carpenter (CSUN), Eric Hochberg (BIOS), Andrea Millan, Alex Hunter (BIOS), Yvonne Sawall (BIOS), Steve Dollar (UH), Rodrigo Garcia (UMass), Sam Ginther (CSUN)

The data collected by PRISM, and validated through extensive in-situ (or in-water) measurements in the field, will form a series of maps that indicate the relative densities of coral, sand, and algae in each study area, as well as rates of primary productivity (the creation of new organic material) and calcification (the process by which reefs produce calcium carbonate, an important determinant of reef health). With these maps, the CORAL team can build models to help scientists, resource managers, and politicians better predict how reefs are impacted by both natural and human processes.

From April 7-18, the CORAL field validation teams surveyed locations in Guam and from May 1-16 they conducted similar validation activities in Palau, an island nation southwest of Guam and the Northern Mariana Islands whose coral reefs have been named one of the “Seven Underwater Wonders of the World” by the Council for Educational Development and Research. (The Great Barrier Reef and the Galapagos Islands are two other famous examples on this list.)

While in Guam, the three in-water validation teams surveyed 65 benthic cover sites (from which high-resolution photo-mosaics will be produced, allowing for detailed analysis of the various types of seafloor, or benthic, habitats), 6 metabolism gradient flux sites (which reveal information about reef productivity), 1 metabolism Lagrangian site (with instruments that measure reef productivity and calcification in a set mass of water, over a specific amount of time, along a set transect across the reef), and 42 water optical property sites (which yield information on how light travels through the water column, from the surface to the seafloor and back).

Having spent a significant amount of time doing underwater surveys in Guam during the mid-2000s, Eric Hochberg, an associate scientist at the Bermuda Institute of Ocean Sciences and the CORAL principal investigator, was pleased to see the reefs looking much the same as they did a decade ago.

“The conditions in Guam were great, with the water ridiculously clear just a few hundred meters offshore,” said Hochberg. “Honestly, the biggest challenge in Guam was the fact that we didn’t have access to a working field lab and had to create a makeshift lab in a conference room at the Hilton!”

Brandon Russell, a postdoctoral fellow at the University of Connecticut and part of the CORAL optics team, echoed Hochberg’s sentiments about the challenges in Guam. “Working in remote locations is incredibly challenging,” Russell said. “It forces you to be flexible in planning and implementation to successfully collect good data but, if you can overcome these challenges, there’s a great opportunity to collect a huge, unique, and varied data set.”

In Palau, the field teams surveyed 74 benthic cover sites, 10 metabolism gradient flux sites, 2 metabolism Lagrangian sites, and 52 water optical property sites. In addition, 23 sites were studied with an underwater spectrometer to collect measurements of benthic reflectance, or the amount of light that is reflected from the seafloor back to the ocean surface. Each benthic community—in this case coral, sand, and algae—has a different spectral “signature” (how much light is reflected as a function of wavelength), which means that measurements of benthic reflectance can be used to identify the composition of the seafloor.

A view of Palau’s stunning and diverse coral reefs, along with some of its local fauna. Credit: Eric Hochberg

The reefs in Palau lived up to their billing, providing a stunning natural backdrop for the CORAL survey work being conducted. Stacy Peltier, a research technician in Hochberg’s lab at BIOS and part of the CORAL benthic team, said the reefs there were a completely new experience for her.

“While in Palau we discovered a gap in our underwater communication,” Peltier said. “We had no way of conveying how awesome something was, so we had to invent a new diver signal: the head explosion. The scenery was so overwhelming you could barely decide what to look at.”

And, unlike in Guam, the CORAL team had access to dedicated facilities and research vessels in Palau courtesy of the Coral Reef Research Foundation and the dynamic husband-and-wife team of Pat and Lori Colin, the foundation’s director and laboratory manager/research biologist, respectively.

“It’s not an exaggeration to say that we wouldn’t have been able to complete this portion of the CORAL mission without the support of Pat and Lori,” Hochberg said. Agreeing, Peltier said, “Pat and Lori were eager to share their knowledge of Palau’s reefs and actively guided us through so many field aspects that could have easily turned into serious problems.”

The airplane carrying the PRISM instrument shuttled between bases of operation on Guam, Yap (part of the Federated States of Micronesia), and Palau, allowing the flight team to take advantage of shifting weather windows in each region. Over the six-week campaign a total of 75 flight lines were collected, representing at least partial coverage of reef areas in Guam, Rota, Tinian, Saipan, Farallon de Medinilla, Anatahan, Guguan, Alamagan, Pagan, Asuncion, Maug, Farallon de Pajaros, and Palau.

With the campaign in the western Pacific complete, and with flight hours remaining, the CORAL investigation ended on a high note by flying PRISM over reef tracts in the Florida Keys. This “bonus reef” is the first CORAL data set from the Atlantic Ocean and will serve as another representative reef area in terms of reef type, physical forcings, human threats, and biodiversity.

“As we ended the campaign with a number of planned flight hours ‘in the bank,’ we were able to quickly formulate a plan to image the coral reefs around Florida,” said William Mateer, CORAL project manager with NASA’s Jet Propulsion Laboratory. “This reef was the initial location for the CORAL operational readiness test.  Weather cooperated and we had two days of great collections (22 lines) to add to the data available for science analysis.”

The field and airborne teams have returned to their respective home institutions and the CORAL project is now moving into the data processing and analysis phase, which will extend into 2018. CORAL datasets and data products are publicly available. For more information, please visit www.coral.bios.edu/data, which will be updated as data become available, and www.coral.jpl.nasa.gov.

Puzzles Within Puzzles

The SnowEx aircraft fly in "lines" above field sites set up on Grand Mesa, Colorado. Here, a satellite image of Grand Mesa in summer shows the topography with the flight lines superimposed on top. Credit: NASA/ Joy Ng
The SnowEx aircraft fly in “lines” above field sites set up on Grand Mesa, Colorado. Here, a satellite image of Grand Mesa in summer shows the topography with the flight lines superimposed on top.
Credit: NASA/ Joy Ng

by Ellen Gray / WESTERN COLORADO /

Eugenia De Marco loves puzzles. Her face lit up and she grinned broadly when asked what it was like to figure out how to get NASA instruments that measure snow on the ground attached and running on a Naval Research Lab P-3 plane.

“These aircraft have deliberate holes where things kind of hang off of or look out of so we can get data. But all the holes are different sizes, or in different locations in the aircraft,” she said as she described fitting aboard five unique instruments that have been designed to fit on several different types of aircraft. “These are all little puzzle pieces that you need to keep in mind when you design something.”

Eugenia De Marco is Snow Ex's lead integration engineer for the P-3 aircraft, responsible for each instrument aboard getting the data they need. Credit: NASA/ Joy Ng
Eugenia De Marco is Snow Ex’s lead integration engineer for the P-3 aircraft, responsible for each instrument aboard getting the data they need. Credit: NASA/ Joy Ng

As a mechanical engineer at NASA’s Goddard Space Flight Center in Greenbelt, Maryland, De Marco is part of a team that designs science instruments for airborne missions that study Earth. Many of these instruments are early versions of what may one day fly on satellites. For the past year, she has been working with a program called SnowEx, a five-year airborne campaign that is trying to figure out one of the most challenging puzzles in Earth observation: how do you measure from the air the amount of water in snow that’s on the ground?

Snow on the ground is easy to observe from space or the air, but not so easy to measure how wet or dense it is, and thus how much water may flow downstream into reservoirs and agricultural fields when it melts in the spring. One instrument is unlikely to be able to give scientists the observations they need, especially on rugged mountain slopes whose steep angels can complicate things. But many instruments, whose observations fit together like puzzle pieces to illuminate the bigger picture, just might.

Five of those instruments were De Marco’s responsibility aboard the Naval Research Lab’s P-3 aircraft this February during SnowEx’s first trip to their testbed, the snow-covered Grand Mesa and Senator Beck Basin outside Colorado Springs, Colorado. As the lead integration engineer for the aircraft, her job during the flights was to coordinate with the pilots and the instrument scientists to make sure that each instrument collects the data it needs.

Engineer Eugneia De Marco consults with instrument scientists Alex Coccia during a SnowEx research flight aboard the Naval Research Laboratories P-3 aircraft. Feb. 16 2017. Credit: NASA/ Joy Ng
Engineer Eugneia De Marco consults with instrument scientists Alex Coccia during a SnowEx research flight aboard the Naval Research Laboratories P-3 aircraft. Feb. 16 2017.
Credit: NASA/ Joy Ng

“The pilots will call down to me and usually, in general, to everyone, ‘We’re this close to our target,’ and then I make sure everybody’s ready to go and then science starts happening. In the meantime, I keep track of every time we hit the line and start and stop [data collection],” she said.

The “line” she mentions refers to the pre-determined path the airplane flies along so that it will fly above ground stations set up by scientists below to measure snow directly. Dozens of researchers from a variety of universities and government agencies were camped out on Grand Mesa and in Senator Beck Basin, going out each day on snowmobiles, skis or snow shoes to dig snow pits or set up other sensors directly on the snow in the mountains.

“They’re doing that to compare what we’re seeing with our instruments,” De Marco said.” Our instruments will say, ‘Hey, we just saw ten feet of snow,’ and the ground will say, ‘Yep that was ten feet of snow.’ It’s a data comparison-type deal.”

Grand Mesa in the Colorado Rockies is NASA and its partners' testbed for figuring out how much water content is in snow. Credit: NASA/ Joy Ng
Grand Mesa in the Colorado Rockies is NASA and its partners’ testbed for figuring out how much water content is in snow. Credit: NASA/ Joy Ng

On a given flight, the P-3 aircraft flies 12 lines that lasts from three to ten minutes each. One instrument that looks at how light scatters after bouncing off snow on the ground actually needs to fly in a circle around a ground station so it can capture all the angles. Sometimes problems with the instruments crop up, usually small glitches that can be fixed on board, and De Marco will rejigger the flight pattern so when the instrument is ready to go again, they can still fly over that instrument’s line.

Weather, however, is the biggest thing that can impact a flight, said De Marco. Clouds get in the way of some instruments’ observations, so the plane may try to fly above or below them depending on the instrument. Choppy air can complicate flying over the lines. When planning flights, De Marco and the science team try to fly in good conditions, but with weather over the mountains difficult to predict, they often go out in less than ideal weather and adjust their flight plan as they go.

“I think the most exciting thing is when we land and we know that we hit those lines and everything was working well and the sky looked great and the weather was great,” De Marco said. “I mean that just feels really good and makes all that hard work totally worth it.”

Flying with Friends: Operation IceBridge’s Collaboration with ESA

An image of ESA’s Twin Otter passing underneath the P-3, captured by Operation IceBridge’s high-resolution camera. Credit: NASA/Dennis Gearhart
An image of the European Space Agency’s (ESA) Twin Otter passing underneath the P-3, captured by Operation IceBridge’s high-resolution camera. Credit: NASA/Dennis Gearhart

by Maria-Jose Viñas / THULE, GREENLAND /

Do you remember that dreaded math problem in high school, the one where two trains left different stations traveling at different speeds toward each other and you had to calculate when and where they would meet? Now try solving a variation of this problem where the two trains are substituted with three very different aircraft—two leaving from the Canadian Arctic, one from northwestern Greenland—plus a satellite flying overhead. This was the logistical puzzle that Operation IceBridge, NASA’s airborne survey of changing polar ice, had to crack on Friday, March 24, during its ninth Arctic campaign.

The original plan had involved four planes: IceBridge’s P-3, the G-III from NASA’s Oceans Melting Greenland (OMG) campaign and two aircraft from the European Space Agency (ESA)—a Twin Otter and a Basler dubbed Polar 5, both carrying laser scanners and radars, among other instruments. The goal was for all of the planes to fly the same path over sea ice, right beneath one of ESA’s CryoSat-2 satellite tracks, while simultaneously collecting measurements so that scientists could later compare the data gathered by the different instruments on the three planes and the spacecraft’s radar altimeter.

Operation IceBridge’s P-3 at Thule Air Base. Credit: NASA/Maria-Jose Viñas

“The primary reason for the whole exercise was to cross-calibrate the CryoSat-2 radar with all of our radars and lasers,” said John Sonntag, IceBridge mission scientist. “This will allow us all to better understand the performance of our instruments and how well we perform our surveys”.

Early in the morning of Thursday, March 24, IceBridge’s P-3 and OMG’s G-III took off from Thule Air Base in northwest Greenland and headed to the Lincoln Sea, north of Canada. They were planning to rendezvous there with the two ESA planes, which were based in Alert Station, a Canadian base in Ellesmere Island, in the Canadian Arctic. Since the Twin Otter and Polar 5 were located closer to the target site, the Europeans would depart Alert four hours after the NASA planes had left Thule. But before they could take off, an unexpected fog bank rolled over Alert, shutting the airport down.

Still, IceBridge and OMG proceeded with their flight, sampling the thick multi-year ice near the Ellesmere coast and the gradient to thinner ice closer to the North Pole with their instruments: OMG’s radar mapper and IceBridge’s suite of instruments, encompassing a scanning laser altimeter that measures ice surface elevation, three types of radar systems to study ice layers and the bedrock underneath the ice sheet, a high-resolution camera to create color maps of polar ice, and infrared cameras to measure surface temperatures of sea and land ice.

The following day, the IceBridge team decided to give it another go but OMG had already exhausted its allotted flight hours and had to stay on the ground. To increase their confidence that their European collaborators would be able to fly that day, the P-3 took off one and a half hours later than it normally would have. This time, it was a success: the three aircraft flew over the CryoSat-2 track line (one a few dozen miles east of the one IceBridge and OMG had flown the day before) within 42 minutes of each other. The satellite overflew the same line just two minutes after IceBridge had completed it.

View from the P-3’s cockpit of the encounter with the Polar 5 and Twin Otter planes. Credit: NASA/Jeremy Harbeck

“Ideally, all three aircraft and the satellite would be over the same point at exactly the same time, but that’s almost impossible to do with three airplanes operating at different speeds and altitudes,” Sonntag said. “Still, we had some flexibility because the sea ice moves slowly—as long as we all flew over it within two hours, we could be sure we were all measuring the same ice.”

It will take scientists from the different teams about six months to process all the measurements before they’re able to compare them, but NASA and ESA are already calling the collaboration a success.

“This collaboration took a lot of careful coordination,” Sonntag said. “It demonstrates the commitment of ESA and NASA to work cooperatively to better understand the cryosphere.”