Operation IceBridge: Glaciers Aren’t Forever

by Emily Fischer

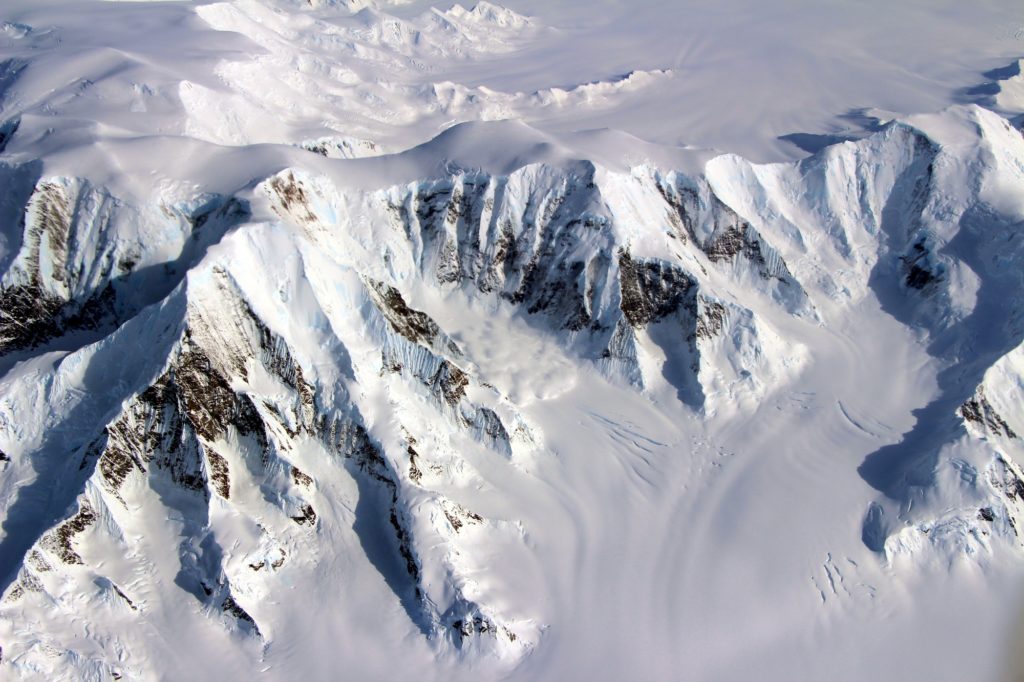
Flying a plane over Alaska’s vast landscape provides a birds-eye view of some incredible sights. Bears run across frigid streams, moose trample through mounds of snow, and golden eagles own the air above ice-capped mountains. Glaciers cut paths through these mountains, leaving lakes and rivers in their wake. These glaciers are especially interesting to scientists who want to learn more about climate change in a region that is changing more than any other.
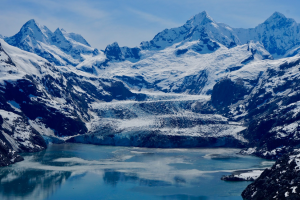
Johns Hopkins Glacier lies beyond Johns Hopkins Fjord. Credits: University of Alaska Fairbanks/Christopher Larsen

According to Christopher Larsen, project manager of Operation IceBridge (OIB) Alaska, these glaciers are losing on the order of 75 billion tons of ice each year, which contribute to global sea level rise. Learning more about these mysterious, ancient ice formations could give scientists a better understanding about the impacts of global climate change in the Arctic.

Thousands of miles above the surface of these glaciers, satellites collect data on how these gargantuan slabs of ice are changing. Ice, Cloud and land Elevation Satellite-2 (ICESat-2) was launched in 2018, 11 years after its predecessor was decommissioned. In the decade in between, OIB bridged the gap, collecting data and exploring Alaskan glaciers with a whole new perspective.

Now, two years after ICESat-2 made its way into low-Earth orbit, OIB is finishing its final campaign. Having wrapped up its flight season last week, the team plans to do a final set of flights in August. And Larsen, a research professor at the University of Alaska Fairbanks, will finish up his last of eleven summers managing OIB Alaska.

A view from the wing of the Cessna TU206G while mapping a potential landslide in the Barry Arm and approaching the Barry Glacier. Credits: University of Alaska Fairbanks/John W. Holt

Instead of satellites, his team collects data using instruments aboard two small, single-engine aircraft. They shoot a laser from the bottom of each plane that hits the glacier’s surface and bounces back up. By calculating the amount of time it takes the laser pulses to return to the instruments, Larsen and his team can then estimate the surface elevation of the glacier at specific coordinates.

He said that most science projects at the university only last three years, but IceBridge Alaska has studied glaciers for over a decade.

“I’ve been involved in almost all of the flight campaigns myself,” Larsen said. “It’s really wonderful to have something that’s dedicated to monitoring and observing glaciers over a longer time period.”

Alaskan glaciers are temperate, meaning the ice is at or near melting point, and they melt and refreeze as they adjust to changes in the climate to maintain a balance between ice accumulation and melting. As the Arctic is warming at twice the global average,  ice loss is accelerating, contributing to global sea level rise.

One problem with studying temperate glaciers is measuring depth. Radar doesn’t permeate water well, so determining ice thickness can be a challenge. To resolve this problem, the team must use a different frequency range, which isn’t always 100% effective. Despite this challenge, Larsen and his team have determined that some of the thickest ice in Alaska is on the order of 4,900 feet (1500 meters) and located in the Bagley Ice Valley. If all of that ice were to melt, the whole valley could turn into a lake or fjord.

But predictions of ice melt are hard to make because of the individual nature of glaciers. Like snowflakes, all are unique and respond differently to changes in the environment. “What we’ve found in general is that there’s a lot of variation from glacier to glacier, and it’s hard to pin that to any [common] characteristic of a glacier,” Larsen summarized.

And these glaciers have lost a lot of ice.

Terminus of the Ellsworth Glacier, showing large ice bergs breaking off from the glacier as it retreats. Credits: University of Alaska Fairbanks/Christopher Larsen

Not only are scientific barriers a challenge – physical limitations affect the flight campaign as well. For instance, the weather plays a huge role in the operation’s success. Larsen and his team check the weather constantly and plan their flights a day or two in advance based on wind and storm patterns. Weather is the true determinant of where and when they can fly. While satellites collect data at set intervals, planes that rely on clear and calm skies don’t always have this luxury.

The greatest challenge, according to Larsen, is collecting measurements of the same glaciers at consistent intervals. “And that’s driven mainly because you’re operating a light aircraft in large mountains with big weather systems,” he explained.

Nevertheless, the IceBridge Alaska campaign has been able to successfully collect data by running a relatively small campaign with a flexible team. Their pilots sometimes have to change survey paths mid-flight due to the weather, and research teams work proactively to prioritize safety and efficiency. Adding a new plane this summer has boosted productivity exponentially.

Besides their successful data collection on Alaskan glaciers, the IceBridge team has combined scientific processes with personal observations, some of which have been peculiar, to say the least.

Case in point: While flying over Yakutat Glacier, on the Gulf of Alaska’s coast, Larsen was surprised to see that the glacier was almost entirely concealed by a dark mass. When the plane flew closer, he realized that the ice was actually covered by many fuzzy moss balls, fondly nicknamed “glacier mice” by researchers. These tumbleweeds of Alaskan glaciers are still a mystery to scientists who track their movements. Larsen has seen Yakutat Glacier break apart into large icebergs and retreat significantly over the past few years. Most of the moss balls have ended up in Harlequin Lake.

Fuzzy moss balls, nicknamed glacier mice, gather in piles on Yakutat Glacier. Scientists have observed these moss balls change position over time, but the nature behind this movement is still largely a mystery. Credits: University of Alaska Fairbanks/Christopher Larsen

IceBridge Takes Flight from Down Under

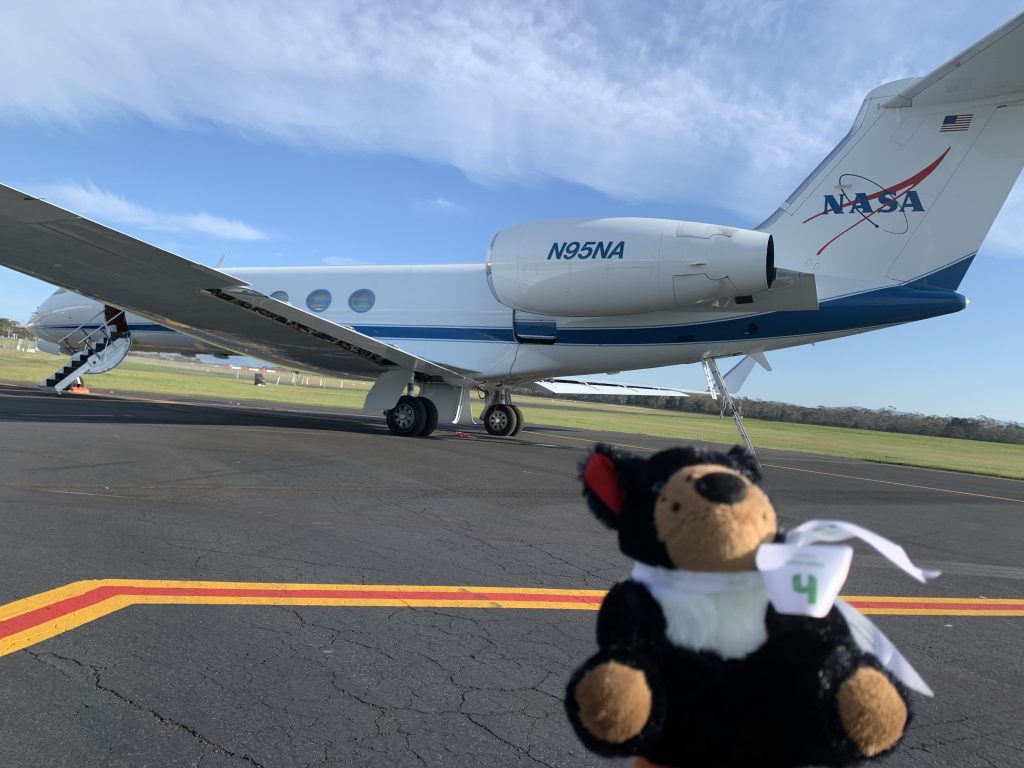
NASA’s Gulfstream GV aircraft is based in Tasmania, Australia this fall for Operation IceBridge flights to East Antarctica. (Credit: Linette Boisvert/NASA)
NASA’s Gulfstream GV aircraft is based in Tasmania, Australia this fall for Operation IceBridge flights to East Antarctica. Credit: Linette Boisvert/NASA

by Kate Ramsayer

Operation IceBridge took off on the first flight of its final polar campaign Thursday, with a route designed to measure the ice in a region of Antarctica the mission had not yet explored.

IceBridge has been gathering data on Arctic and Antarctic ice sheets, glaciers and sea ice for 10 years. It was designed to ‘bridge the gap’ in between the Ice, Cloud and land Elevation Satellite (ICESat), which stopped collecting data in 2009, and ICESat-2, which launched in September 2018. Over the past decade, IceBridge has been based out of airports in Alaska, Greenland, Chile, Argentina and Antarctica – but for this final polar campaign, it has a new base at Hobart in Tasmania, Australia.

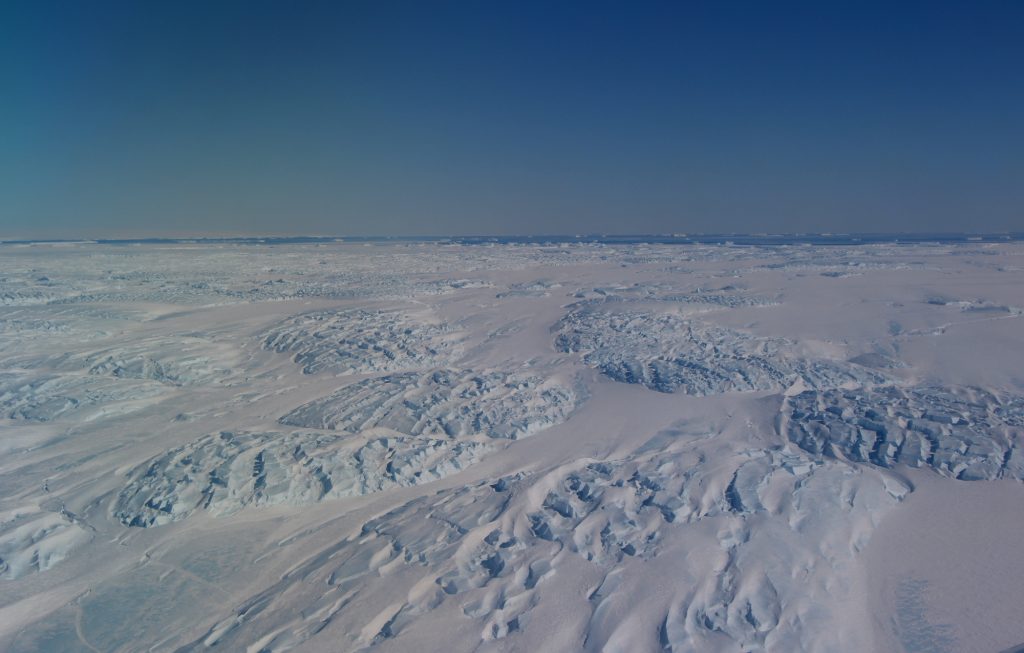
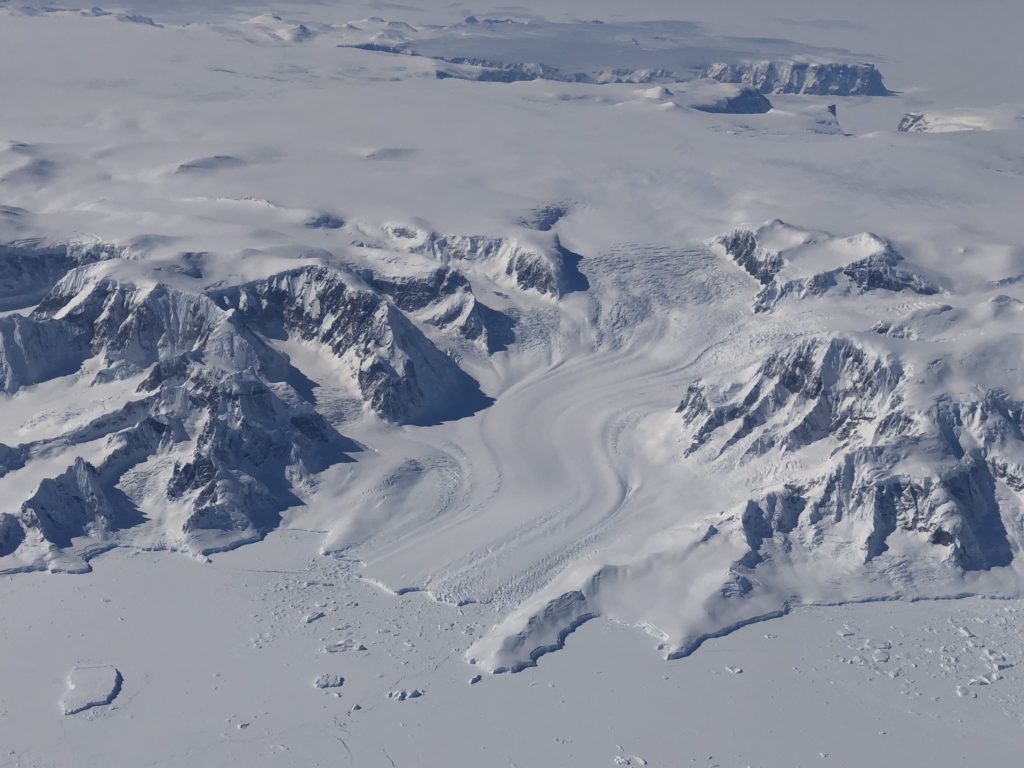
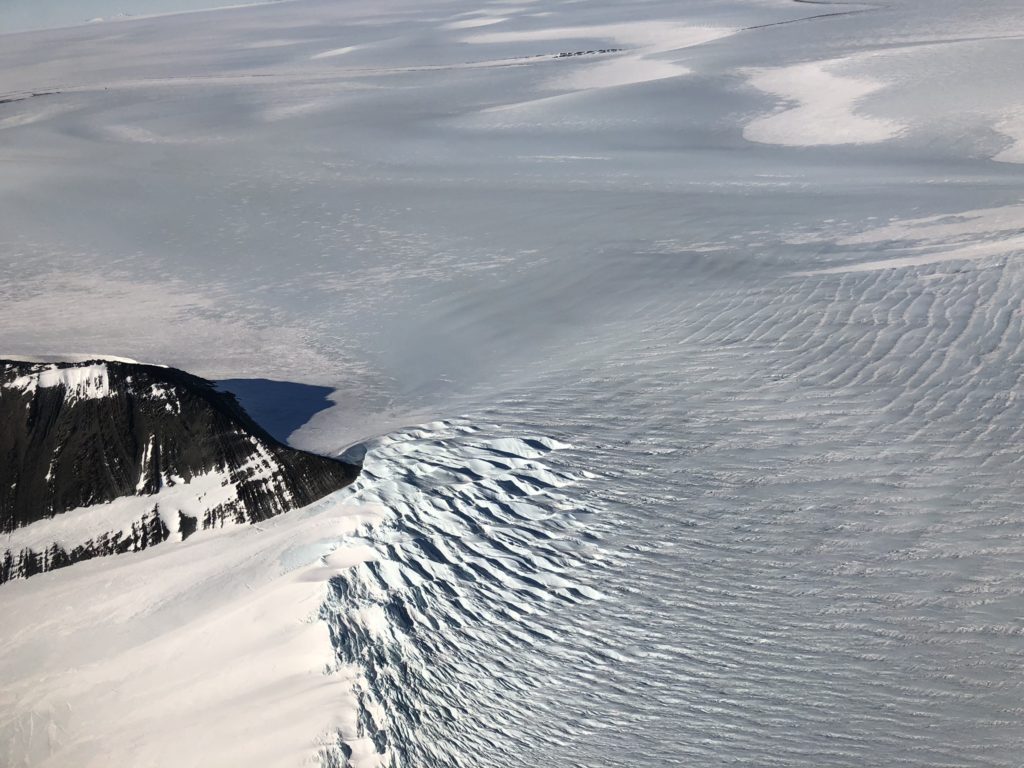
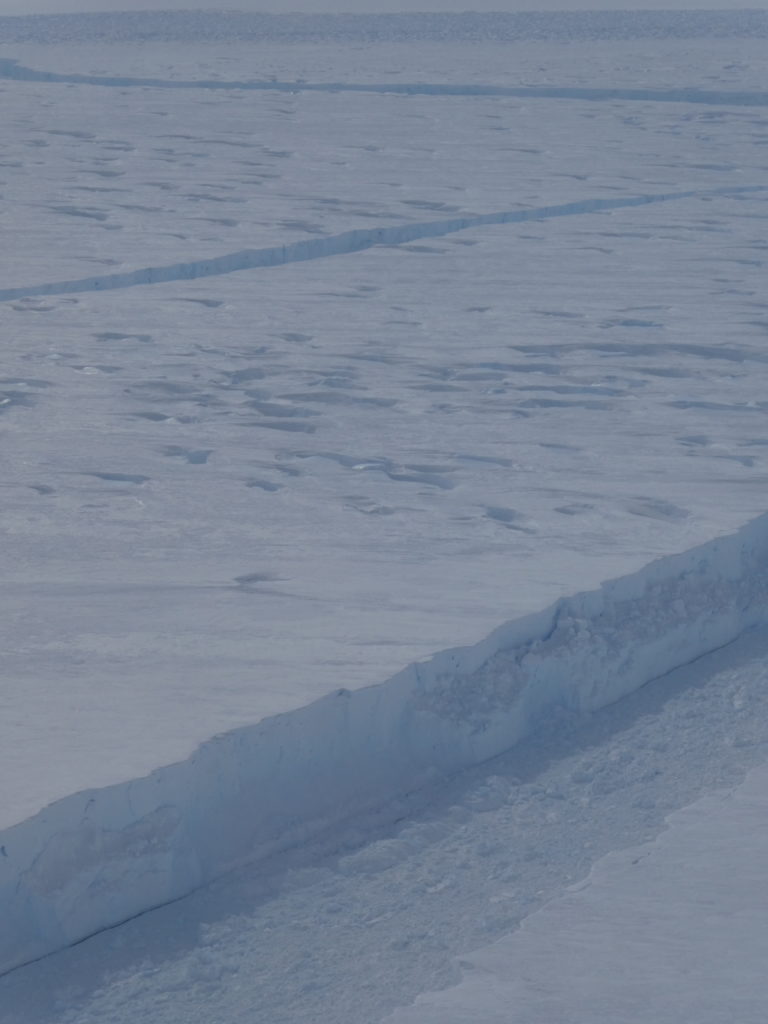
The tongue of Antarctica’s Dibble Glacier, as seen from the first flight of IceBridge’s final polar campaign. (Credit: John Sonntag/NASA)
The tongue of Antarctica’s Dibble Glacier, as seen from the first flight of IceBridge’s final polar campaign. Credit: John Sonntag/NASA

With flights from Australia instead of South America, IceBridge is better poised to measure more of East Antarctica, said Brooke Medley, IceBridge deputy project scientist at NASA’s Goddard Space Flight Center. There, the vast store of ice covers an area about the size of the continental United States – and it’s relatively unexplored, compared to West Antarctica and the Antarctic Peninsula.

On Thursday’s flight (that’s Thursday, Australian time, which is late Wednesday/early Thursday in the U.S.), IceBridge flew over the Dibble Glacier and nearby regions of the ice sheet, taking measurements not only of the ice but of the bedrock below. Onboard NASA’s Gulfstream GV aircraft are multiple instruments, including two versions of the Airborne Topographic Mapper (a laser altimeter to measure ice height), the Multichannel Coherent Radar Depth Sounder (MCoRDS), a gravimeter and several other instruments.

Future flights will take measurements of additional glaciers and sections of the ice sheet, as well as sea ice. With ICESat-2 in orbit, IceBridge will also fly along some of the satellite’s orbital paths, to measure the same stretch of ice and help ensure the year-old satellite’s data is accurate.
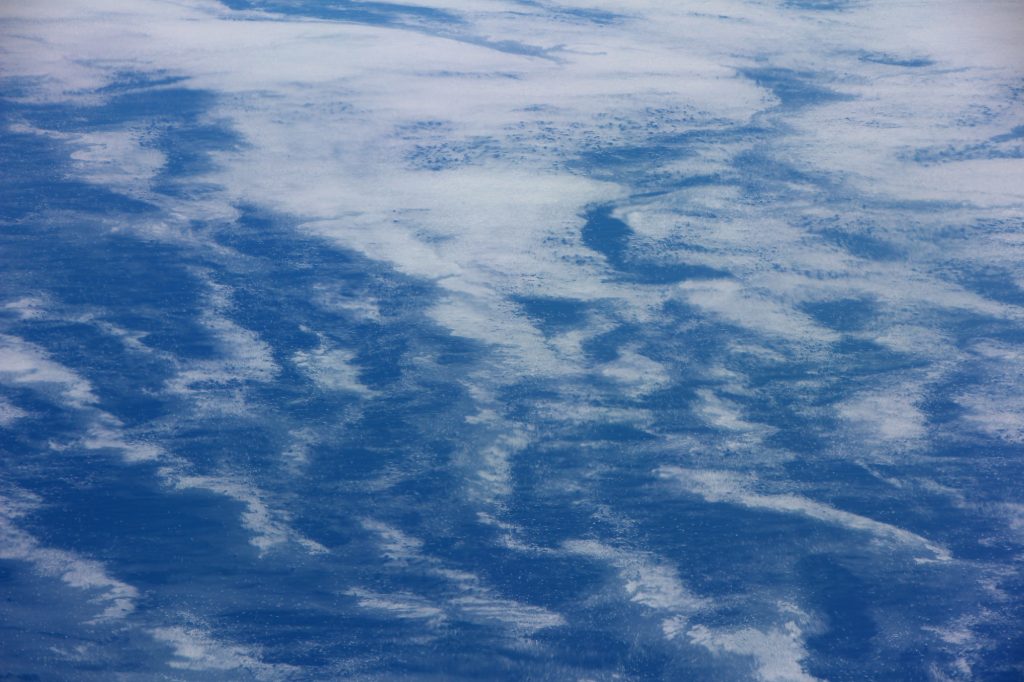
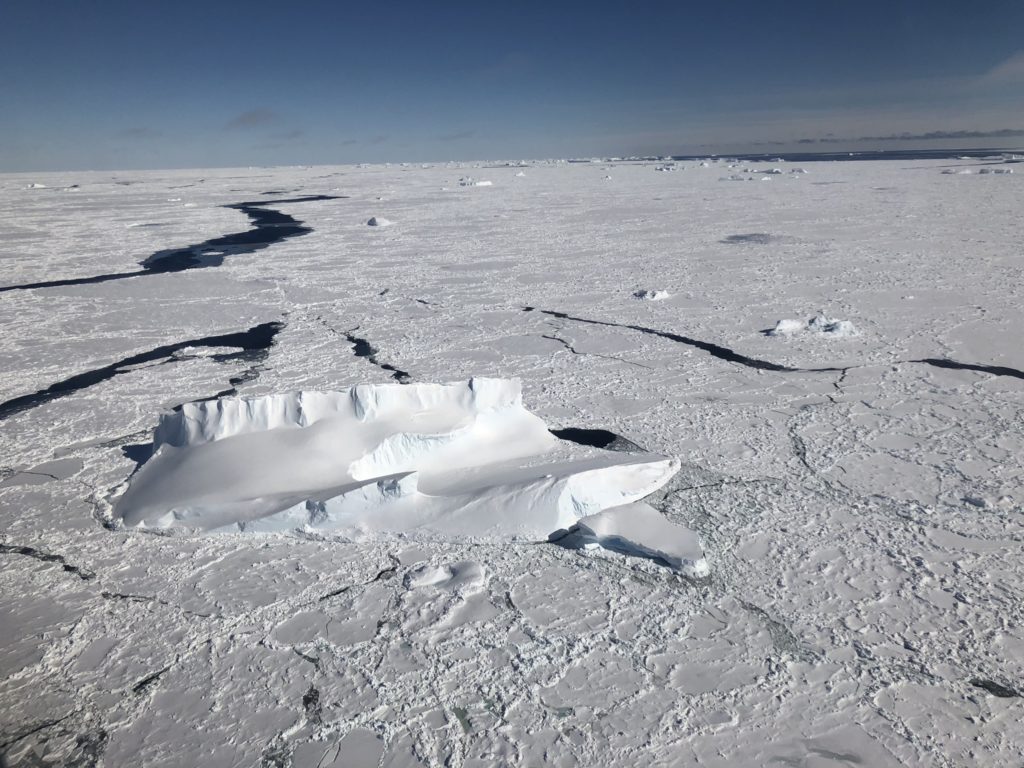
The marginal ice zone in the Southern Ocean north of Wilkes Land Credit: John Sonntag/NASA

This campaign is adding another element to the mix — in addition to the airborne and satellite measurements, scientists will be out on the ice taking height and density measurements as well. Researchers can then compare the data from the ground, air and space. Medley, who will be on the ice near Casey Station in Antarctica, said she’s looking forward to waving up at IceBridge as it flies over.

“I’m literally getting a new perspective: rather than looking down to the ice from the plane, I’m looking up from the ice to the plane!” she said. “It will be a very special experience.”


A Few of My Favorite (Frozen) Things

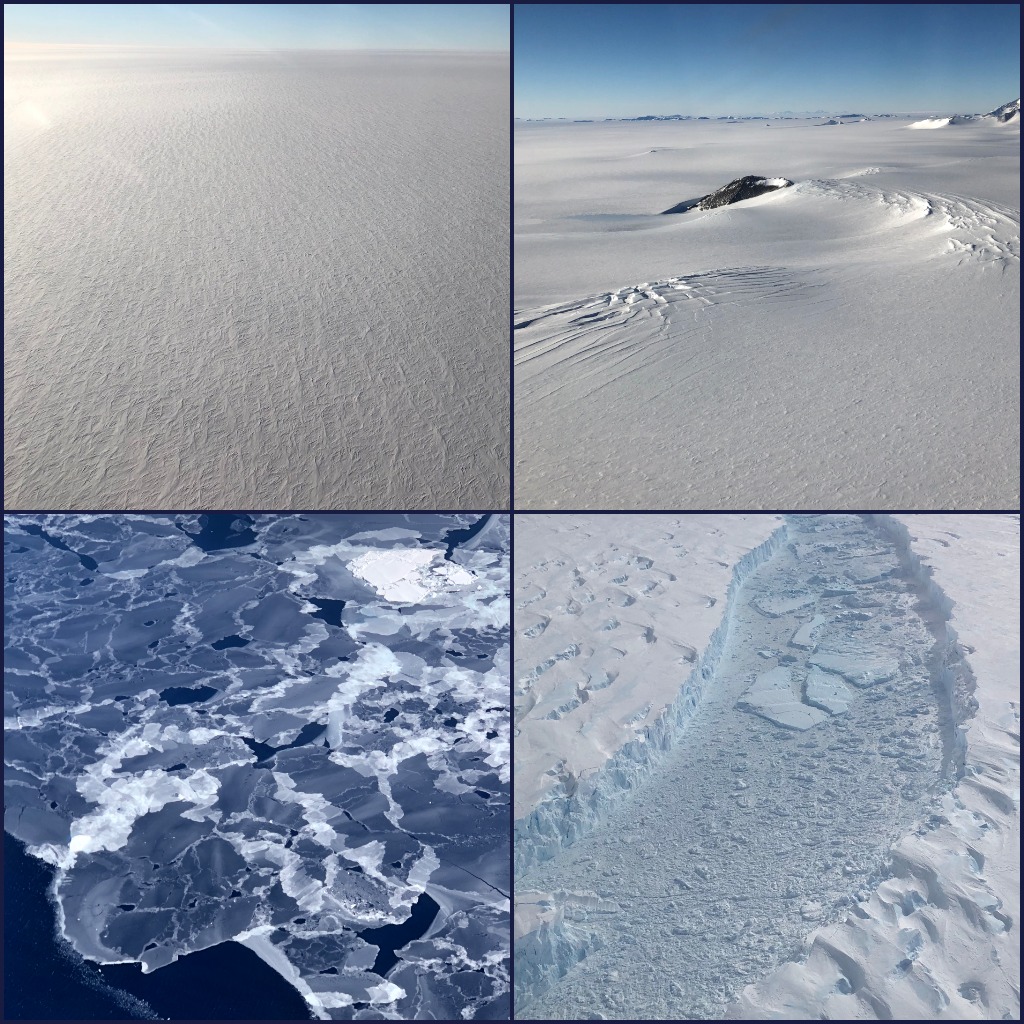
Sastrugi, crevasses, sea ice, and bergy bits—a few of my ever-changing favorite things. Credits: NASA/Kate Ramsayer

by Kate Ramsayer / ANTARCTICA /

I knew they were my favorite as soon as I saw them. Sastrugi, the ice dunes of the polar desert, covered the landscape when I first flew low over Antarctica with Operation IceBridge. They were amazing—winds had shaped them into repeating patterns, appearing as diamonds or fish scales or branching tree roots. They were the only texture in the vast ice sheet that stretched as far as the eye could see.

The next day, however, crevasses took the top spot. Gigantic cracks that bent around mountains as the mass of ice crept toward the ocean—those were definitely my new favorite ice formations. As our IceBridge team took measurements down a path that ICESat-2 would trace from its orbit in space, I wondered how the height profile from these instruments could reflect these seemingly bottomless and terrifying cracks in the ice.

Then sea ice made an appearance. Icebergs were trapped at awkward angles in the frozen floes, and new ice spreading across open waters in translucent blues and whites—those had to be the most artistic formations, right? Maybe so—in my mind—until the next flight, which measured a newly created gigantic iceberg, and I glimpsed the jumble of bergy bits and sea ice in the rift between it and the glacier.

A glacier on the Antarctic Peninsula flows into the Bellingshausen Sea. Credits: NASA/Kate Ramsayer

At least I would be safe from a new favorite ice formation on my last flight, I thought. A survey farther inland of a region we had flown before, it should be old hat. But no. As we flew toward the site, the skies cleared over the Antarctic Peninsula, revealing glacier after glacier after glacier, all textbook examples of how spectacular glaciers can be.

Every day flying over Antarctica with the Operation IceBridge campaign brought a new incredible stretch of ice that left me, a new visitor to the continent, awestruck. Many members of the team have been surveying the continent for years, using a suite of instruments to map the ice and bedrock and monitor change. I couldn’t pick a favorite view, and can’t imagine they could either, so instead I just asked some of the IceBridge crew for an example of one of the neatest things they’ve seen flying over Antarctica.

Actually seeing Pine Island and Thwaites glaciers, which she has studied for more than a decade, is a highlight for Brooke Medley, IceBridge’s deputy project scientist. Her research showed that enough ice flows out of each glacier to contribute 1 millimeter to global sea level rise per decade. They’re massive glaciers, and flying over them puts into perspective just how massive they are. Credits: NASA/Kate Ramsayer 
The vastness of the Antarctic ice sheet can leave Eugenia DeMarco, IceBridge’s project manager, speechless. It’s just raw nature, she said, and provides a glimpse of what early explorers might have felt when they first ventured to this distant part of the world. Credits: NASA/Kate Ramsayer
In massive ice streams that appear solid and unmoving, it’s the crevasses that remind you the ice is in motion, said Thorsten Markus, ICESat-2 project scientist. These giant breaks form as the faster ice downstream pulls away from the slower ice upstream. Credits: NASA/Brooke Medley 
From above, crevasses can appear as wrinkles on fabric. Credits: NASA/Kate Ramsayer
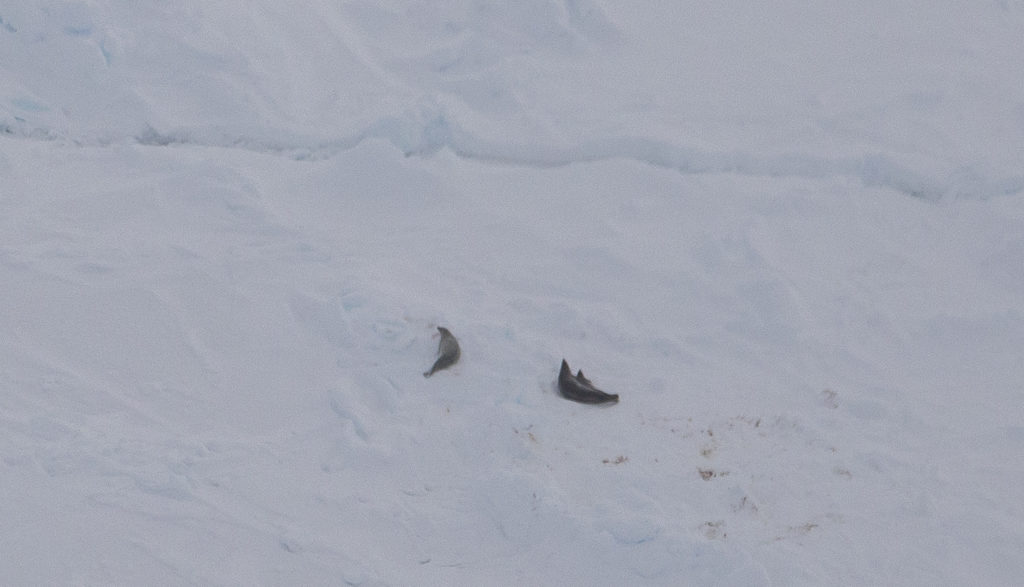
The ice may seem desolate, but there’s life in Antarctica, and Lyn Lohberger, an aircraft mechanic and safety technician, points to seals visible on the ice floes. They provide a contrast as well, he said—the black seals on the white ice, with blue seas and sky. Credits: NASA/Jeremy Harbeck
Icebergs that have broken off of glaciers and ice shelves create different three-dimensional shapes in the flat sea ice, noted Victor Berger, with the CReSIS snow radar team. And Tim Moes, DC-8 project manager, pointed out the blue color of the older ice visible in the bergs. Credits: NASA/Kate Ramsayer
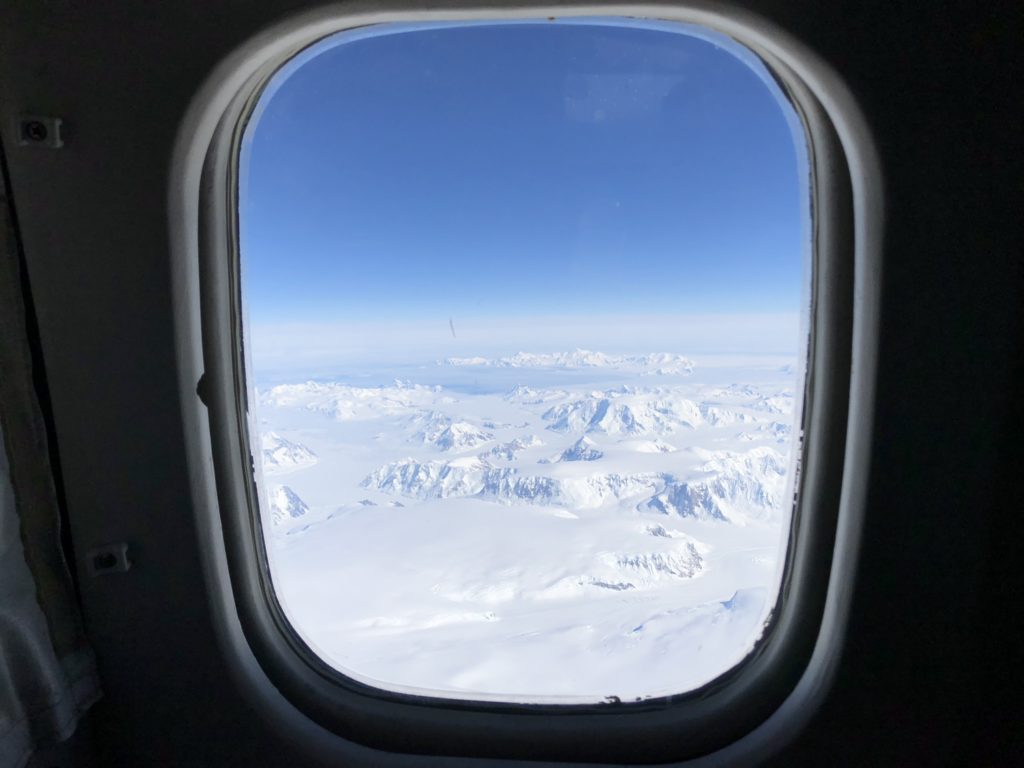
Operation IceBridge has surveyed Arctic and Antarctic ice for a decade, collecting scientific data on the changing ice. It’s the best office window view, said Jim Yungel, Airborne Topographic Mapper team lead—and it never gets old. Credits: NASA/Kate Ramsayer

Iceberg Ahead!

The NASA DC-8 aircraft’s shadow is dwarfed in scale by the B-46 iceberg. Credits: NASA/Brooke Medley

by Kate Ramsayer / THE SKIES ABOVE ANTARCTICA /

The crack that would become B-46 was first noticed in September 2018 – and the berg broke the next month.

NASA’s Operation IceBridge flew over a new iceberg that is three times the size of Manhattan on Wednesday – the first known time anyone has laid eyes on the giant berg, dubbed B-46, that broke off from Pine Island Glacier in late October.

The flight over one of the fastest-retreating glaciers in Antarctica was part of IceBridge’s campaign to collect measurements of Earth’s changing polar regions. Surveys of Pine Island are one of the highest priority missions for IceBridge, in part because of the glacier’s significant impact on sea level rise.

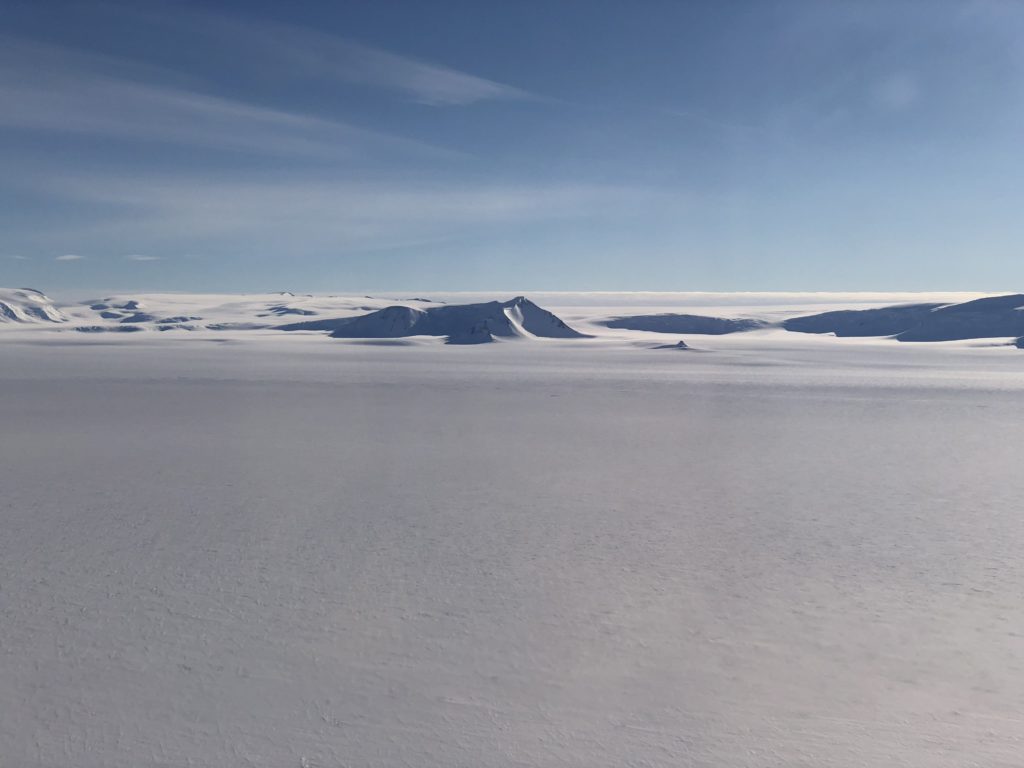
On Wednesday, IceBridge’s approach to the iceberg began far above the glacier’s outlet, in the upper reaches of ice that will eventually flow into the glacier’s trunk. There, as far as the eye can see, it was flat and it was white.

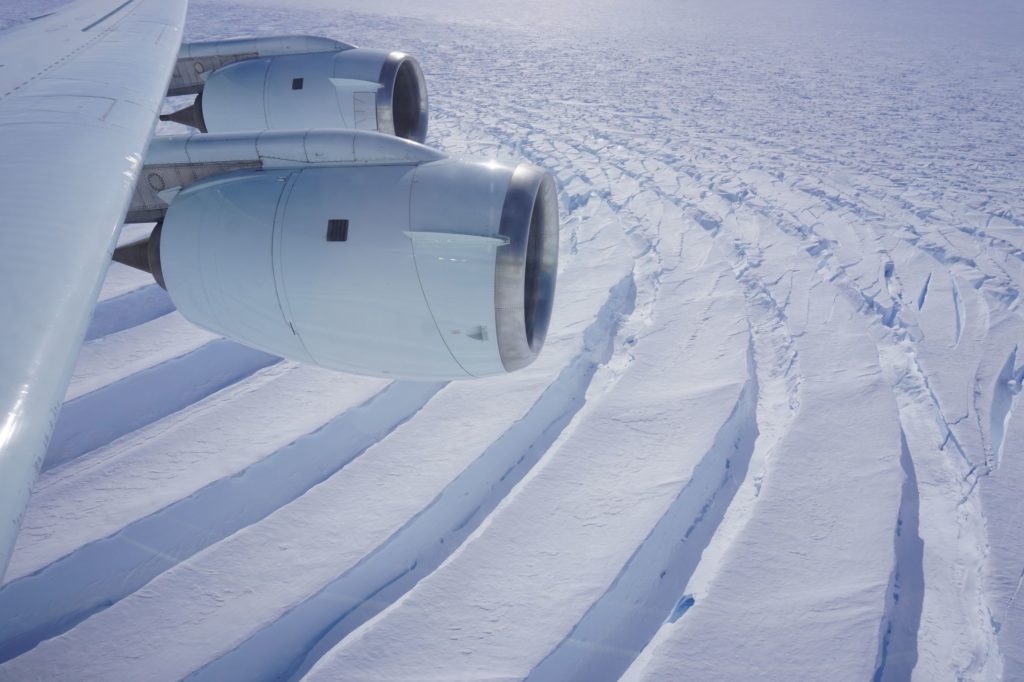
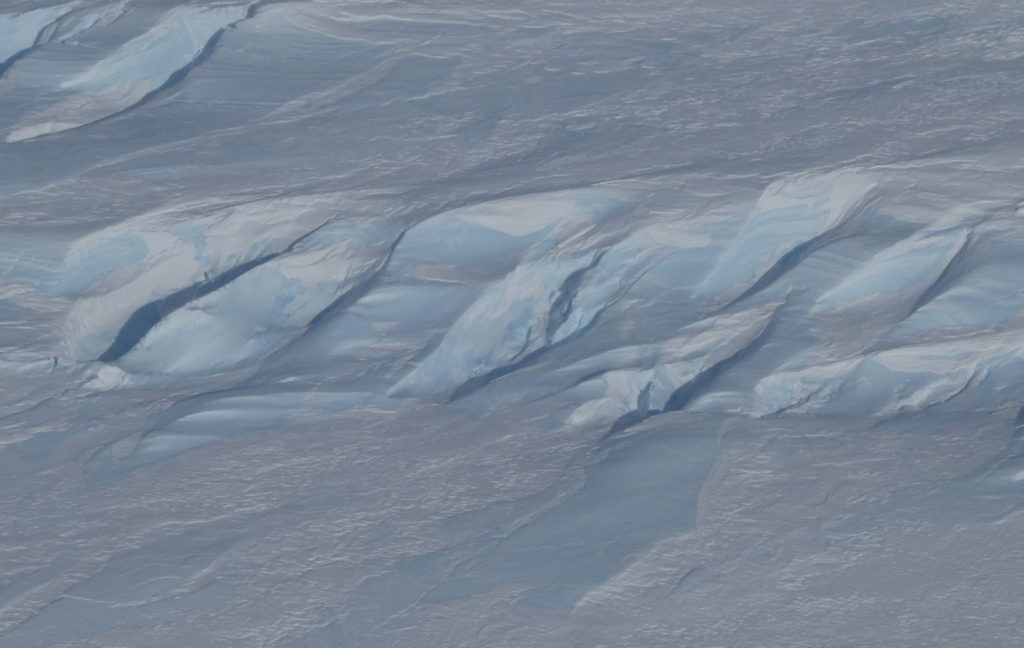
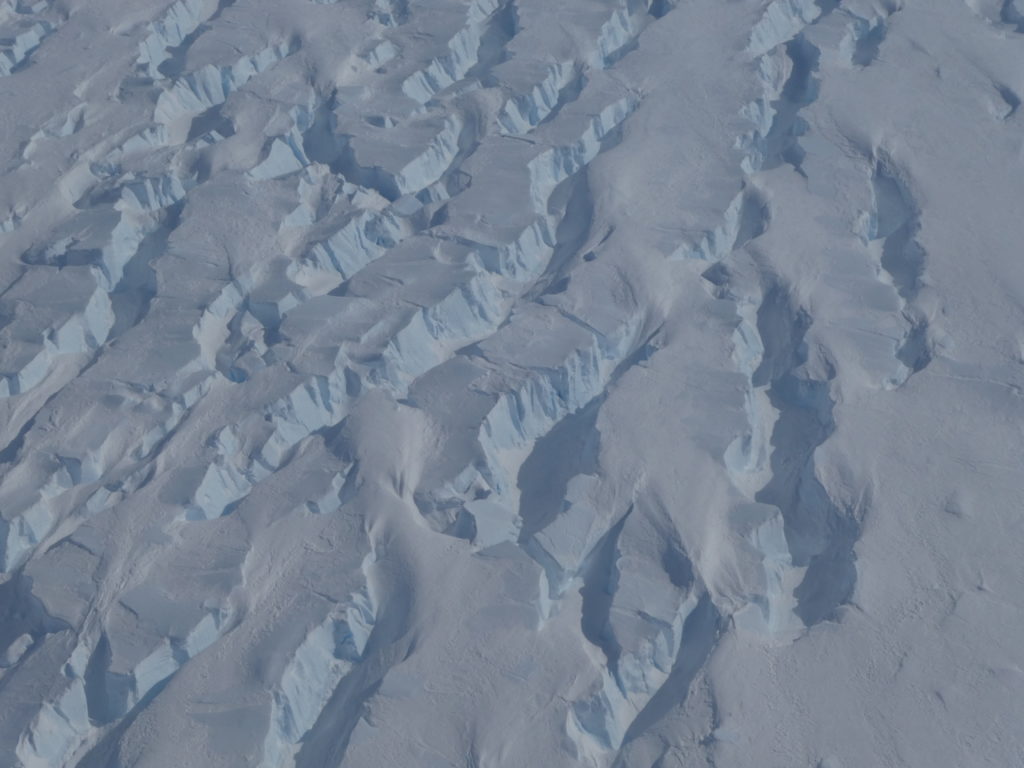
As the aircraft headed toward the glacier’s outlet in the Amundsen Sea, snow-covered crevasses became visible when sunlight struck at just the right angle. Every once in a while, a dark hole appeared in the crevasses where the snow had fallen through, providing a glimpse into the depths of the ice sheet. Then the holes got bigger.

The crevasses and dunes became a jumbled mess of ice, as Pine Island Glacier picks up speed as it flows to the sea. The crevasses got deeper and wider, swirling around each other. Striated snow layers in white and pale blue were visible down the crevasse walls, like an icy version of the slot canyons in the American West.

Crevasses in Pine Island Glacier indicate how fast the ice is moving. Credits: NASA/Kate Ramsayer
Crevasses in Pine Island Glacier get larger as the ice moves faster toward the Amundsen Sea. Credits: NASA/Kate Ramsayer

Then finally – the berg. Satellite imagery had revealed a massive calving event from Pine Island in late October, and the IceBridge crew was the first to lay eyes on the newly created iceberg.

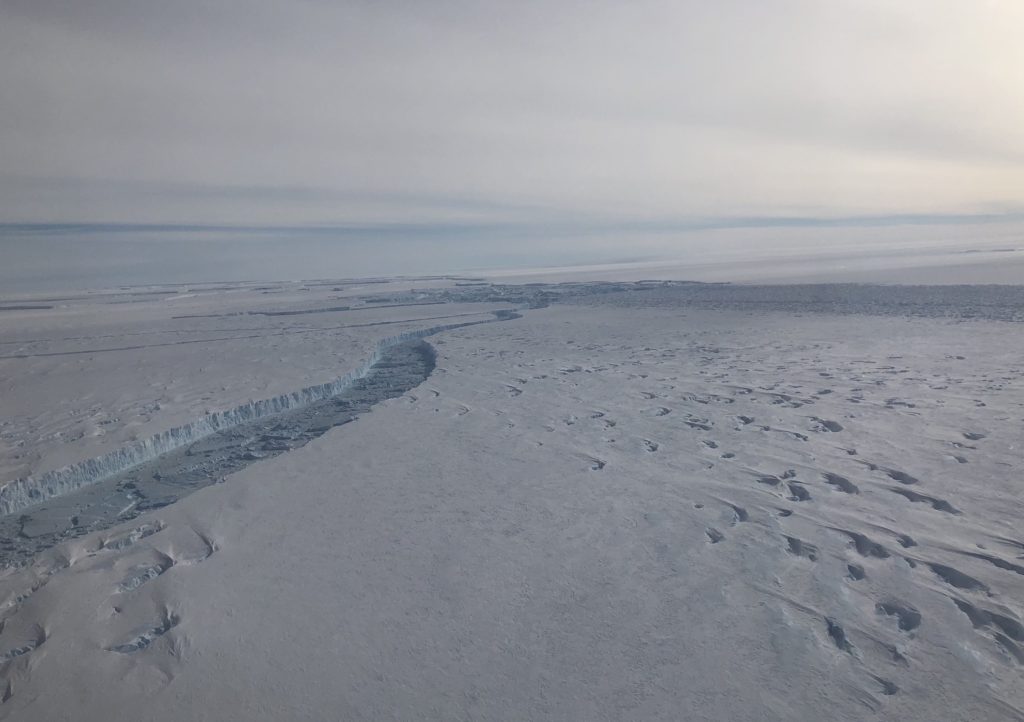
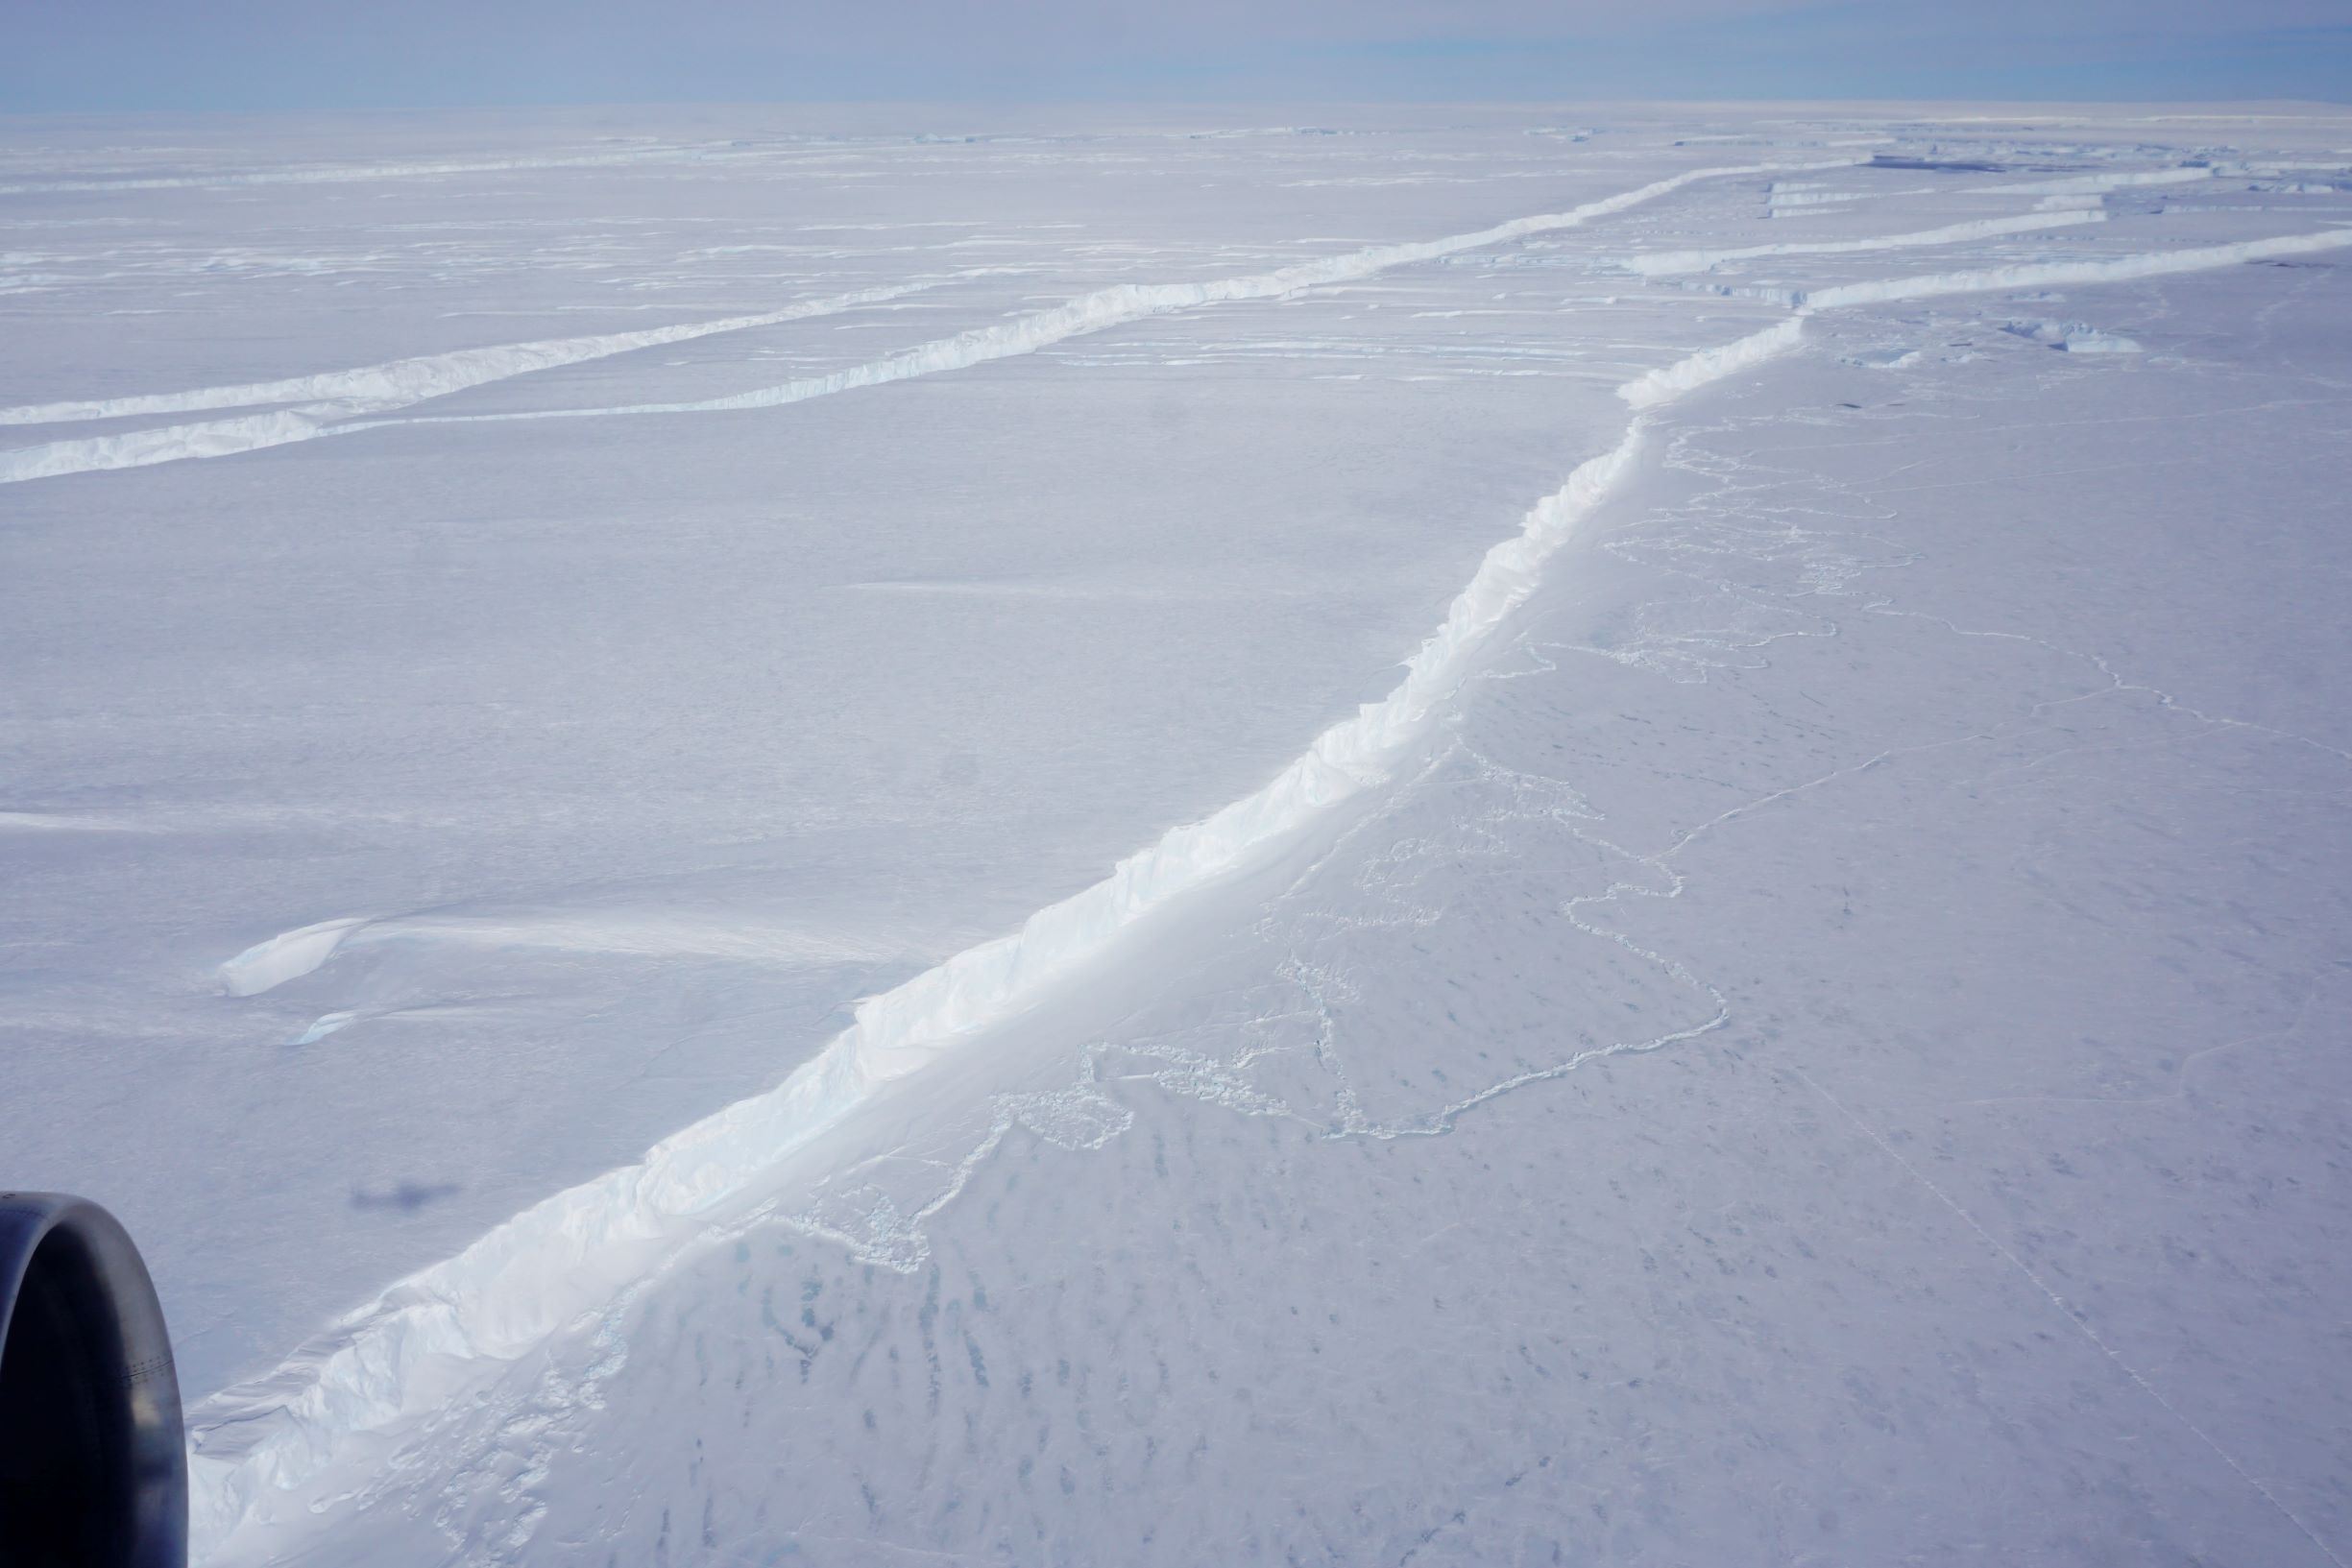
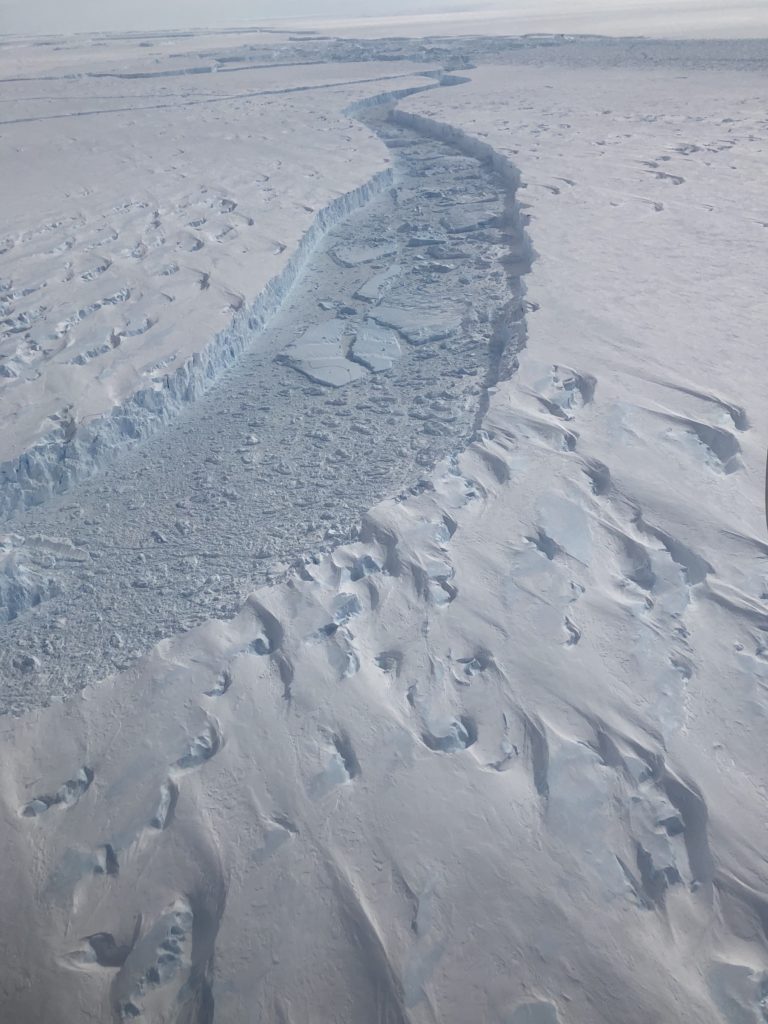
The glacier ends in a sheer 60-meter cliff, dropping off into an ocean channel filled with a mix of bergy bits, snow, and newly forming sea ice. On the other side, a matching jagged cliff marked the beginning of B-46, as it stretched across the horizon.

The rift between Pine Island Glacier and a new giant iceberg, dubbed B-46, in Antarctica. Credits: NASA/Kate Ramsayer

“From this perspective at 1,500 feet, it’s actually really difficult to grasp the entire scale of what we just looked at,” said Brooke Medley, Operation IceBridge’s deputy project scientist who has studied Pine Island Glacier for 12 years. “It was absolutely stunning. It was spectacular and inspiring and humbling at the same time.”

Even though it had calved just over a week ago, the berg was already showing signs of wear and tear. Cracks wove through B-46, and upturned bergy bits floated in wide rifts. The iceberg will probably break down into smaller icebergs within a month or two, Medley said.

Iceberg calving is normal for glaciers – snow falls within the glacier’s catchment and slowly flows down into the main trunk, where the ice starts to flow faster. Eventually it encounters the ocean, is lifted afloat, and over time travels to the edge of the shelf. There, ice breaks off in the form of an iceberg. When the amount of snowfall and ice loss (from iceberg calving and melt) are the same, a glacier’s in balance. So it’s hard to link a particular iceberg like B-46 to the increasing ice loss from Pine Island Glacier.

A sheer wall of the new iceberg B-46 looms over a mix of sea ice, bergy bits, and snow at the base of Pine Island Glacier, as seen from a NASA Operation IceBridge flight on Nov. 7, 2018. Credits: NASA/Kate Ramsayer

But the frequency, speed, and size of the calving is something to keep an eye on, Medley said. In 2016, IceBridge saw a crack beginning across the base of Pine Island; it took a year for an actual rift to form and the iceberg to float away.

The crack that would become B-46 was first noticed in September 2018 – and the berg broke the next month.

They’re not the biggest glaciers on the planet, but Pine Island and its neighbor, Thwaites, have an oversized impact on sea level rise. Enough ice flows from each of these West Antarctic glaciers to raise sea levels by more than 1 millimeter per decade, according to a study led by Medley. And by the end of this century, that number is projected to at least triple.

“It’s deeply concerning,” Medley said. The geography of these glaciers make them highly susceptible to ice loss: relatively warm waters cut under the ice shelf, weakening it from below. This shock to the system has the capability to initiate an unstoppable retreat of these glaciers. There’s a reason Pine Island and Thwaites are dubbed the “weak underbelly” of Antarctica.

NASA has been monitoring Pine Island Glacier from aircraft since 2002, and IceBridge started taking extensive measurements of the fast-moving ice in 2009.

“Both Pine Island and Thwaites are ready to go and to take their neighboring glaciers with them,” Medley said. “Ice is getting sucked out into the ocean – and it’s hard to stop it.”

Compasses Get Quite Unhappy When Every Direction Is North

by Kate Ramsayer / 20,000 FEET ABOVE THE SOUTH POLE /

This was my first flight over Antarctica, and the vast expanse of ice – just white on the ground and blue in the sky as far as the eye can see – took my breath away.

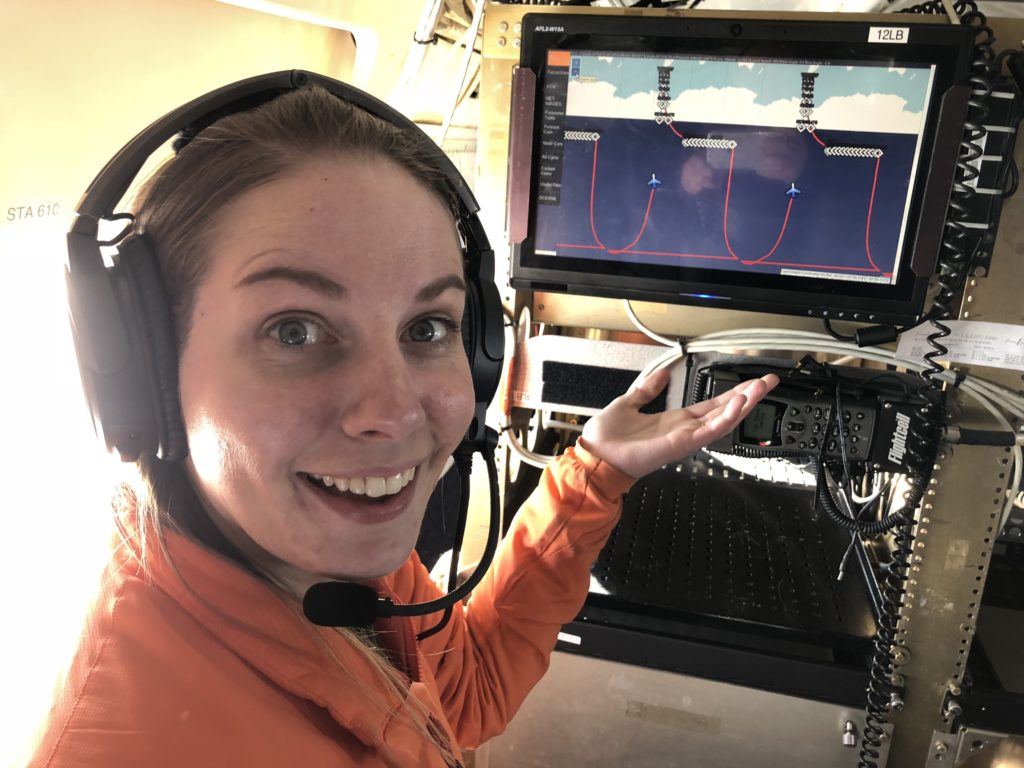
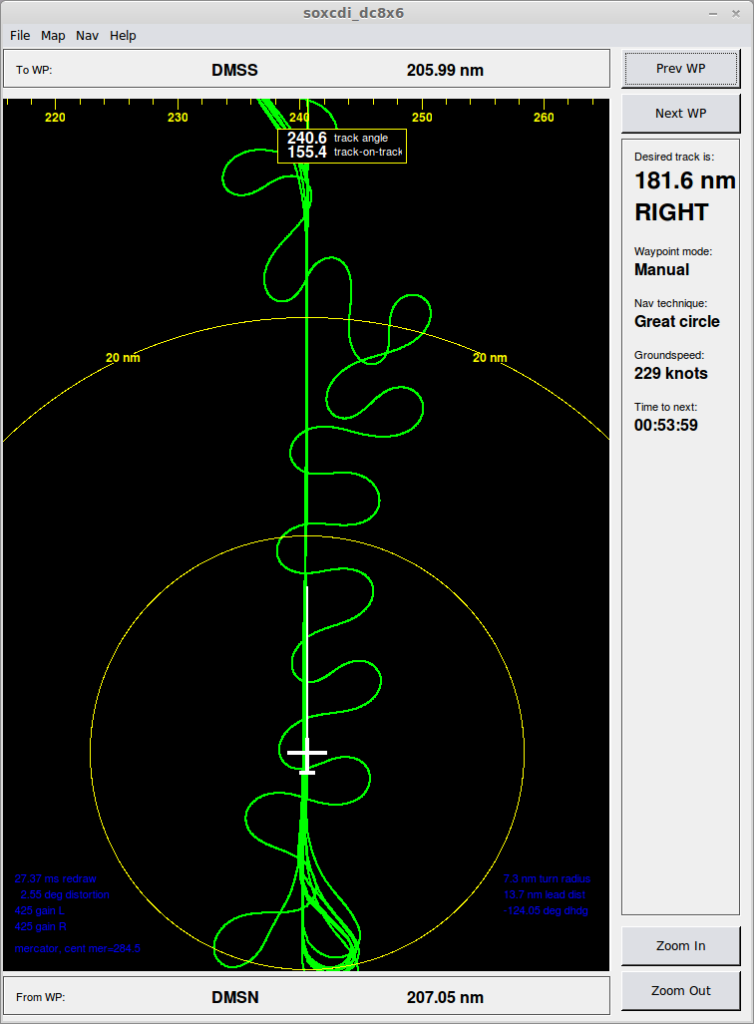
As Operation IceBridge flew directly over the South Pole, my eyes went to the updating flight map. We were already off the edge of the map, as our survey line along 88 degrees south latitude had dropped below the extent of the Mercator projection. And now, as the latitude indicator counted up to 90 degrees and the crew counted down the seconds, I watched as our flight path showed the plane completely reversing course midair and looping up north. Of course, (and fortunately for my stomach) our actual DC-8 aircraft kept in a straight line.

OIB Deputy Project Scientist Brooke Medley shows the weird flight map path that results from flying around, then over, the South Pole. Credits: NASA/Kate Ramsayer
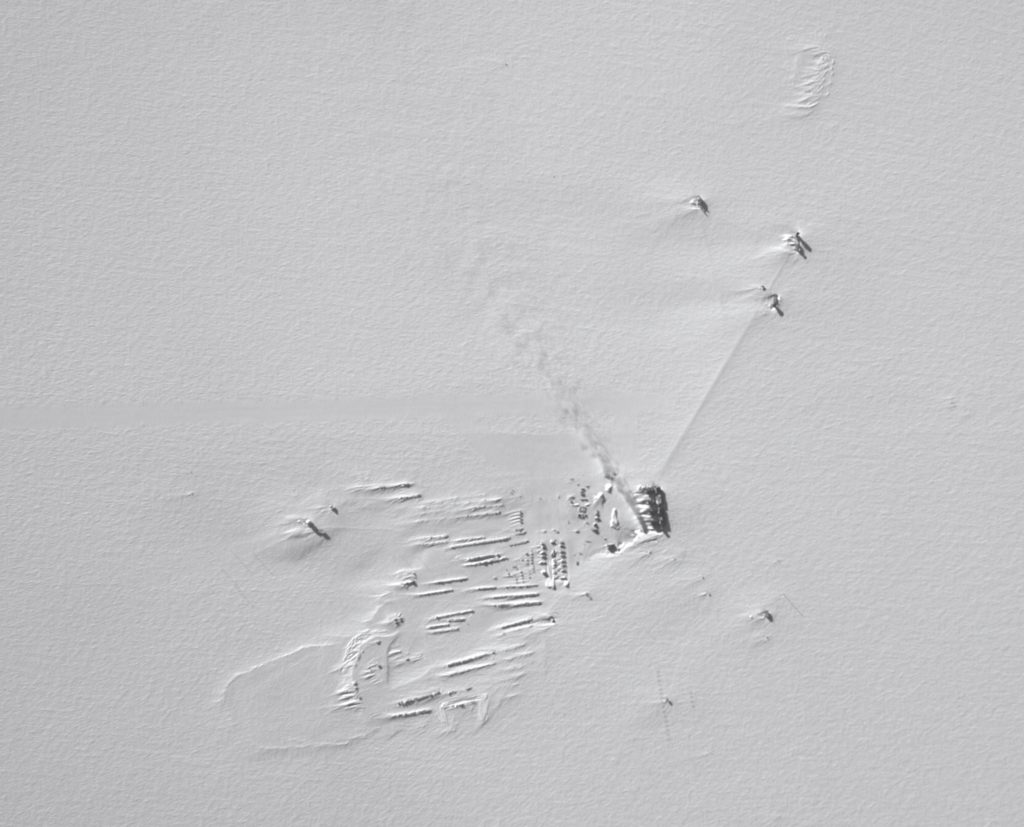
The Continuous Airborne Mapping By Optical Translator (CAMBOT) system images the Amundsen-Scott South Pole station as NASA’s DC-8 flying laboratory ascends after completing a survey line. Credits: NASA/Matt Linkswiler

Navigating can be tricky at the end of the world. While the mapping software went out of whack crossing over the pole, the actual flight software didn’t miss a beat – IceBridge Mission Scientist John Sonntag programmed it that way, knowing the ice-monitoring flights would need to handle the situation.

And although Halloween was last week, Saturday’s flight called for another trick – fooling the plane into flying a smooth arc around the 88 south line of latitude.

“Basically, we hack the autopilot,” Sonntag said. “We make the aircraft think that it’s lining up on a runway in bad weather, and the pilots can’t see. But what we’re really doing is lining it up on a data collection line, and doing it very precisely.”

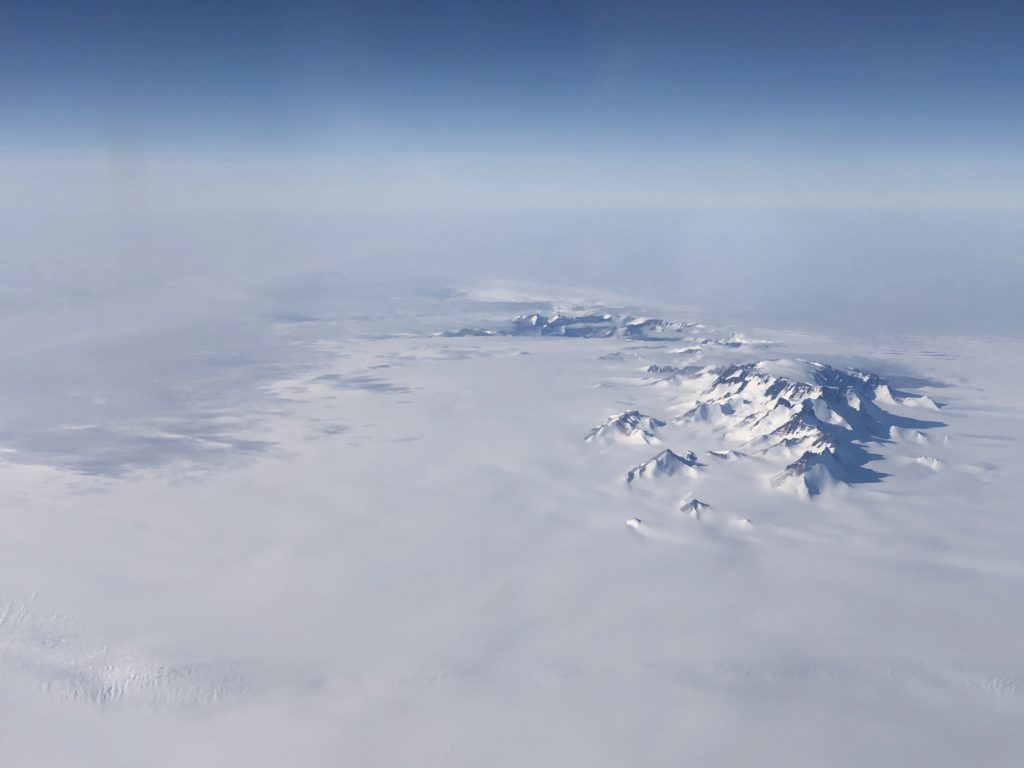
West Antarctic mountains, on the way to the South Pole. (NASA/Kate Ramsayer)

He developed this system to deal with a quirk of flying at such a high latitude. If a plane is flying at the equator and wanted to go east, it would just go straight. But to go due east along the 88 south latitude line, the plane has to actually turn to the right a bit. If we wanted to circle the pole at 89 degrees latitude, we’d have to turn right even more.

Typical navigation procedures involve flying the shortest path between two points (known as a “great circle” path), where the aircraft’s heading varies continually to keep it on the flight path. But this far south, that would create a scalloped flight path: not efficient for the plane nor optimal for the instruments onboard, and – again – not friendly to my stomach. So Sonntag designed an autopilot system that can fly a perfect, smooth arc around the pole, along a mathematical concept called a loxodrome.

“I’m half engineer and half scientist, and this flight brings out the engineer nerd in me – I love this stuff,” Sonntag said. “Then seeing this in use, flying a 350,000-pound airplane around the South Pole – I mean, it’s nerd heaven.”

Sastrugi are fragile shapes on top of snow that are formed by winds. Sastrugi near the South Pole suggest there are two dominant wind directions. Credits: NASA/Brooke Medley

It was nerd heaven for me as well,  but for different reasons. This was my first flight over Antarctica, and the vast expanse of ice – just white on the ground and blue in the sky as far as the eye can see – took my breath away.

This particular survey route isn’t a favorite with the regular crew. There’s none of the dramatic mountains of the coastal glaciers, or icebergs calving into sea ice. But I loved seeing the repeating kaleidoscope patterns of the ice dunes called sastrugi (a favorite word AND a favorite ice formation, all in one!). From 1,500 feet up, it’s almost impossible to gauge how high they are, but it’s an incredible texture in this bleak, bright expanse of ice.

And this was a key flight for another reason: I’ve been writing for the ICESat-2 mission for more than five years, and in September I watched as it launched into orbit. ICESat-2 uses a laser instrument to measure the height and focuses on the polar regions. All of its orbits cross the globe at – you guessed it – 88 south latitude. So by flying this route a third of the way around the 88 south latitude circle, IceBridge is taking measurements that will help check a third of ICESat-2’s orbits.

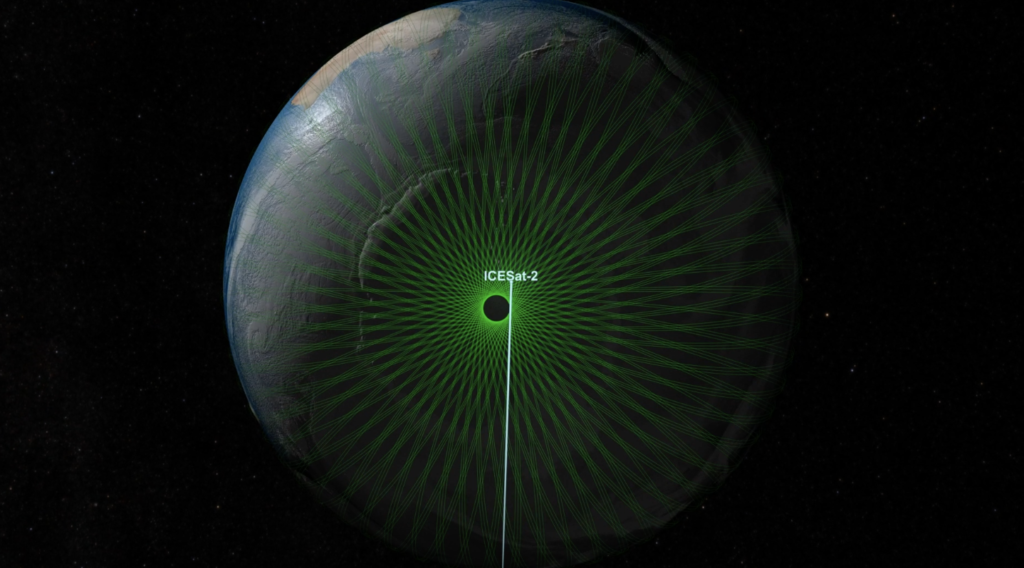
The ATLAS lidar on ICESat-2 uses three pairs of laser beams to measure Earth’s elevation and elevation change. As a global mission, ICESat-2 collects data over the entire globe. However the ATLAS instrument is optimized to measure land ice and sea ice elevation in the polar regions, as is shown by this graphic representation of its orbital path around the South Pole. Credits: NASA

That means the satellite instrument I saw years ago when it was just an empty box in a cleanroom flew over that stretch of ice we measured 16 times, taking 60,000 height measurements each second. From 300 miles up, it measured the height of my new favorite sastrugi.

Inspiring Students 1,500 Feet Above Antarctica

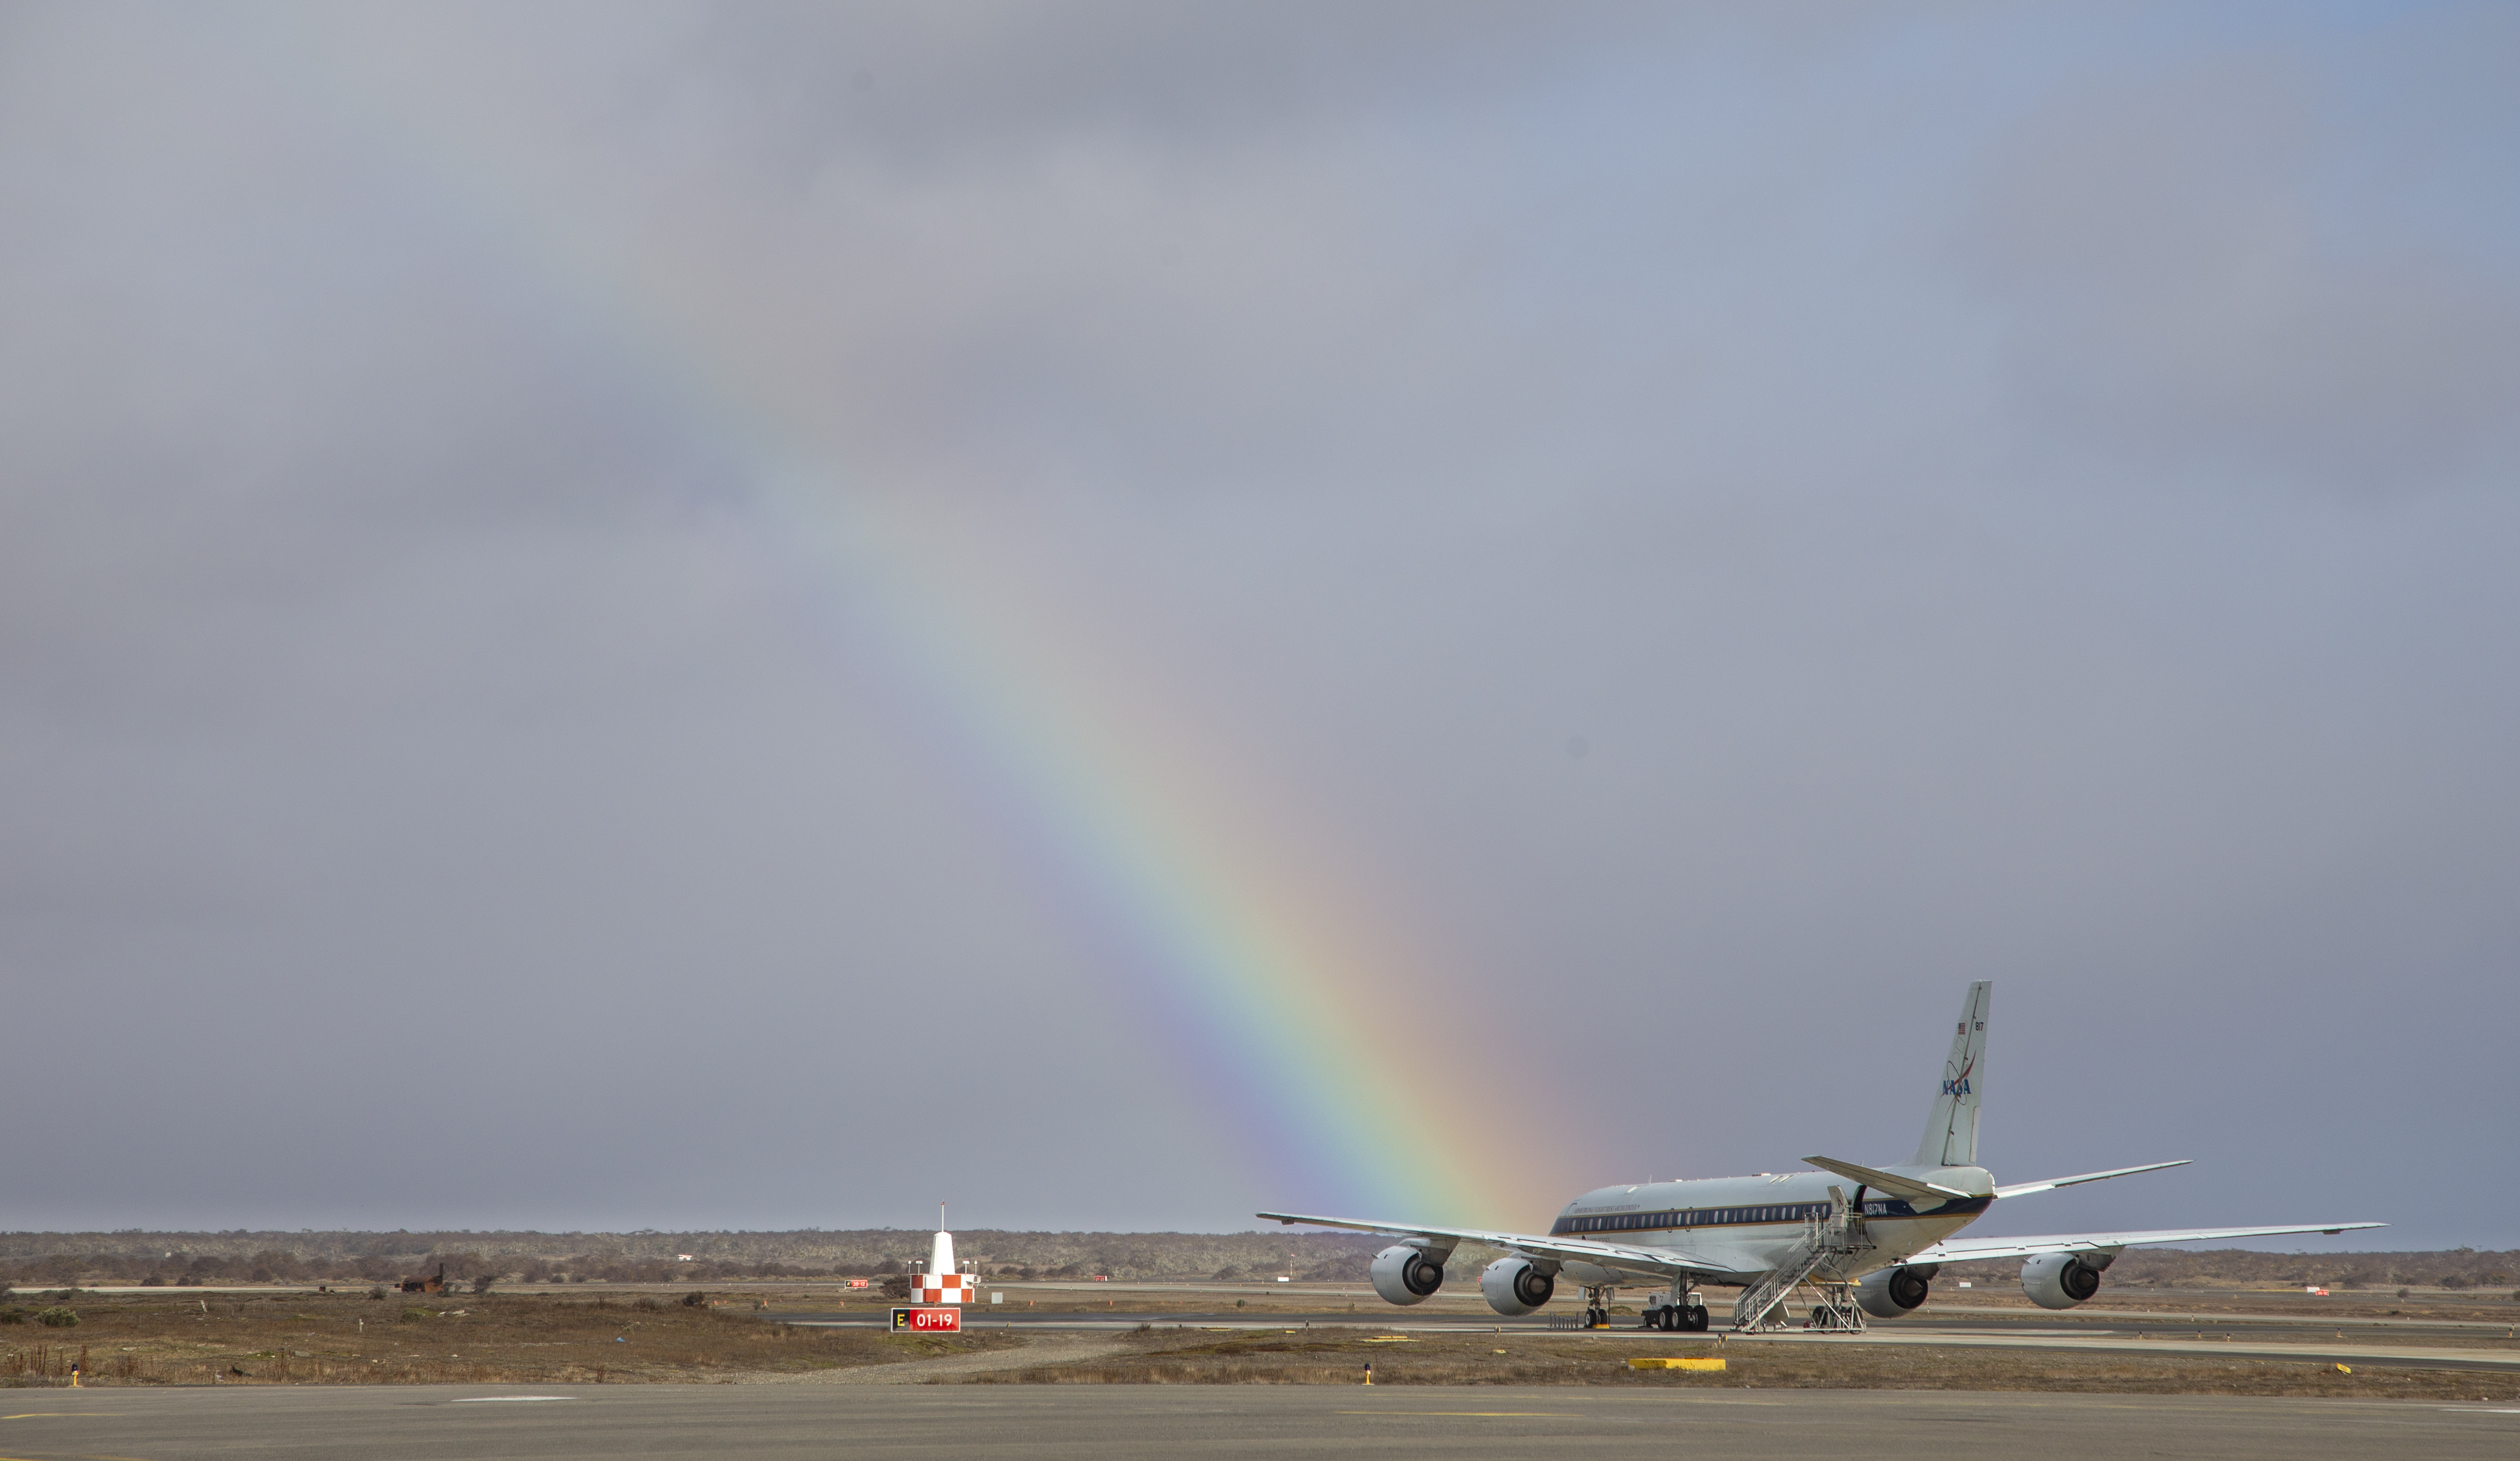
A rainbow appears in the backdrop of NASA’s DC-8 at the Punta Arenas Airport in Chile before takeoff. Credits: NASA/Jeremy Harbeck

by Linette Boisvert / SKIES ABOVE ANTARCTICA /

NASA’s Operation IceBridge (OIB) fall campaign in the Antarctic  has been a much different experience for me compared to past campaigns. This is in part because of my new role and responsibilities as deputy project scientist for OIB, but also because I am currently in the southern hemisphere for the first time and seeing Antarctic sea ice and land ice for the first time in person! If that wasn’t enough new stuff, I am now spending 12 hours a day flying over Antarctica, almost nearing the South Pole. (That is the topic of a future blog…so stay tuned!)

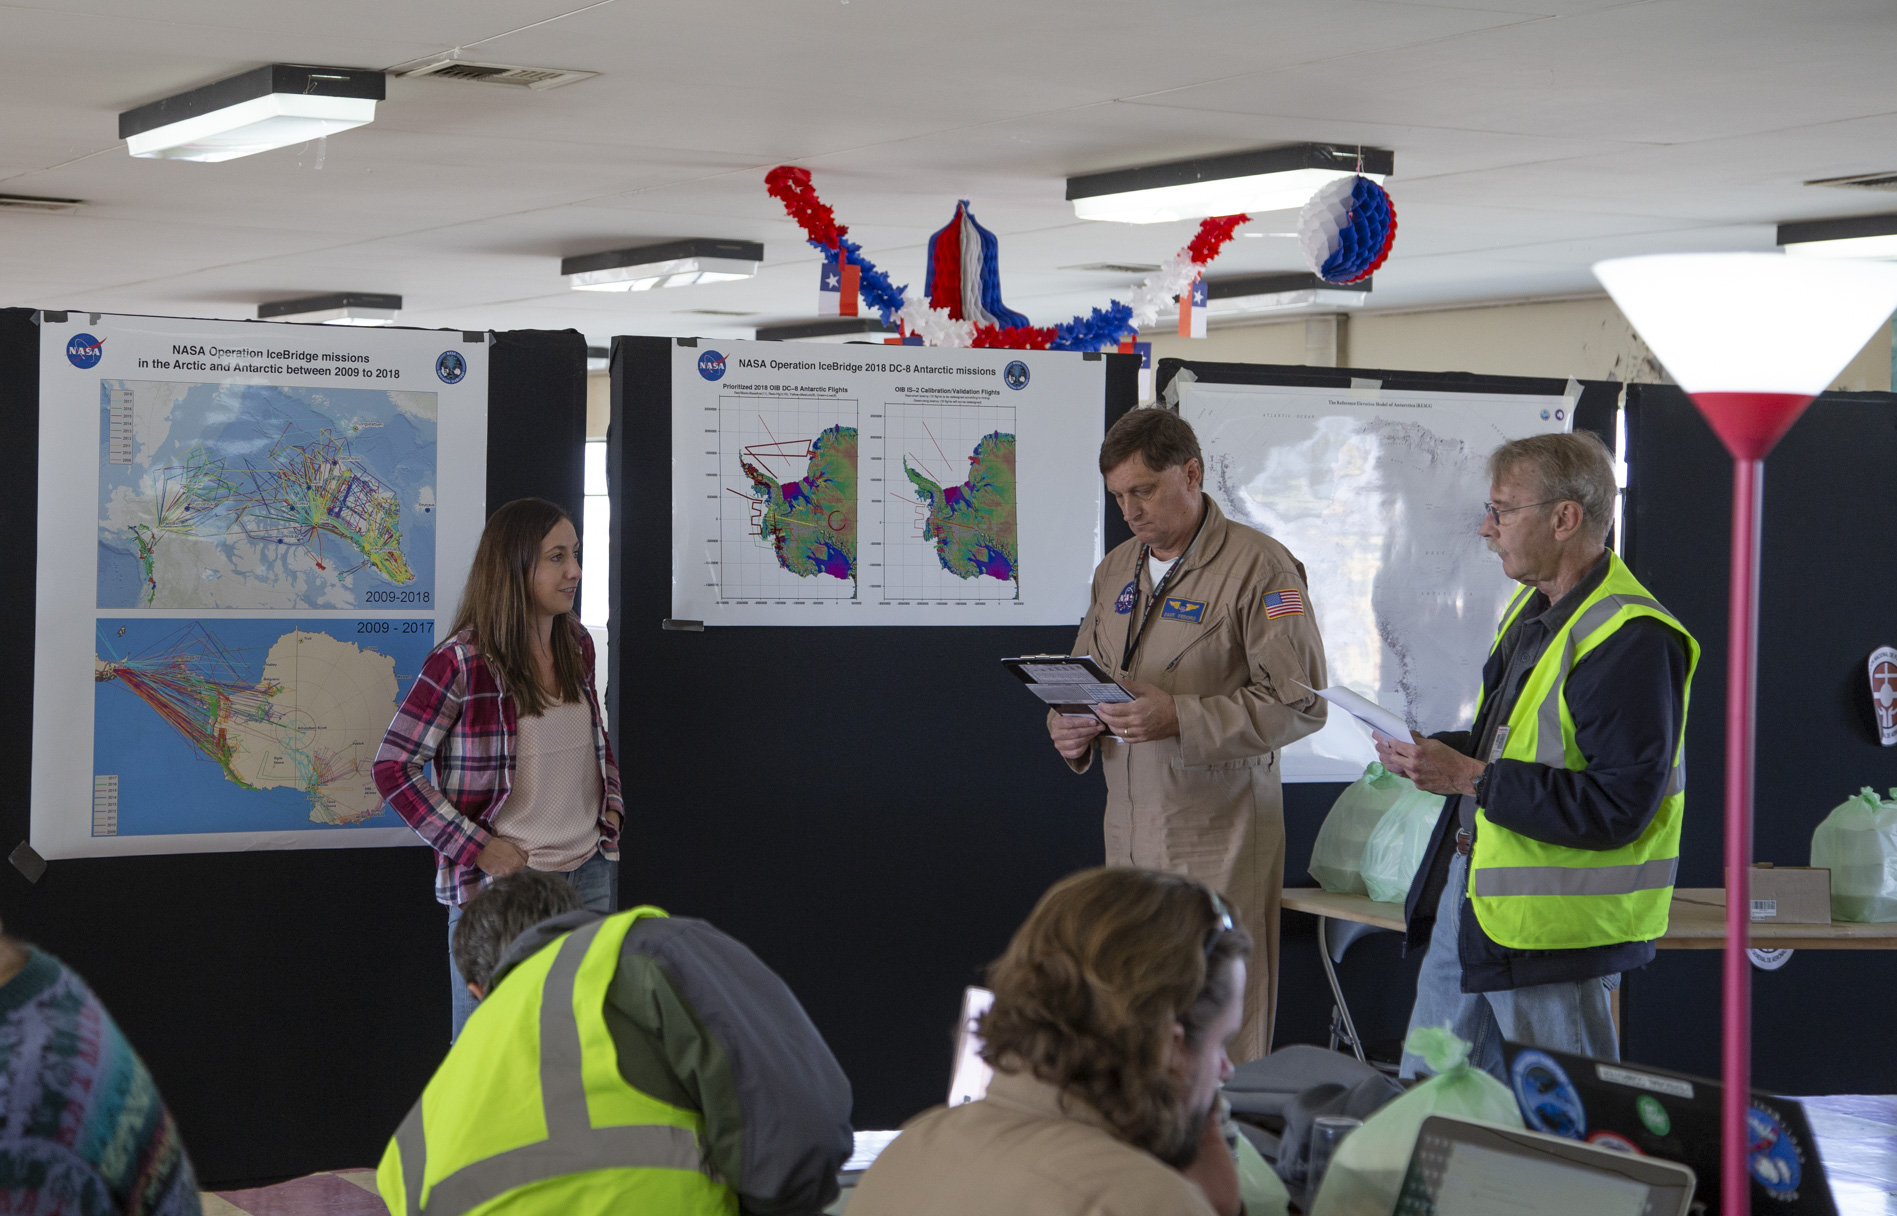
Lynette Boisvert (left) doing an OIB pre-mission briefing on the science objectives with the pilots and instrument team members. Credits: NASA/Jeremy Harbeck

These flights are long (I mean really long) and the days are also long. We have to get to the airport two hours before the flight, and it takes about 25 minutes to get to the airport in Punta Arenas, Chile. Once there, John Sonntag, Eugenia DeMarco, and I go over the satellite imagery available to us as well as some weather forecast models of Antarctica so we can decide which missions are the most viable for maximum data collection during flight.

This is nerve-wracking in two ways: 1) We have limited satellite imagery so the model forecasts don’t always get the weather correct. This is because there are relatively few observations for the models to ingest in Antarctica and the Southern Ocean to include in their forecasts. Basically, the more observations available the better the chance that the models will get the weather forecasts correct. 2) If we make the wrong call and pick a mission where the weather turns out to be different from the forecasts and we are unable to collect good data, we are wasting the project’s valuable flight hour time and money. Let’s just say flying a big plane like the DC-8 is not cheap. So that’s a lot of pressure.

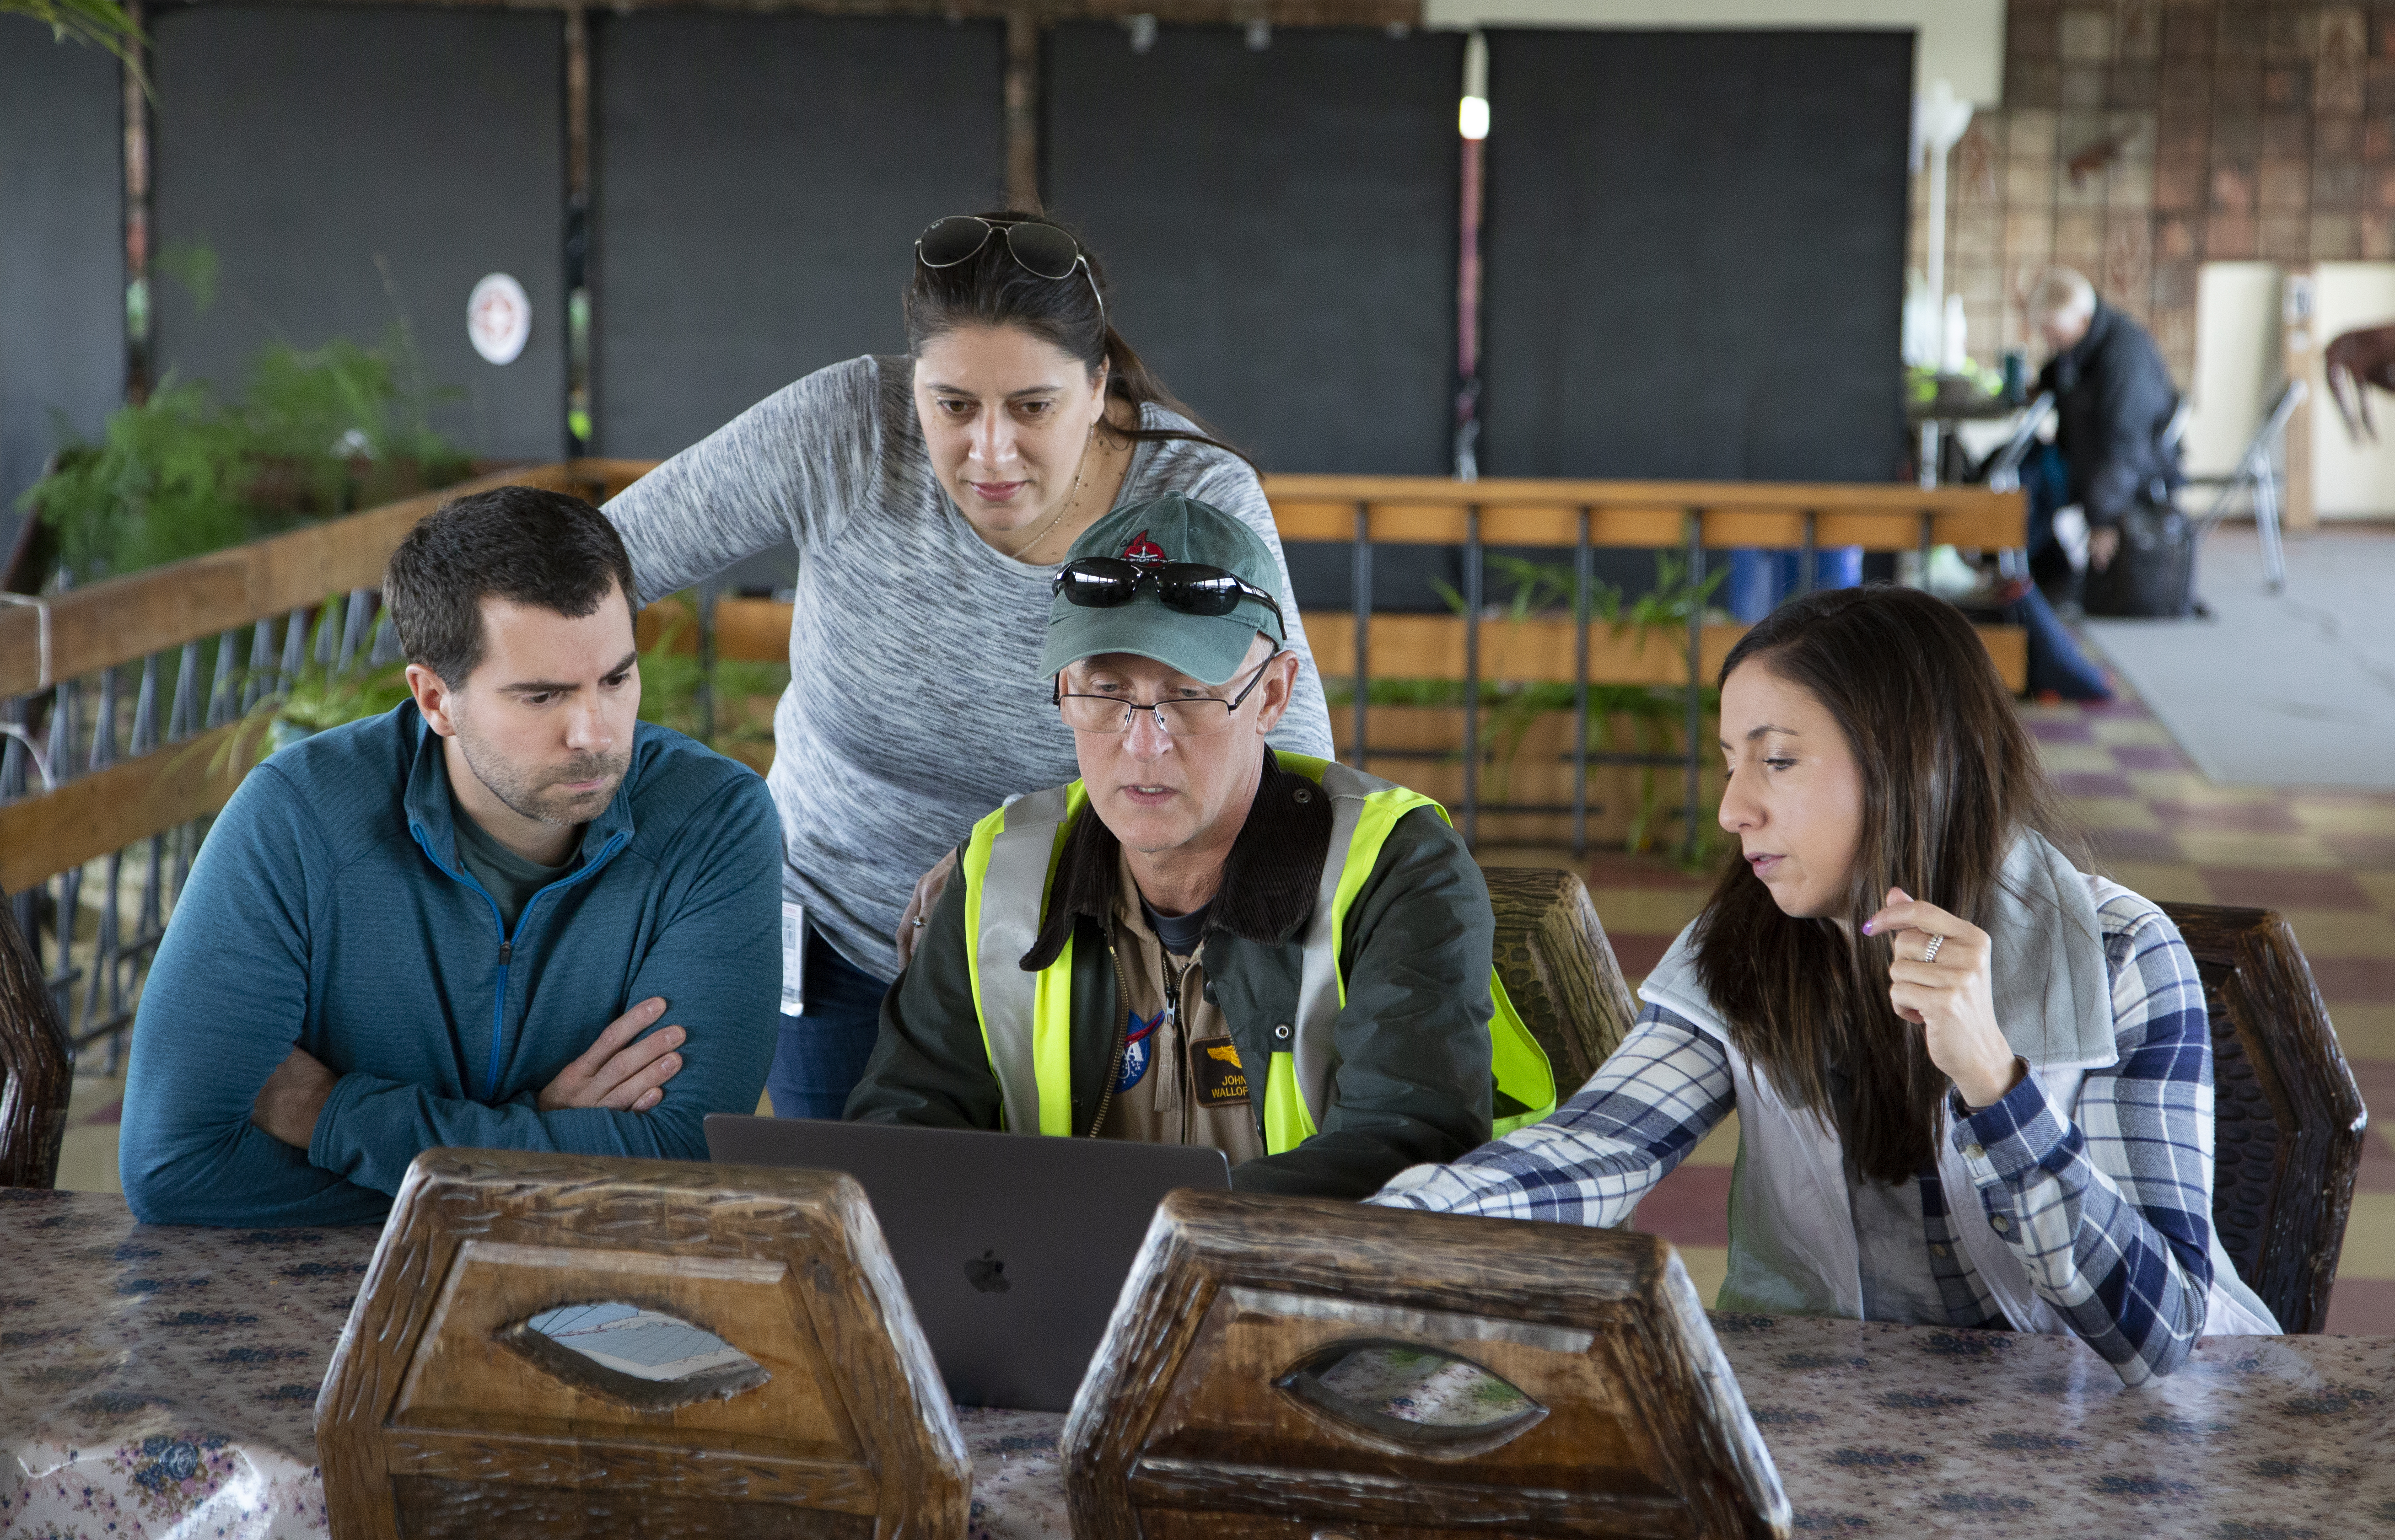
Assessing the forecasts and deciding on a science mission first thing in the morning at Punta Arenas airport from right to left: Joe McGregor, Eugenia DeMarco, John Sonntag and Linette Boisvert. Credits: NASA/Jeremy Harbeck

The reason why our flights are much longer in the Antarctic compared to the Arctic is that the time it takes to get to Antarctica from where we are based, Punta Arenas, is two to hours hours long, meaning that’s how long it takes before we can begin our mission and collect data. About half of our flight time is high-altitude transit. One would think there would be a lot of down time; however, for me this is not the case. I am very big on outreach and giving back by sharing with students of all ages what I do in my job, how I got interested in science, and the science that I do. One of the great things about OIB and NASA airborne science in general is that we have the ability to connect and chat with students in classrooms all over the world during our flights.

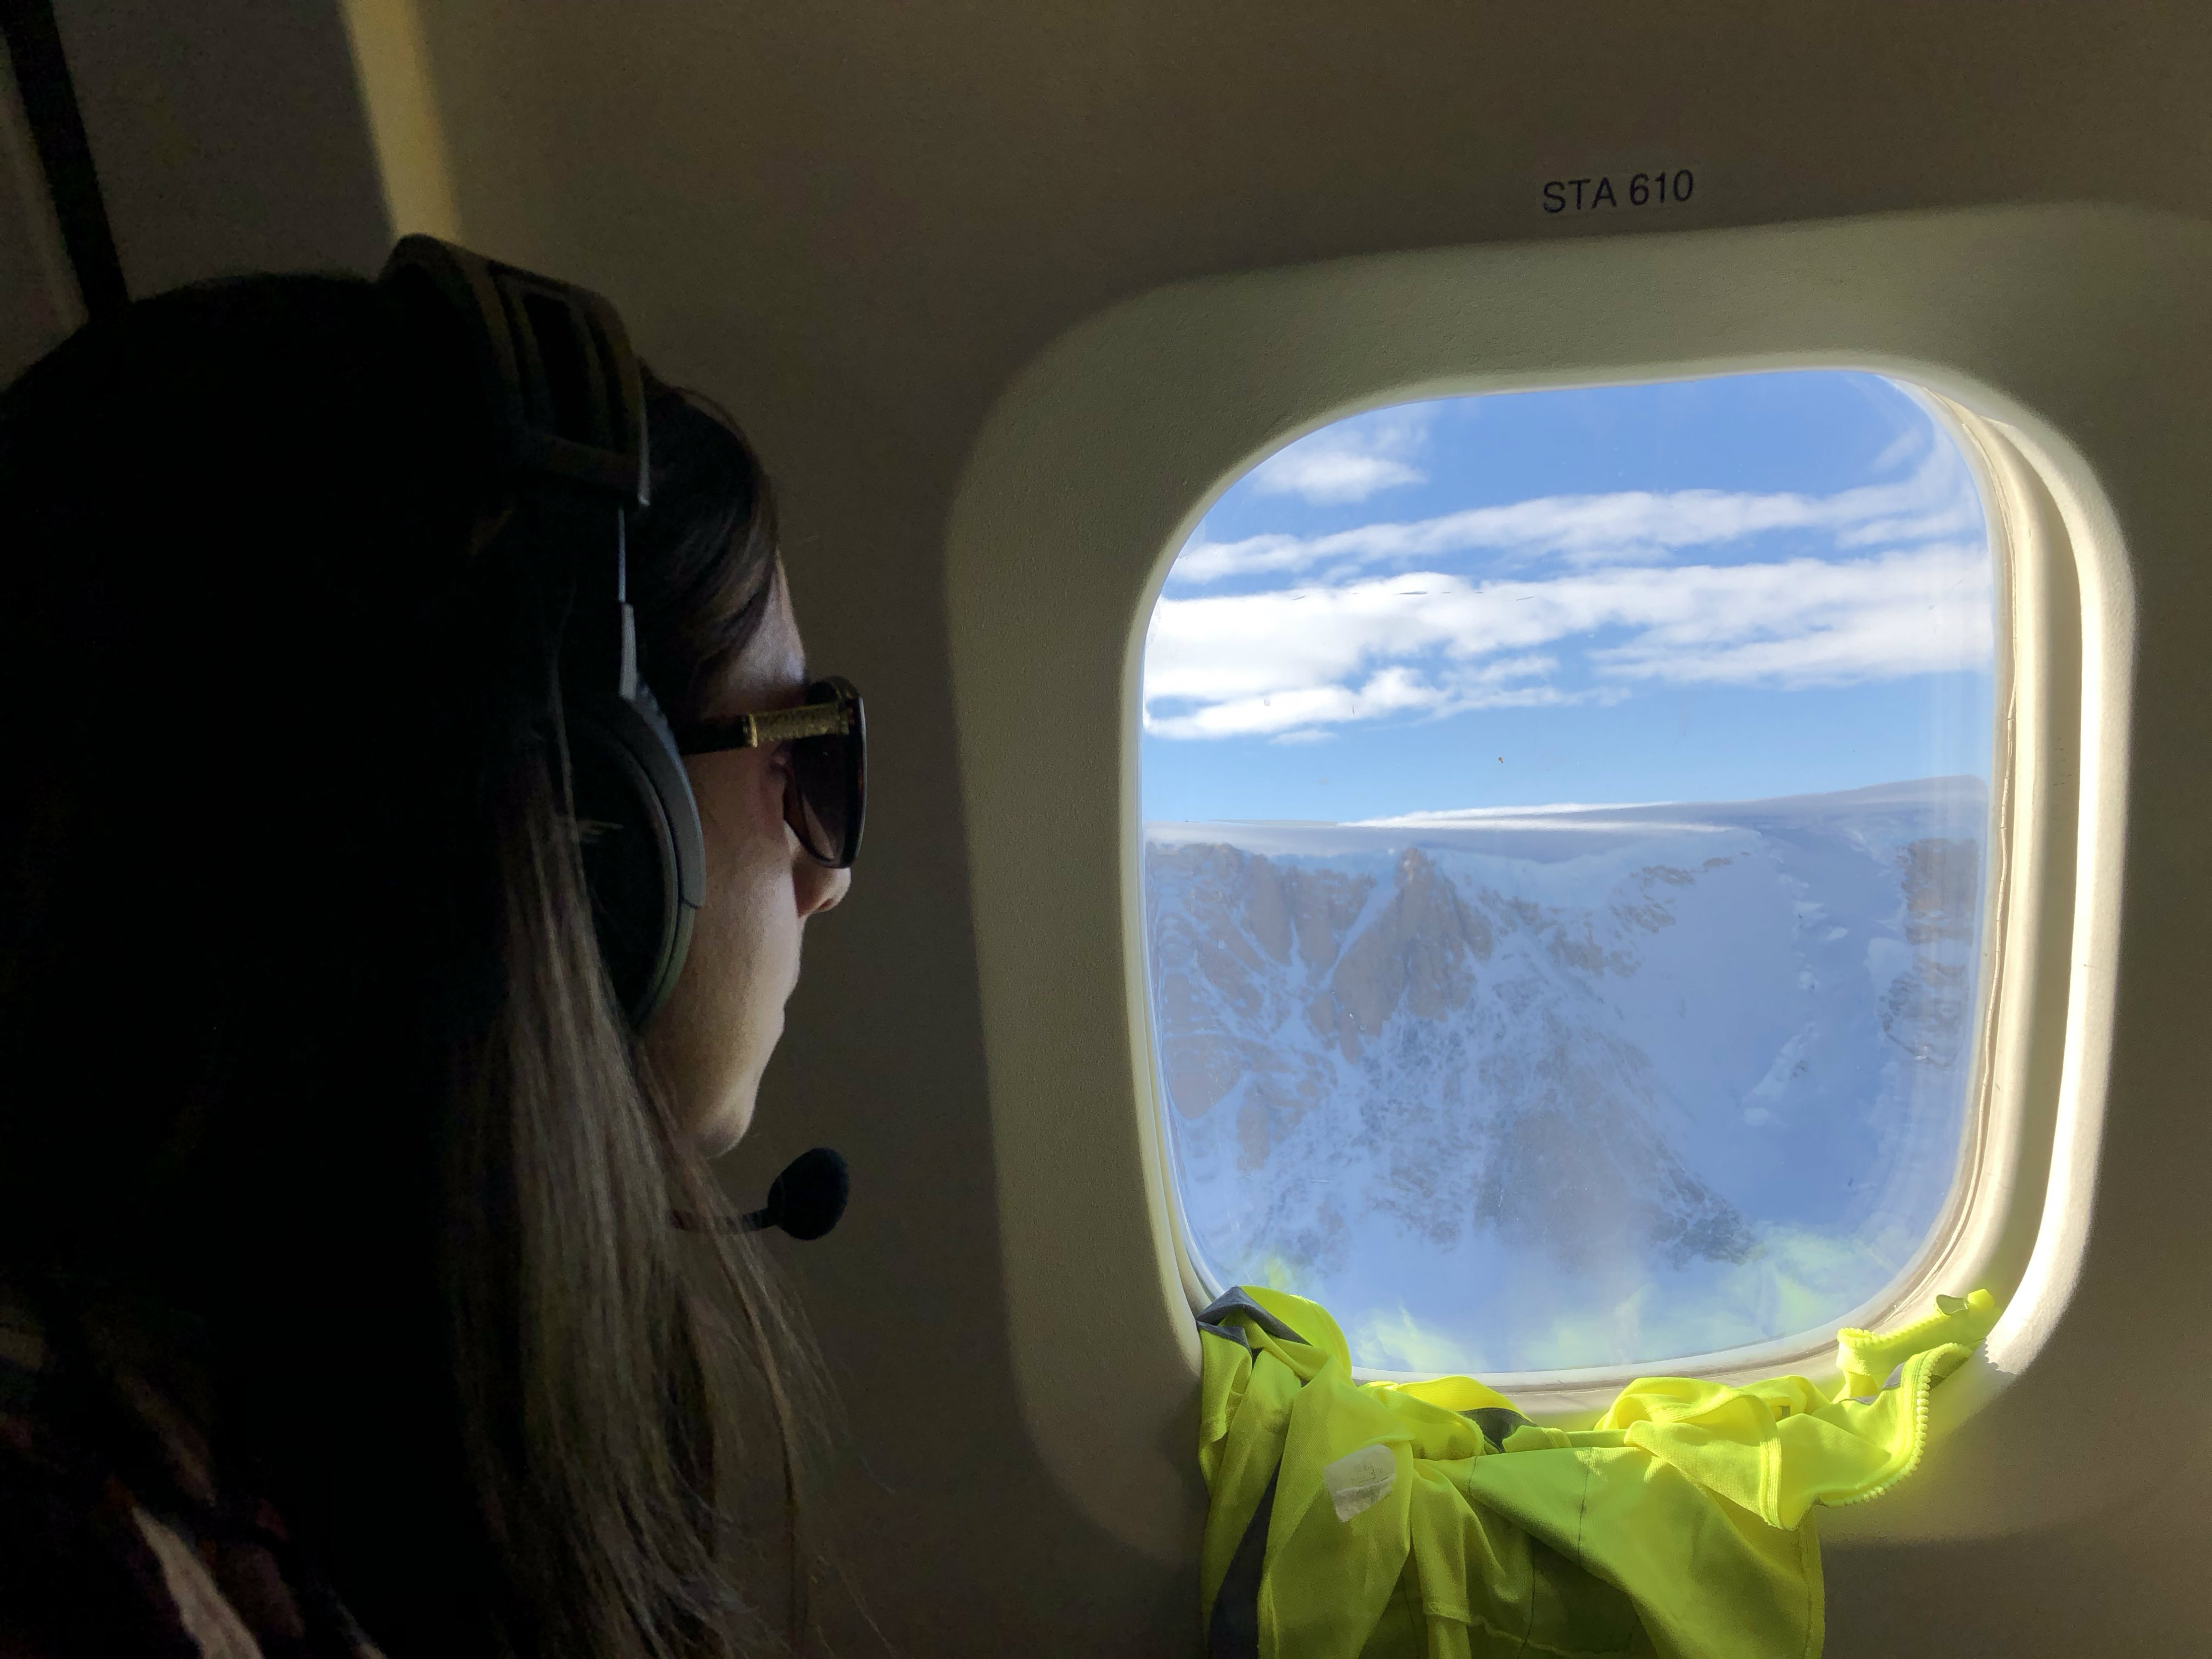
Linette Boisvert looking out of the DC-8 window at mountains of the North Antarctic Peninsula during an IceBridge science mission. Credits: Eugenia DeMarco

So this is how I choose to spend my down time on science flights. Teachers can connect their classrooms with us and ask all types of questions, from climate change to what OIB does, what we studied in school, and what we eat on the plane. I have been partaking in this for a few campaigns now, and the majority of the teachers come back campaign after campaign, connecting with us multiple times.

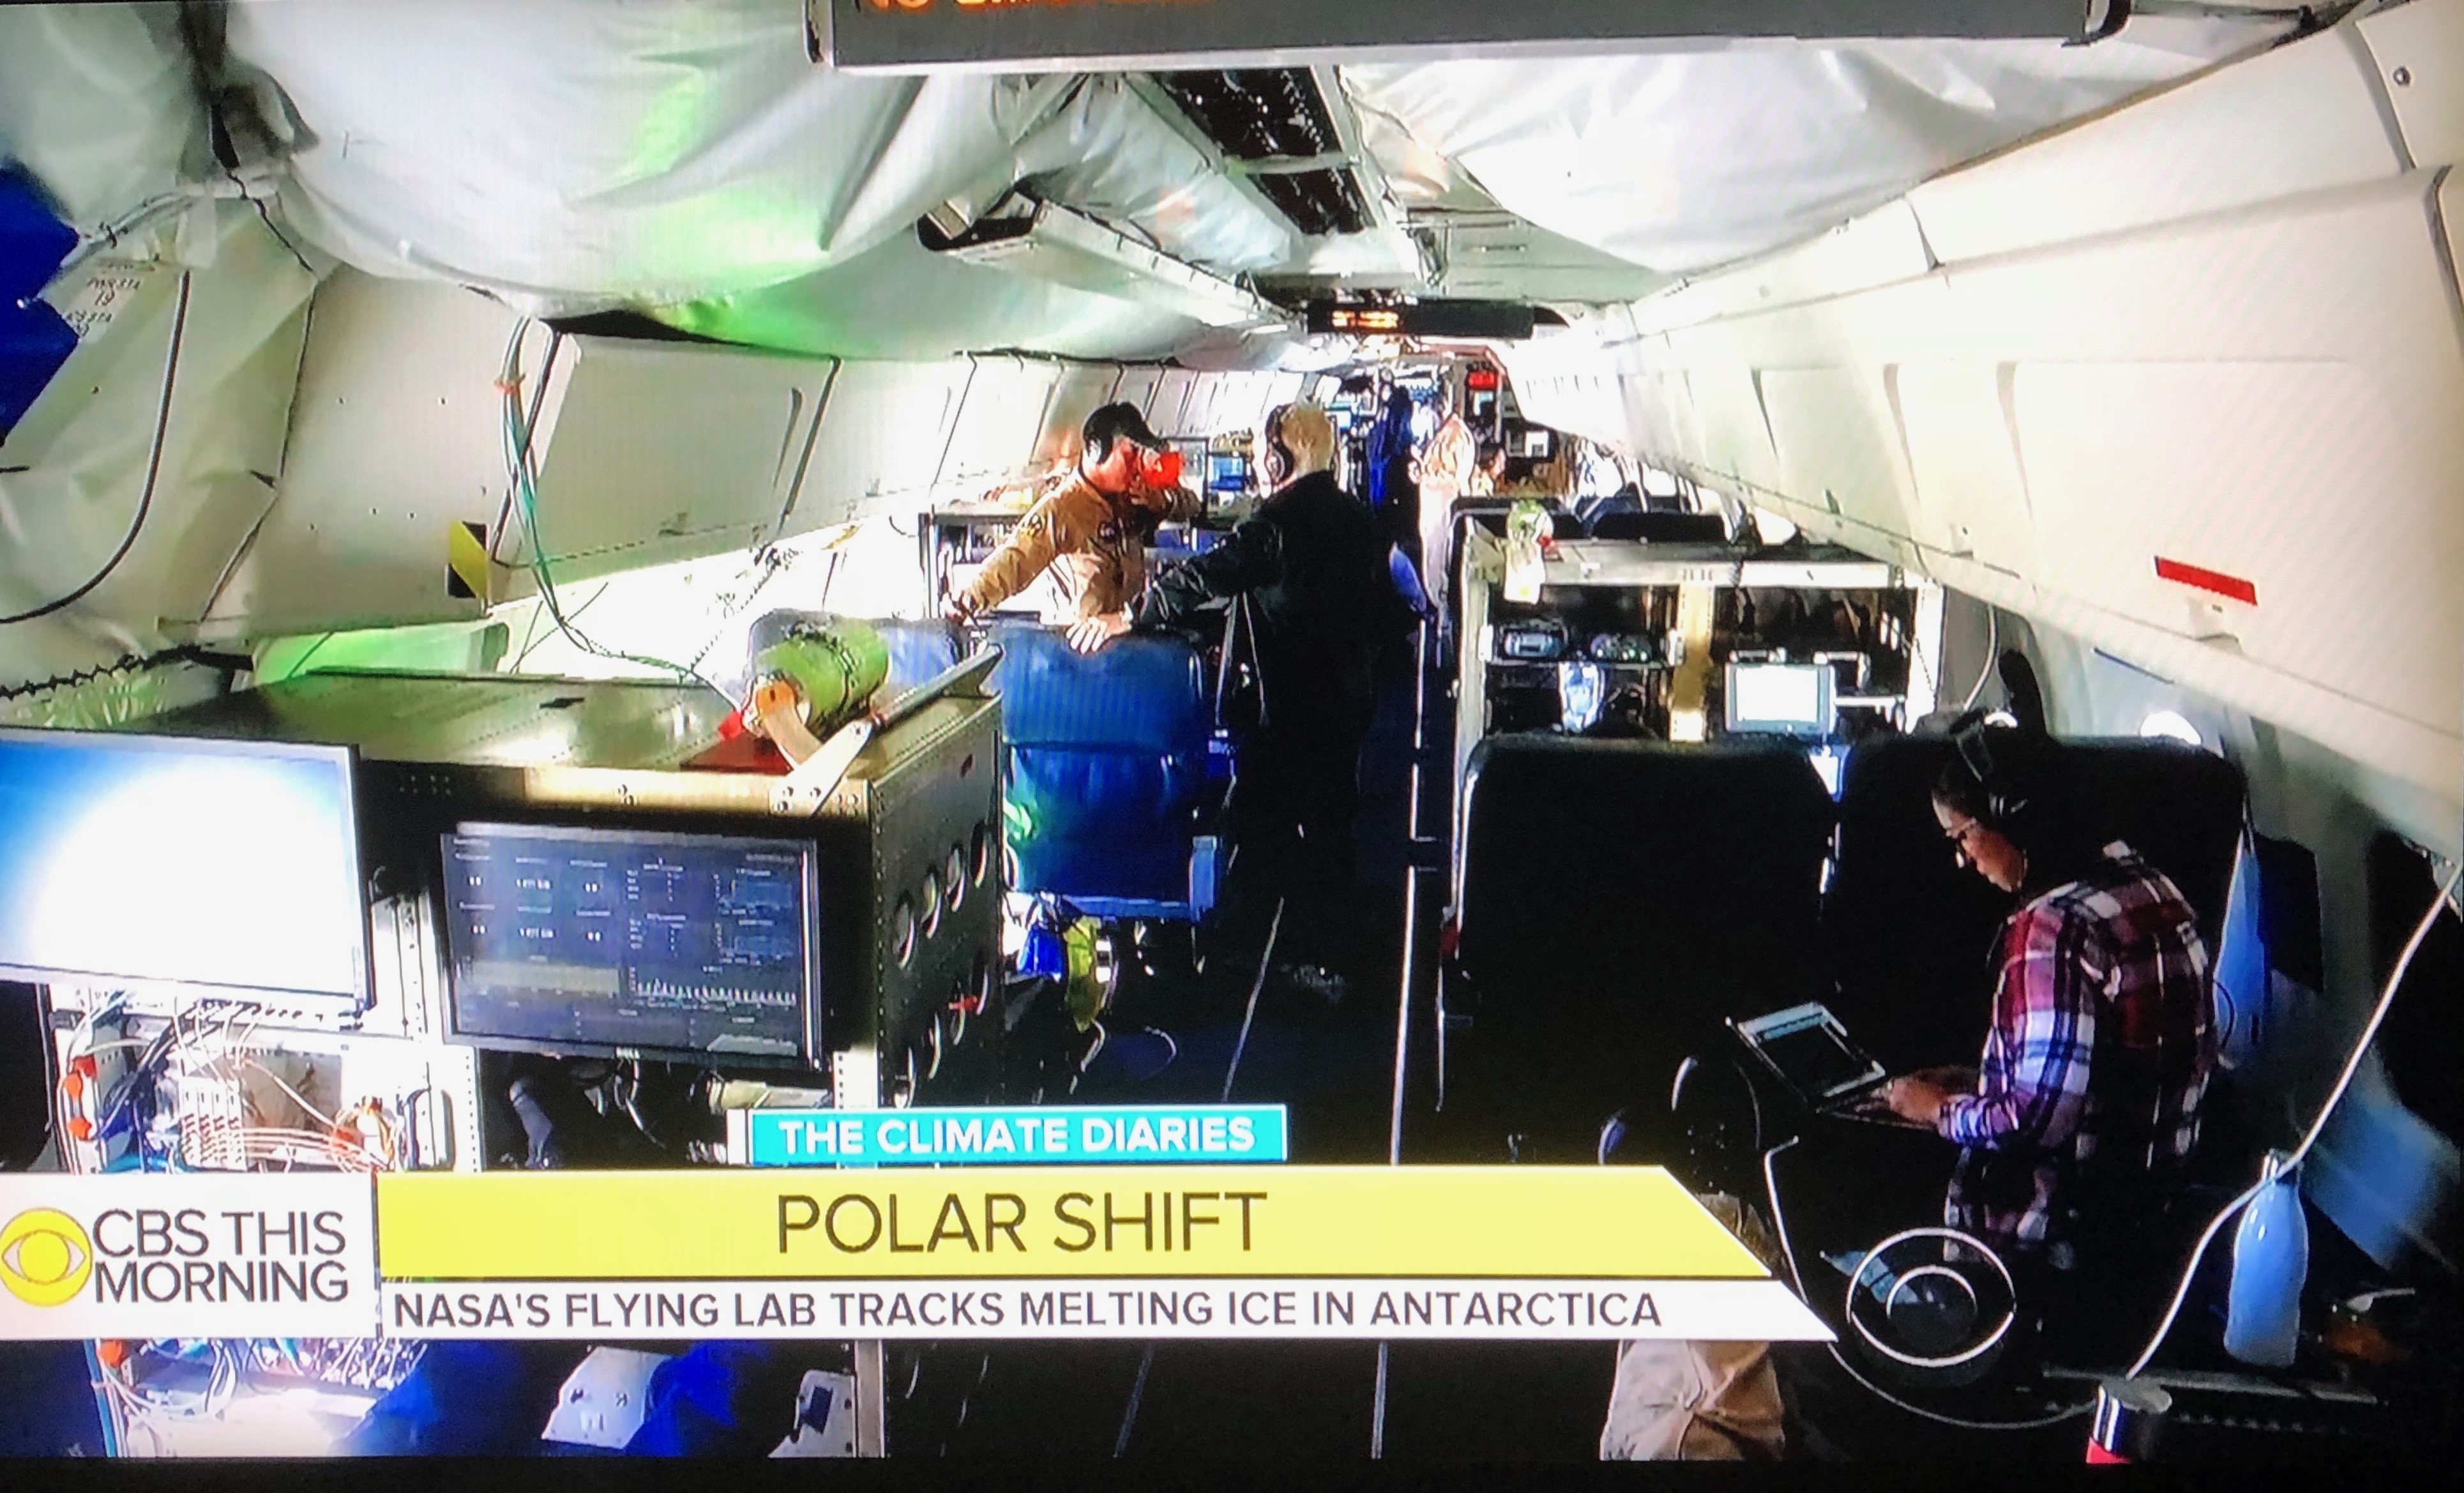
Linette Boisvert (foreground) taking part in a classroom chat during a science mission. This image was taken from a clip that was shown on CBS Evening News. Credits: NASA/Linette Boisvert

One of these teachers is Marci Ward, who teaches third grade in Fairbanks, Alaska, and is fascinated with airborne science and is dedicated and enthusiastic about exposing her students to all types of science. Last spring, when we were stationed in Fairbanks for our Beaufort sea ice flights, I had the opportunity to go to her classroom and talk to her students in person about OIB on one of our down days. Shortly thereafter, I was able to connect with her students again on the plane chat the following week. They were so excited to meet me in person and to chat with me on the plane, it really made me feel good about what I was doing and that I was making a difference (aka giving me the warm and fuzzies inside).

Linette Boisvert talking to Marci Ward’s third grade class in Fairbanks, Alaska, about sea ice and IceBridge in March 2018 during the Arctic spring campaign. Credits: NASA/Emily Schaller

It is very humbling to know that you can have such an impact on students and hopefully inspire and motivate them to pursue a career in science, math, or whatever subject they are passionate about. And it is even better when we receive feedback from the students and teachers, such as Janell Miller, a middle school teacher located in a high-poverty area of central California. “Believe me, your outreach matters to students,” she said. “It brings in a whole world they would not have been able to access first hand. The IceBridge project—speaking with scientists and engineers—this has a lasting impact. I’ve had former students who participated in this chat years ago, when I taught elementary school, write that this was one of their best school memories in their senior papers.”

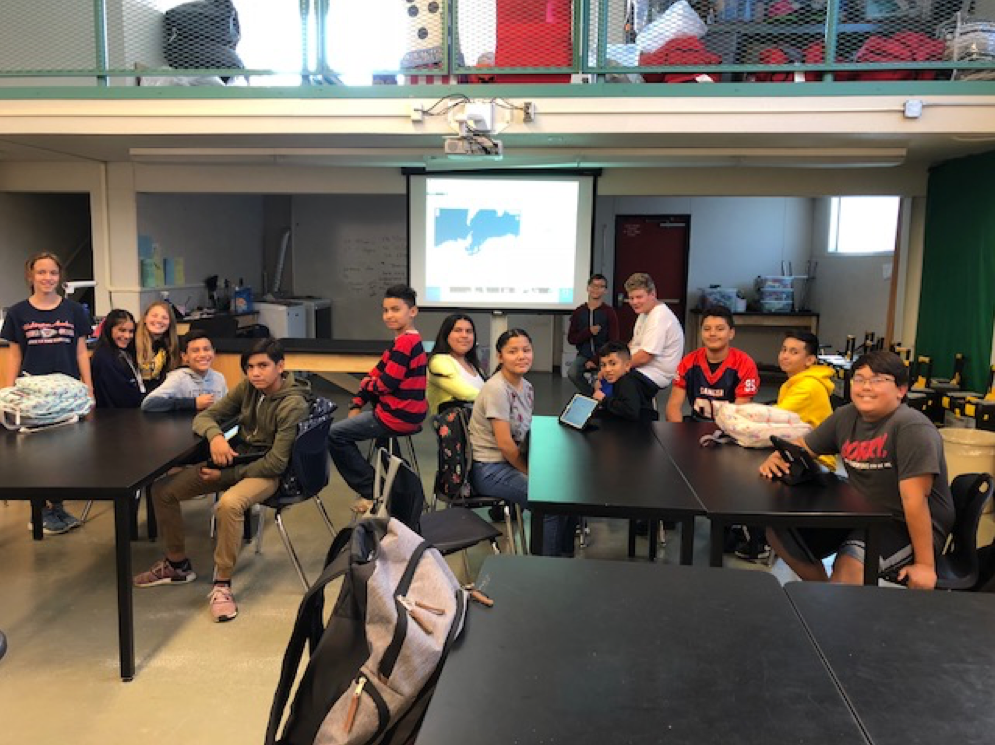
Seventh and eighth graders at Washington Academic Middle School in Sanger, California, connected live to the NASA IceBridge team aboard the DC-8. Credits: NASA/Emily Schaller

After 12 hours in the air today, we arrive back in Punta Arenas and make it back to our hotel anywhere from one to two hours after we land. The days can be exhausting, and we know that we will be doing this all again tomorrow. But I also know that along with collecting all of this extremely valuable data of Antarctic ice, I and other scientists and engineers aboard also make an impact on students all over the world. Personally, I find it even more important for me to be continually proactive in the student chats because I hope to encourage and inspire young female students to be interested and pursue careers in math and science, areas where we are currently underrepresented and crucially needed.

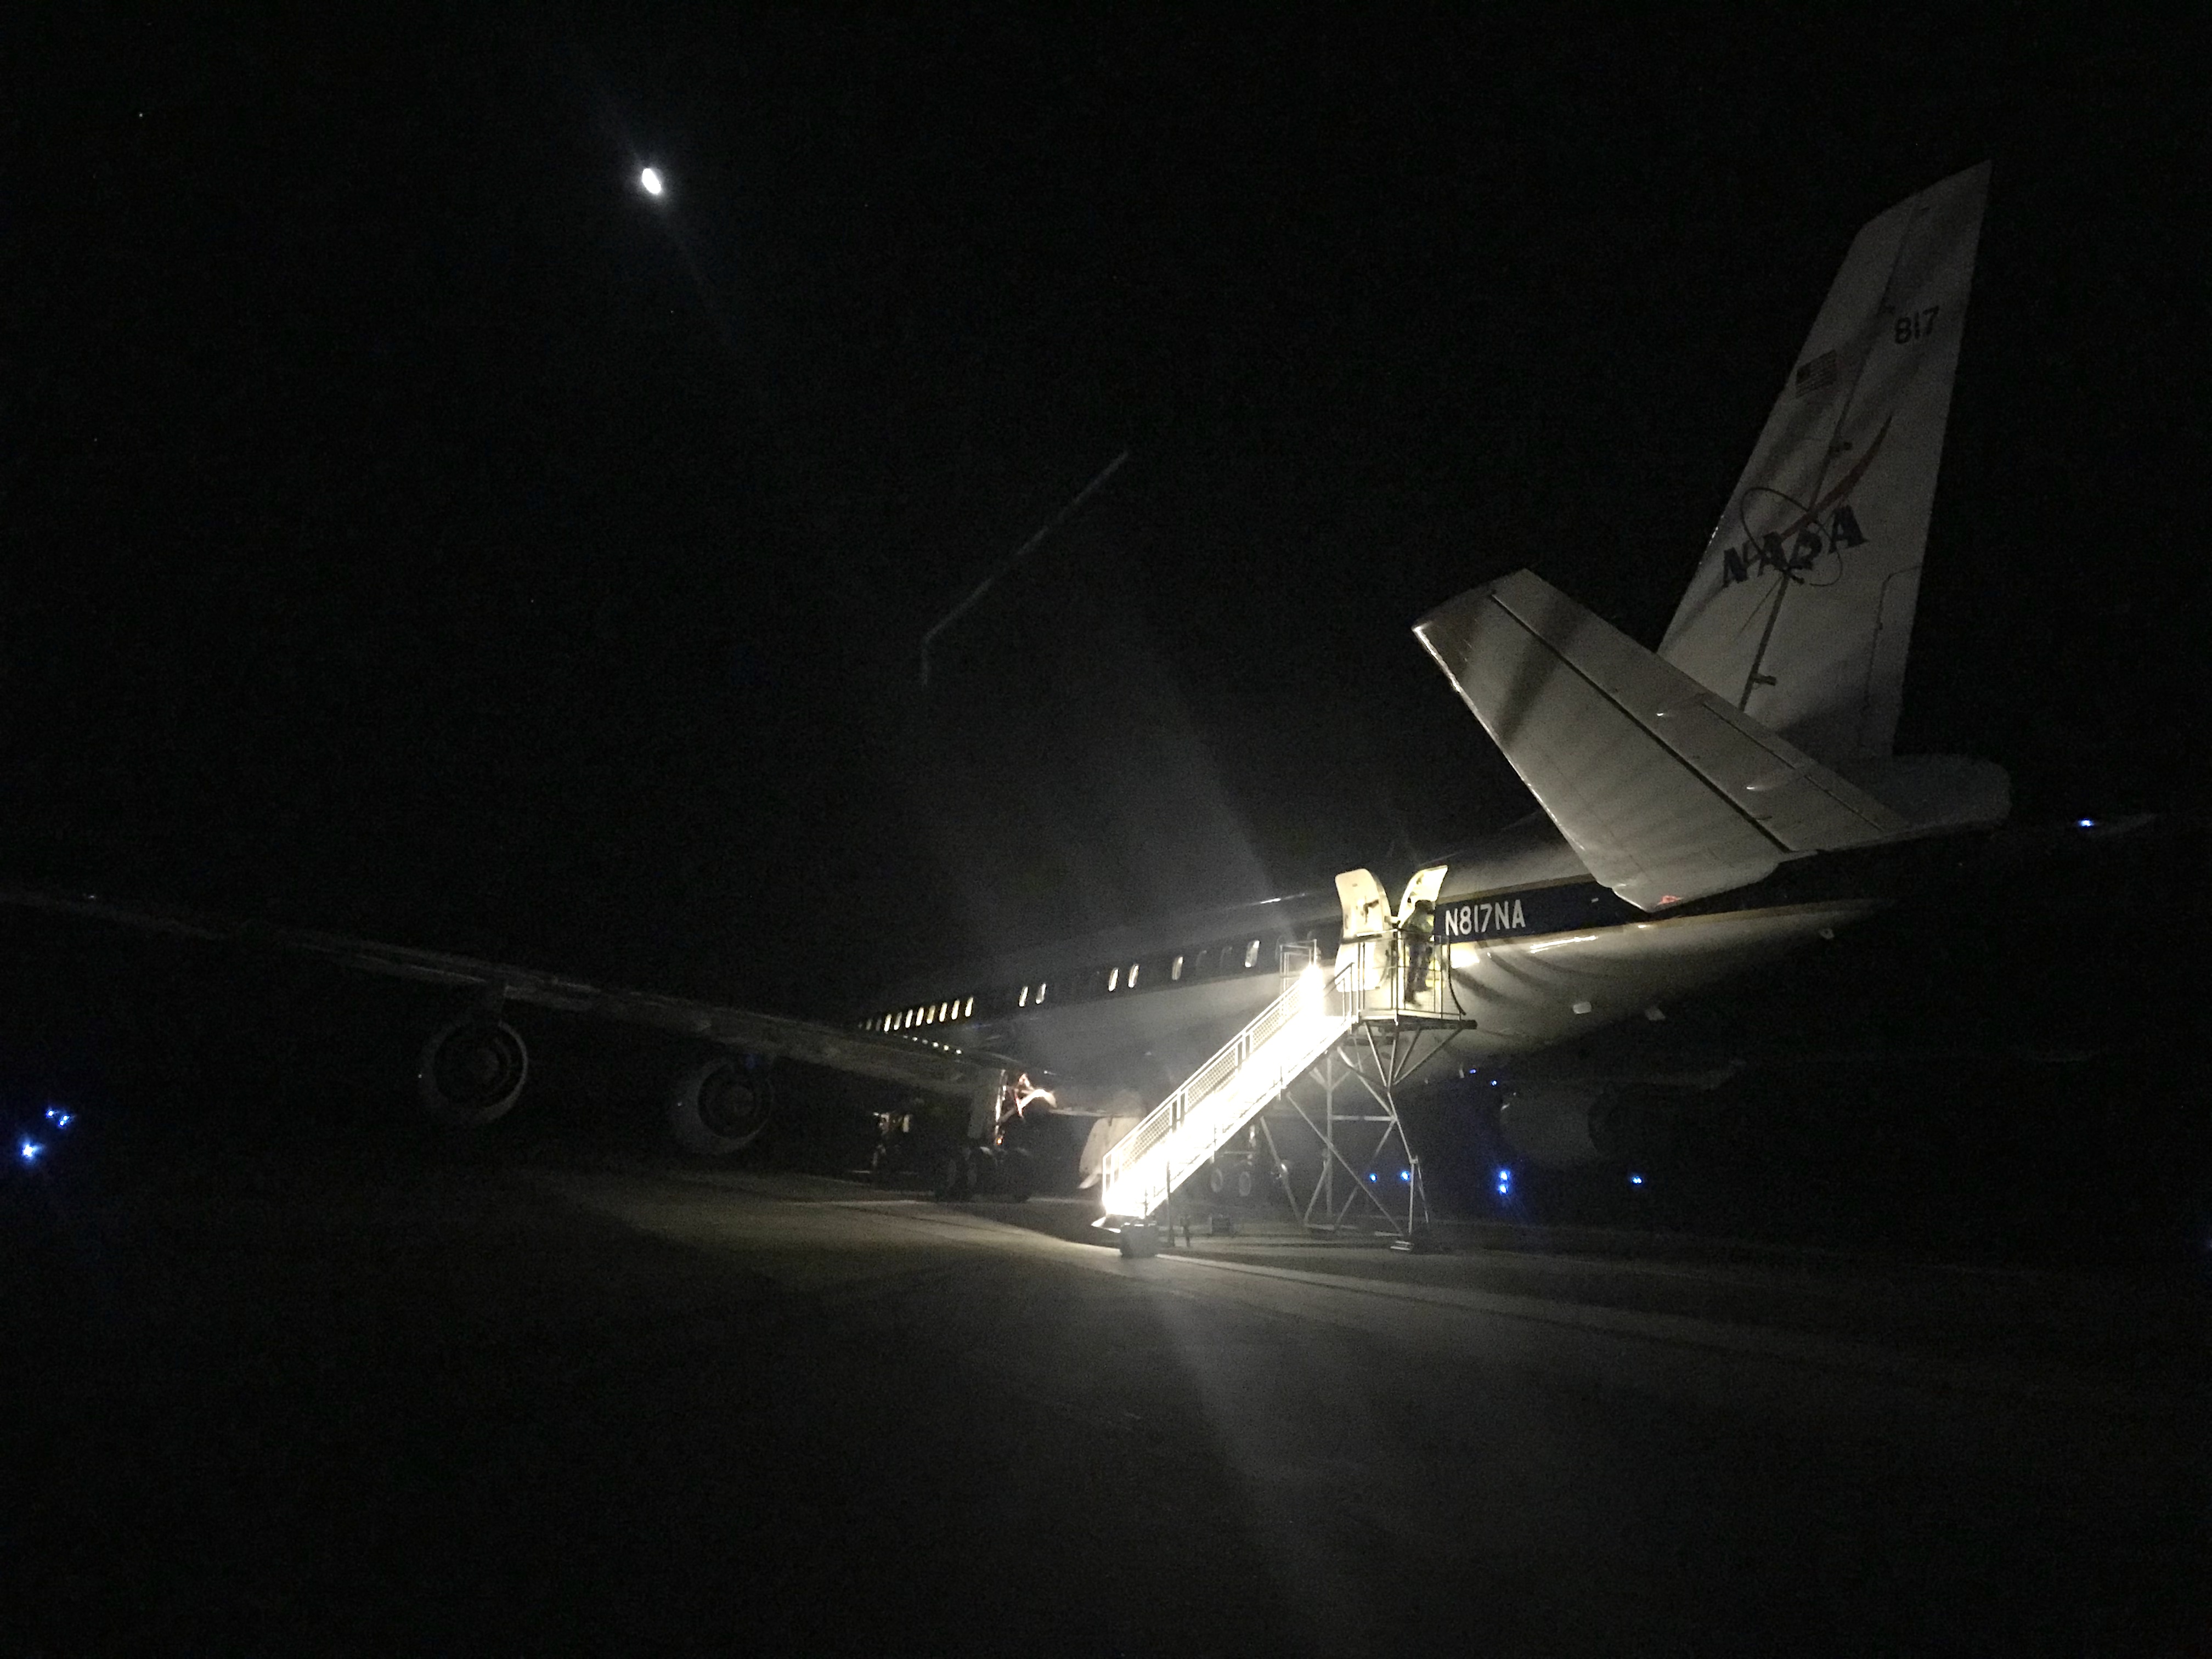
The NASA DC-8 plane arriving back at the Punta Arenas airport after a 12-hour science mission. Credits: NASA/Linette Boisvert

A New Deputy Gearing up for a New Deployment

Linette Boisvert, deputy project scientist for Operation IceBridge, “hanging out” in the belly of NASA’s DC-8 flying laboratory. Credits: Linette Boisvert

Hi all, you may remember me, Linette Boisvert, from previous blogs such as “Team Sea Ice or Team Land Ice?” and “Sick Sacks for Science,” where I gave a visiting scientist’s perspective on test flights for NASA’s Operation IceBridge Arctic Spring campaign. Well now I am back, but this time as the deputy project scientist for IceBridge. Yes, a lot has changed since my last blog.

The location of Punta Arenas, Chile. Credits: Google Maps

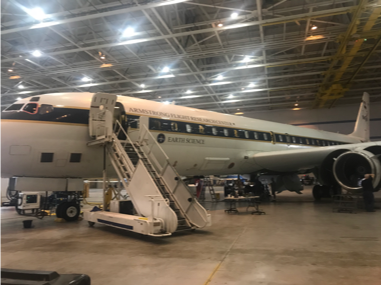
Beginning the second week of October, I will be flying down to Punta Arenas, Chile, (basically the other end of the Earth!) on NASA’s DC-8 flying laboratory to help lead IceBridge’s Antarctic Fall campaign. As I have never been to Chile, seen Antarctic sea ice in person (this is kind of a big deal), or flown on the DC-8 or met the crew, I took a short trip to NASA’s Armstrong Flight Research Center located in the California desert town of Palmdale, where the DC-8 is based.

Once on center, I entered the massive hangar that houses multiple planes. This hangar was originally used to make B-52 bombers before it was acquired by NASA, and it is so massive that scenes from Pirates of the Caribbean were even filmed inside. (They had to bring in a very large pool.) But there it was, dwarfed by the large hangar: the DC-8. It will be my mobile “office” for the month of October, when we’ll do 12-hour flights from Punta Arenas, flying over the Antarctic sea ice and land ice and back again, taking measurements with lasers and radars. We do this every fall to monitor changes in the ice thickness.

The hangar at NASA’s Armstrong Flight Research Center, with the DC-8 in the background. Credits: Linette Boisvert
NASA’s DC-8 flying laboratory. Credits: Linette Boisvert
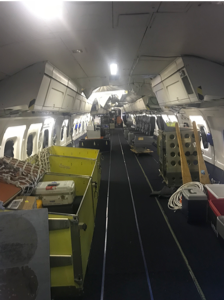
A mostly empty DC-8 interior. Credits: Linette Boisvert

Now, this plane is a whole different beast than the NASA P-3 that I am accustomed to. It can seat up to 44 people with instruments aboard, compared to the 20 people that the P-3 can carry. The DC-8 has first class seats that recline and also has THREE bathrooms, and they’re like commercial airline bathrooms and not like composting toilets—what luxury! But when I first stepped onto the plane, it was basically empty. Seats were scattered around, there were containers about. I thought: “Are we really going to be able to fly this in a few weeks?” You see, I had arrived at the beginning of what we can “install,” and clearly there was a lot of work to be done. So naturally I was ready to lend a hand in any way that I could.

The desert around Palmdale and some Joshua trees. Credits: Linette Boisvert

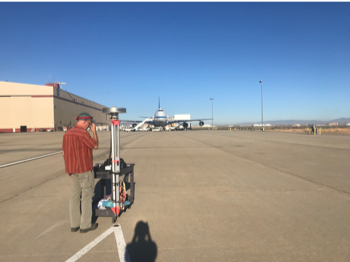
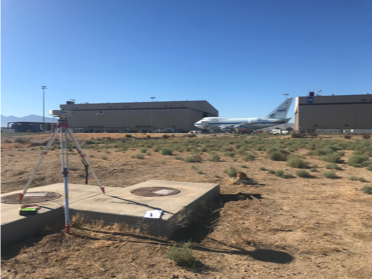
My first task was to help Mission Scientist John Sonntag, “The man, the myth, the legend” (as he is often called), with a ground Global Positioning System (GPS) survey. This basically means we would spend hours outside in the desert heat and sun, looking a little silly, pushing a cart around with a GPS antennae attached. We would be doing this at multiple specific locations around the parking lot and the runway. Now you might be wondering why we are torturing ourselves. For science and the mission of course! We need highly accurate GPS locations of easy-to-spot points from digital imagery so that we can geolocate our digital imagery and calibrate our camera during the test flights. Our instruments need to be calibrated so we can know the exact locations of our data when we fly and take measurements.

Our GPS ground survey antennae and cart just after sunrise. Credits: Linette Boisvert

So now that is cleared up you might be wondering, okay, why do you have this antennae jerry rigged to this cart? I learned that GPS antennas are finicky, and the antennae need to be pointed unobstructed to the sky to receive signals from the multiple satellites orbiting overhead. Thus, it cannot be blocked by anything from above, such as your head, lampposts, or trees because if any contact with the satellites is lost during the survey, it would have to be done all over again. The other option would be to carry this around with the antennae above your head the whole time, so having the choice, I think I will take the cart.

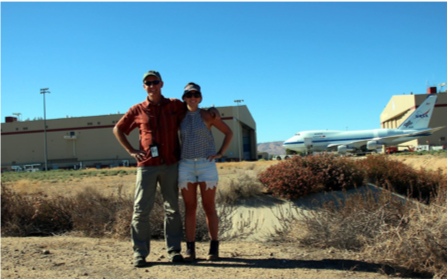
GPS ground survey on the runway with John Sonntag. NASA’s SOFIA plane is in the background. Credits: Linette Boisvert
GPS ground survey in the dessert brush. NASA SOFIA plane in the background. Credits: Linette Boisvert
GPS ground survey team John Sonntag and Linette Boisvert. Credits: John Sonntag

Well, it turns out we had to eventually abandon the cart, because some of our survey points were located in the desert brush, and our little cart was not made for off-roading. We tried. As we were trudging through the desert carrying the antennae above our heads, John told me all about rattlesnakes and what I should be on the lookout for. Great, with my luck we would come upon one. But alas, we didn’t run into any of our reptilian friends and were able to complete our surveys, albeit a bit parched, sunburnt, and sweaty.

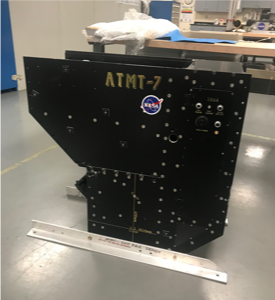
Now while we were surveying in the desert, the Airborne Topographic Mapper (ATM) team, the “Dream Team,” as I call them, were hard at work in the hangar installing their GPS ground station ATM T-6 and T-7 lasers

The ATM T-7 laser. Credits: Linette Boisvert

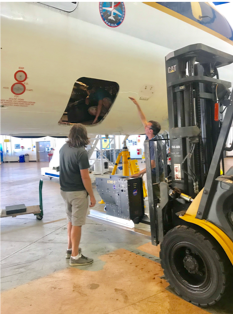
onto the belly of the DC-8, as well as their racks, which hold all of their computers and servers on the interior. They worked diligently for four long days, and at the end of the fourth day, they were finally ready to install ATM T-7. This baby weighs about 200 lbs and to me looked to be too big to fit into the door in the belly of the plane, so I knew I had to witness this!


The laser was wheeled out to the plane, where it was then put onto a forklift, lifted up, and gingerly slid into the belly of the plane. It was a tight fit, and I was nervous to say the least, but it all worked out in the end. Phew! Next week the radar instrument teams will begin their install.

The ATM T-7 installation into the belly of the DC-8. Credits: Linette Boisvert

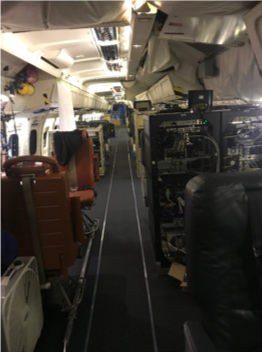
Before I left on my last day, I took a few quiet moments in the DC-8. Compared to when I arrived, the plane looked almost put together. I was in shock with how quickly and seamlessly the crew and the ATM team worked together. The seats were nearly all set up, and the ATM and navigation racks were installed. I felt a sigh of relief knowing that I would be working with a group of scientists and engineers who worked hard, and that no matter what unexpected issues or problems arose on this upcoming campaign, we would all be able to work together to fix the problem and continue to collect valuable science data of the Antarctic ice. Lets just say I couldn’t be more proud and honored to be a part of this IceBridge team.

A nearly completely installed DC-8 plane. Credits: Linette Boisvert

I also want to note that I am also very content to not be partaking in the DC-8 test flights next week over the desert, where they can be very turbulent, because I am not looking forward to having to test out any more “sick sacks.”

Operation IceBridge Test Flights Part 2: From ‘Sick Sacks’ to Cloud Nine

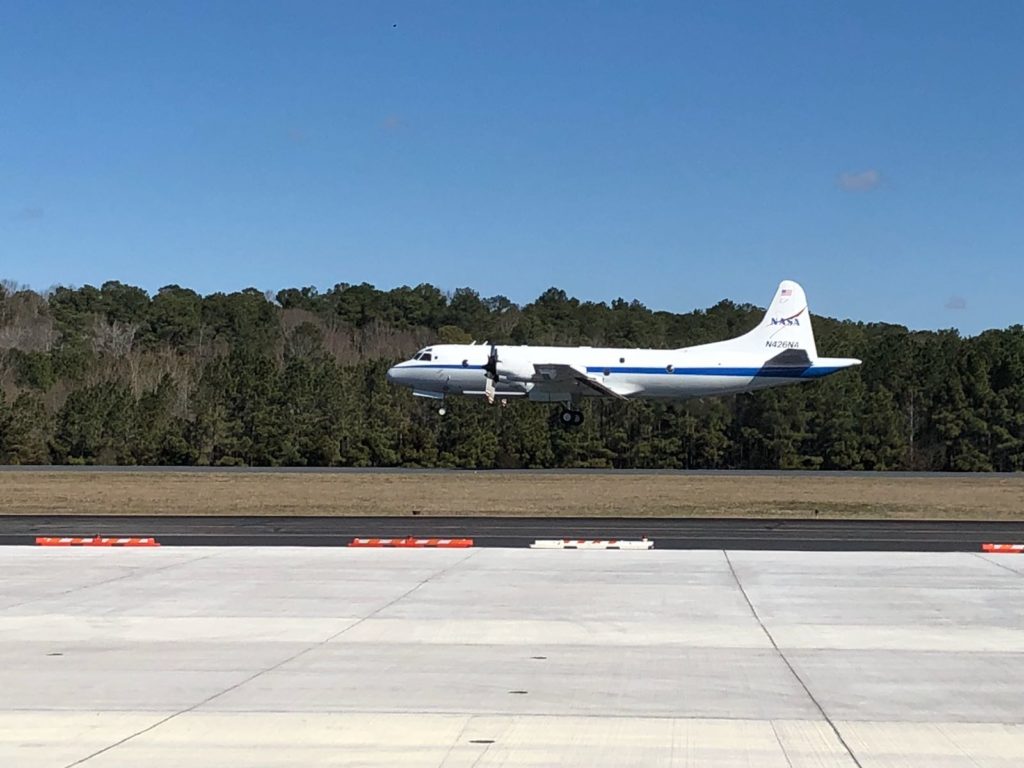
NASA’s P-3 Orion research aircraft landing back at NASA Wallops Flight Facility. Credit: NASA/Aaron Wells

by Linette Boisvert / NASA WALLOPS FLIGHT FACILITY, VIRGINIA /

Linette Boisvert is a sea ice scientist at NASA’s Goddard Space Flight Center in Greenbelt, Maryland, and researcher with Operation IceBridge. The mission of Operation IceBridge, NASA’s longest-running airborne mission to monitor polar ice, is to collect data on changing polar land and sea ice and maintain continuity of measurements between ICESat missions. This blog describes test flight activities before the mission’s spring Arctic ice survey, which began on March 22 and will be ongoing through most of April.

For more about Operation IceBridge and to follow future campaigns, visit: http://www.nasa.gov/icebridge

Thursday, March 15, 2018

I woke up not as optimistic as the morning before. With the previous flight’s turbulence and motion sickness, I was not looking forward to some of the maneuvers that we were going to do. But I reluctantly went back to Wallops and got back on NASA’s P-3 Orion research aircraft. The plane was a lot less crowded for the radar test flights. A few of my friends poked fun at my vomiting on the previous flight, and I jabbed back, saying, “Take a cookie, they taste just as good going down as they do coming back up.” Yes, I still had cookies to dole out. After this, I immediately went to the cockpit to apologize to the pilots and flight engineer for puking where they work.

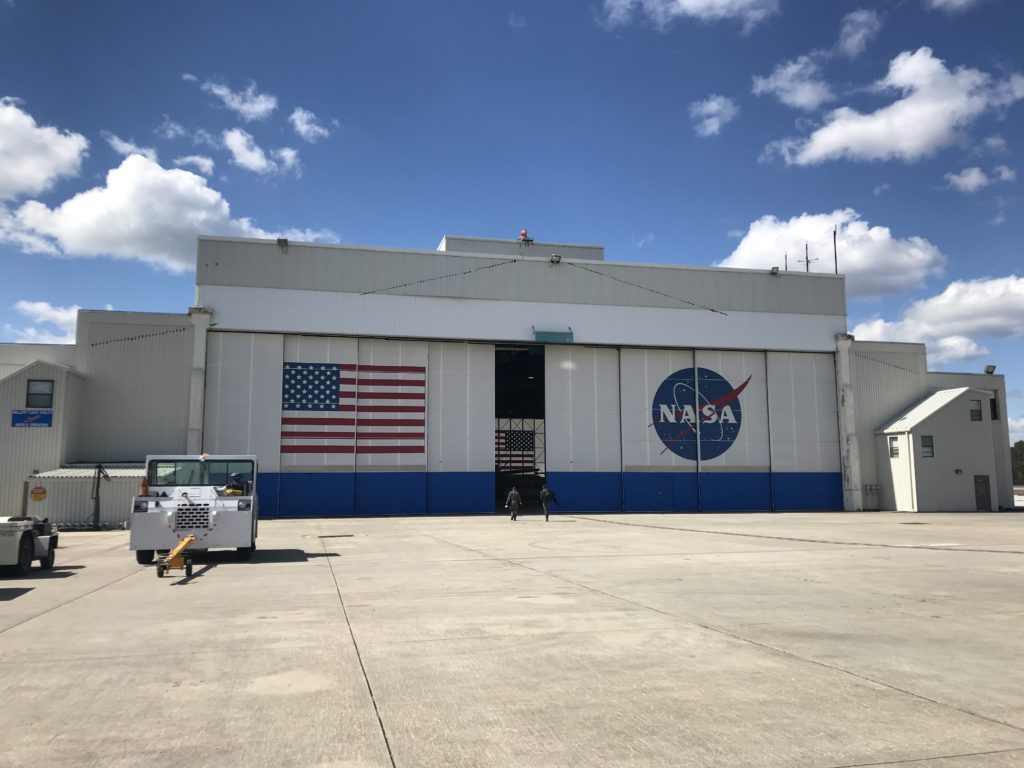
The P-3 Orion hanger at NASA Wallops Flight Facility. Credit: NASA/Linette Boisvert

This flight was to test the Center for Remote Sensing of Ice Sheets (CReSIS) radar. The CReSIS radar on OIB is used to determine the thickness of the snow pack on top of the sea ice and the different accumulated layers of snow on the Greenland Ice Sheet. The flight would be six hours in duration and would fly south to Norfolk, Virginia, then turn due east and head 200 miles out to sea to do the maneuvers that were required by the radar teams. These maneuvers consisted of slow rolls, quick, 60-degree rolls at 1 degree per second, and elevation-change maneuvers (ups and downs). Those aboard assured me that this flight would be much smoother due to the higher altitude (~20,000 feet) and the fact that we would be flying over the ocean.

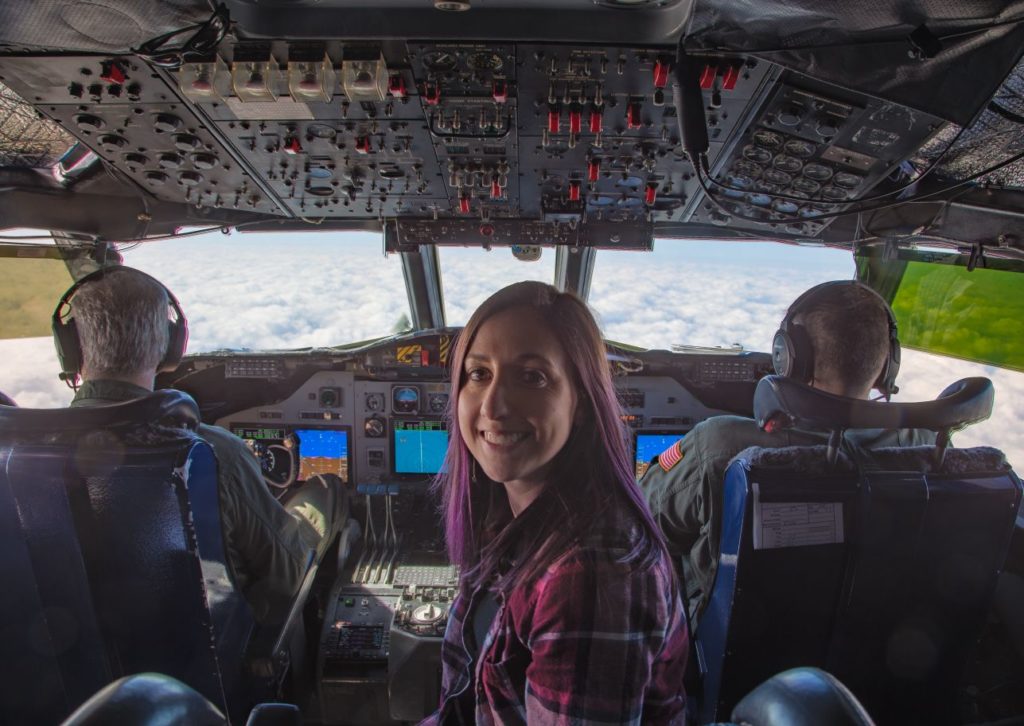
They did not disappoint! This flight was smooth and unlike any flight I have ever experienced. I spent a lot of time in the cockpit for the best views and also because it was much warmer there than the rest of the plane. I must admit, I was a little nervous that I might have motion sickness again, but thankfully I did not. I began talking with the P-3 flight engineer Brian Yates and he let me sit in his seat for about 30 minutes. This is the best seat in the house—in the middle of the cockpit—and might I add that it reclines! This is a luxury not afforded to ANY of the other seats on the P-3.

Lynette Boisvert smiles for the camera while in the flight engineer’s seat in the cockpit of the P-3.
Credit: NASA/Jeremy Harbeck

The first time they did a rolling maneuver you could feel the g-force on you, and as the blood was being pushed from your head, it felt as if you could not move your feet from the ground. It was a very interesting feeling and I felt a little like an astronaut. For the faster, 60-degree rolls, they had me stay in the cockpit. I was a little nervous for what I was in for.

Pilot Mike Singer executing a 60-degree roll maneuver. Credit: NASA/Jeremy Harbeck

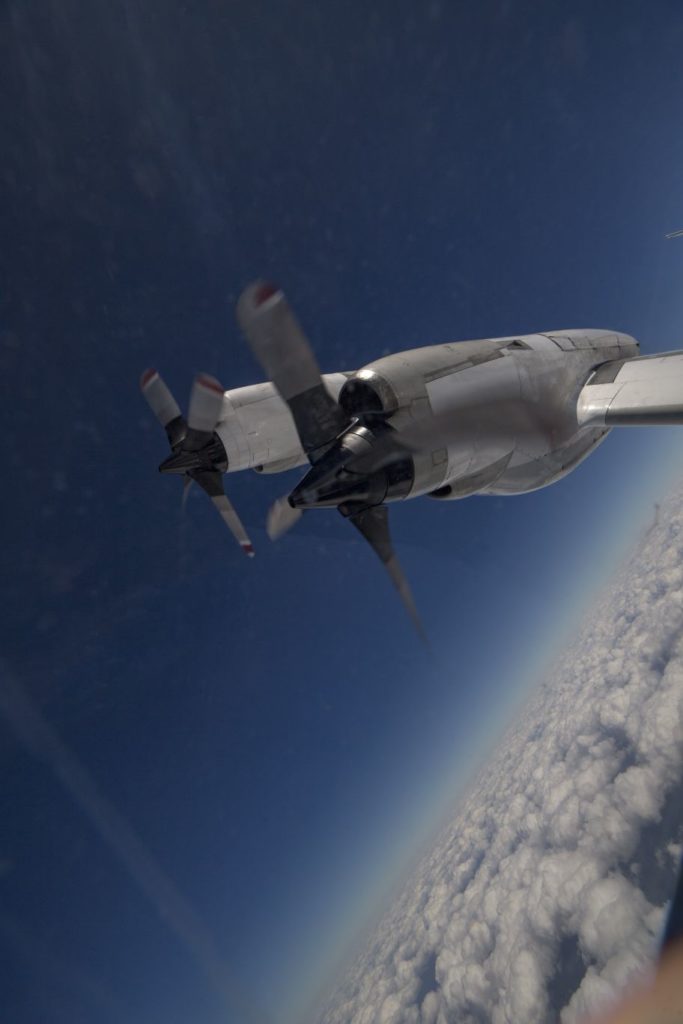
These rolling maneuvers were kind of like being on a carnival ride, and the back-and-forth lulling motions kind of made me feel like I was being rocked to sleep. During this time, I looked back from the cockpit into the rest of the plane and noticed on John Sonntag’s computer our flight line, or as John puts it, “the pilots are drunk” type of flight path, and laughed.

The P-3’s propellers during a rolling maneuver. Credit: NASA/Jeremy Harbeck
The flight path during the roll maneuvers.
Credit: NASA/John Sonntag

Afterward were the up and down maneuvers at different elevations. Again, I was seated in the cockpit, and this felt more like being on a rollercoaster. What I thought was the most interesting aspect of this maneuvering was flying into the cumulus—puffy, cotton candy clouds—and getting to experience it head-on from the cockpit. The updrafts and downdrafts present in the clouds, produced by the mixing of air causing condensation and creation of water droplets to sustain themselves, made for a little turbulence, although nothing like what was witnessed on the prior flight. During landing I was able to sit on my ledge in the cockpit, which is always a thrill. Luckily, the landing was smooth and we were back at Wallops Flight Facility.

Throughout all of this the CReSiS radar teams were working frantically, all huddled around the workstation of remote sensing expert John Paden from the University of Kansas. It appeared as if they were having problems, but if they were, they must have resolved any issues because radar data were successfully collected and calibrated during the flight.

As Melinda and I drove back to NASA Goddard Space Flight Center, located in the concrete jungle of the D.C.-Maryland suburbs, much different from the coastal, rural area surrounding Wallops, we reminisced how much fun the test flights were and how it is always so fascinating to see exactly how the instrument teams work and how the data are collected—data that we use to study the rapidly changing conditions of the Arctic sea ice.

It is also so inspiring to see how dedicated these people are to their jobs and to the OIB mission itself. They spend multiple months away from home in the Arctic and Antarctic, collecting data for scientists and the public to use. During this time they become a family, a cohesive unit, working together to complete successful flights. In some ways, they are like P-3 cowboys riding into the great unknown, wrangling this vastly important data for those of us sitting behind a desk on the ground to use and study. They are the true heroes, and for this we are truly grateful.

Flying with Friends: Operation IceBridge’s Collaboration with ESA

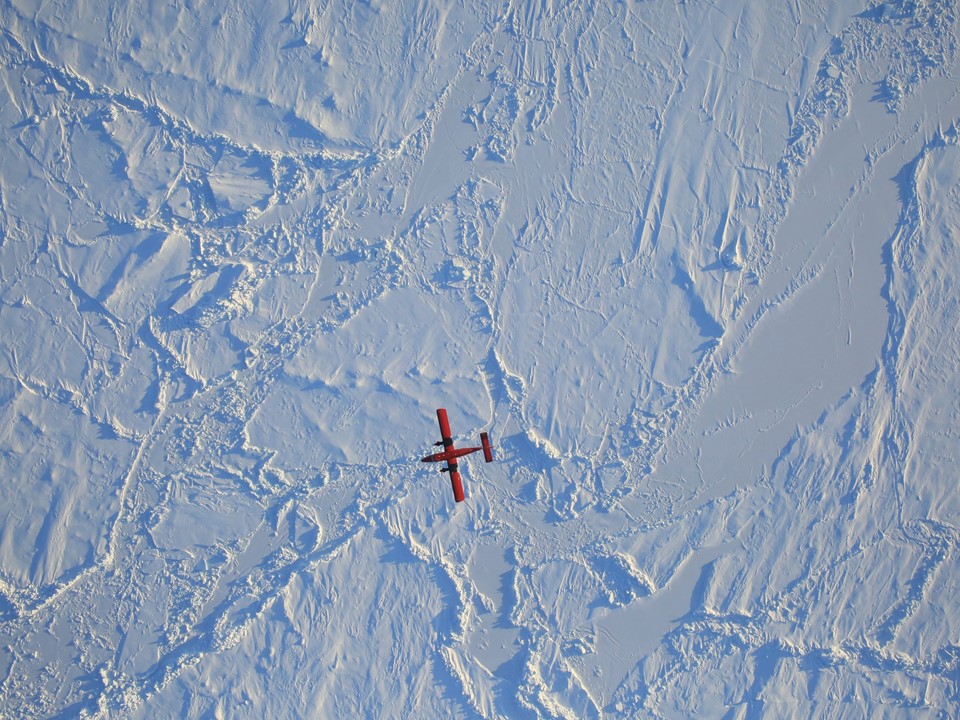
An image of ESA’s Twin Otter passing underneath the P-3, captured by Operation IceBridge’s high-resolution camera. Credit: NASA/Dennis Gearhart
An image of the European Space Agency’s (ESA) Twin Otter passing underneath the P-3, captured by Operation IceBridge’s high-resolution camera. Credit: NASA/Dennis Gearhart

by Maria-Jose Viñas / THULE, GREENLAND /

Do you remember that dreaded math problem in high school, the one where two trains left different stations traveling at different speeds toward each other and you had to calculate when and where they would meet? Now try solving a variation of this problem where the two trains are substituted with three very different aircraft—two leaving from the Canadian Arctic, one from northwestern Greenland—plus a satellite flying overhead. This was the logistical puzzle that Operation IceBridge, NASA’s airborne survey of changing polar ice, had to crack on Friday, March 24, during its ninth Arctic campaign.

The original plan had involved four planes: IceBridge’s P-3, the G-III from NASA’s Oceans Melting Greenland (OMG) campaign and two aircraft from the European Space Agency (ESA)—a Twin Otter and a Basler dubbed Polar 5, both carrying laser scanners and radars, among other instruments. The goal was for all of the planes to fly the same path over sea ice, right beneath one of ESA’s CryoSat-2 satellite tracks, while simultaneously collecting measurements so that scientists could later compare the data gathered by the different instruments on the three planes and the spacecraft’s radar altimeter.

Operation IceBridge’s P-3 at Thule Air Base. Credit: NASA/Maria-Jose Viñas

“The primary reason for the whole exercise was to cross-calibrate the CryoSat-2 radar with all of our radars and lasers,” said John Sonntag, IceBridge mission scientist. “This will allow us all to better understand the performance of our instruments and how well we perform our surveys”.

Early in the morning of Thursday, March 24, IceBridge’s P-3 and OMG’s G-III took off from Thule Air Base in northwest Greenland and headed to the Lincoln Sea, north of Canada. They were planning to rendezvous there with the two ESA planes, which were based in Alert Station, a Canadian base in Ellesmere Island, in the Canadian Arctic. Since the Twin Otter and Polar 5 were located closer to the target site, the Europeans would depart Alert four hours after the NASA planes had left Thule. But before they could take off, an unexpected fog bank rolled over Alert, shutting the airport down.

Still, IceBridge and OMG proceeded with their flight, sampling the thick multi-year ice near the Ellesmere coast and the gradient to thinner ice closer to the North Pole with their instruments: OMG’s radar mapper and IceBridge’s suite of instruments, encompassing a scanning laser altimeter that measures ice surface elevation, three types of radar systems to study ice layers and the bedrock underneath the ice sheet, a high-resolution camera to create color maps of polar ice, and infrared cameras to measure surface temperatures of sea and land ice.

The following day, the IceBridge team decided to give it another go but OMG had already exhausted its allotted flight hours and had to stay on the ground. To increase their confidence that their European collaborators would be able to fly that day, the P-3 took off one and a half hours later than it normally would have. This time, it was a success: the three aircraft flew over the CryoSat-2 track line (one a few dozen miles east of the one IceBridge and OMG had flown the day before) within 42 minutes of each other. The satellite overflew the same line just two minutes after IceBridge had completed it.

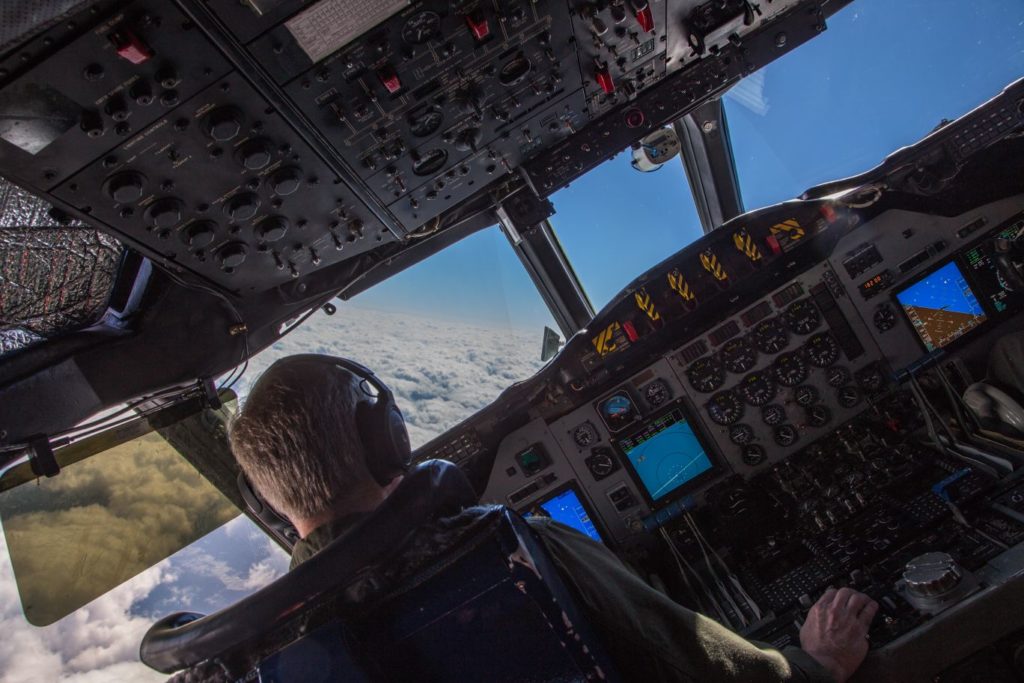
View from the P-3’s cockpit of the encounter with the Polar 5 and Twin Otter planes. Credit: NASA/Jeremy Harbeck

“Ideally, all three aircraft and the satellite would be over the same point at exactly the same time, but that’s almost impossible to do with three airplanes operating at different speeds and altitudes,” Sonntag said. “Still, we had some flexibility because the sea ice moves slowly—as long as we all flew over it within two hours, we could be sure we were all measuring the same ice.”

It will take scientists from the different teams about six months to process all the measurements before they’re able to compare them, but NASA and ESA are already calling the collaboration a success.

“This collaboration took a lot of careful coordination,” Sonntag said. “It demonstrates the commitment of ESA and NASA to work cooperatively to better understand the cryosphere.”

NASA IceBridge: Fit to Fly

The Mountains of Alexander Island as seen from the NASA DC-8 on October 15, 2016.  The curious feature near the floor of the valley at center may be a small patch of fog, or it may be an avalanche in progress. Credit: NASA/John Sonntag
The Mountains of Alexander Island as seen from the NASA DC-8 on October 15, 2016. The curious feature near the floor of the valley at center may be a small patch of fog, or it may be an avalanche in progress. Credit: NASA/John Sonntag

by Emily Schaller / PUNTA ARENAS, CHILE /

Imagine a 12-hour flight that takes off and lands in exactly the same place. Now imagine willingly boarding that flight six days per week. This is the routine that NASA’s Operation IceBridge team in Punta Arenas, Chile, follows for six weeks every fall in order to collect data on Antarctica’s changing ice sheets, glaciers and sea ice. Operation IceBridge’s mission is to collect data on changing polar land and sea ice and maintain continuity of measurements between ICESat missions. The original ICESat mission ended in 2009, and its successor, ICESat-2, is scheduled for launch in 2018.

Our DC-8 flying laboratory can’t land on the icy surface of Antarctica, so instead we base our operations as close as we can get—near the southern tip of Chile. The schedule is grueling but incredibly important for maintaining a yearly record of Antarctica’s changing ice.

What is it like inside the airplane every day for those 12-hour flights?

There are generally about 25 of us aboard, including pilots and crew and a team of scientists and engineers who operate a variety of instruments measuring the thickness and extent of ice sheets.

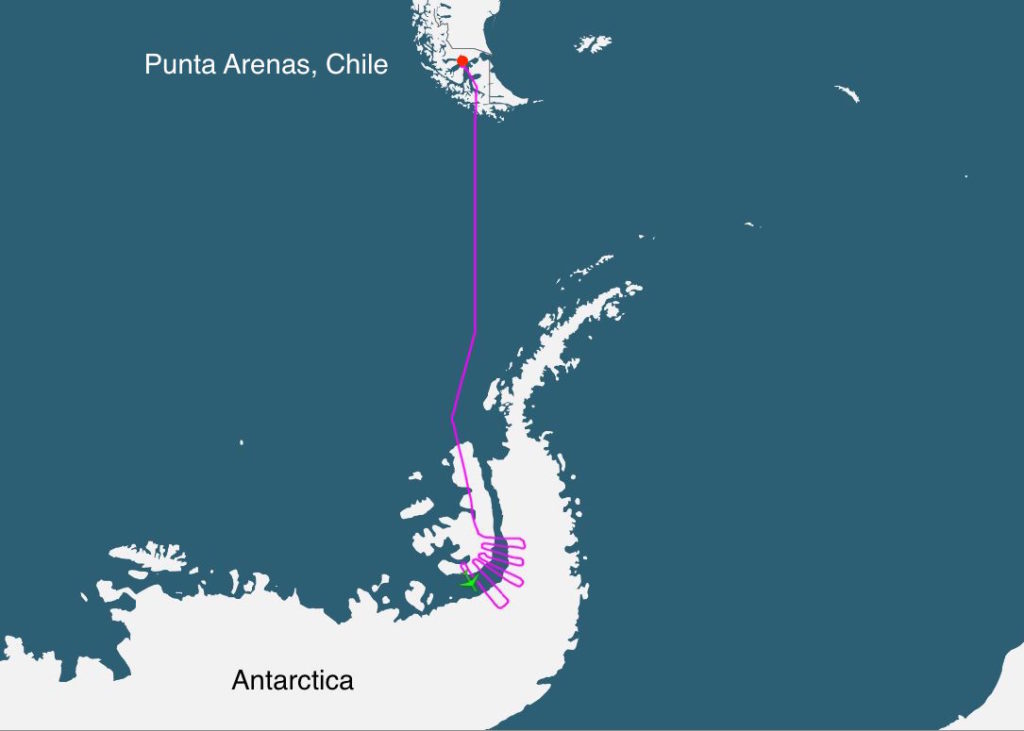
Operation IceBridge's DC-8 flight track from October 14, 2016, showing the position of the aircraft (green icon) over Antarctica about half way through the 11-hour science flight.  The DC-8 takes off and lands at Punta Arenas, Chile.
Operation IceBridge’s DC-8 flight track from October 14, 2016, showing the position of the aircraft (green icon) over Antarctica about half way through the 11-hour science flight. The DC-8 takes off and lands at Punta Arenas, Chile. Credit: NASA

Much of the roughly 12-hour flight is spent flying to and from Antarctica, with the meat of the science in the middle hours of the flight (between 3-9 hours after takeoff, if our mapping target of the day is near the Antarctic coast, or between 4-8 hours after takeoff if our mapping target is closer to the pole).  Most of the instruments do not collect data until we get to Antarctica, so this leaves hours of downtime at the beginning and end of each flight for many of the people aboard (except for the pilots and navigators, of course!).  We often fill this time with outreach and educational activities, as our airplane’s satellite data system allows us to live chat with classrooms back in the United States and all over the world.  Over the past 4 years, nearly 5,000 students in K-12 classrooms across the US and in Canada, Mexico and Chile have connected directly with our IceBridge teams in-flight.

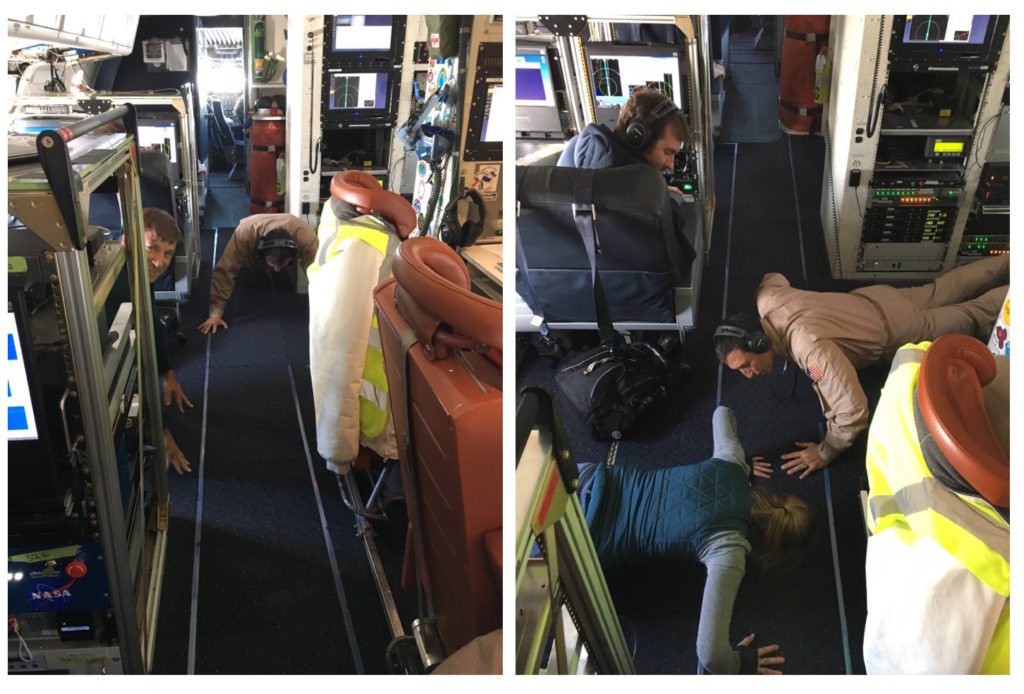
In order to keep ourselves in shape and build team morale, an informal airborne Antarctic workout club has formed to help pass the time during our long flights. Originally inspired by a Navy tradition of dropping and doing 25 pushups on the hour, every hour, our DC-8 version of this tradition persists on many missions due to the encouragement of DC-8 Navigator Walter Klein, Operations Engineer Matt Berry and by IceBridge Project Manager John Woods.

Pushups_DC8_Antarctica
On October 15, 2016, while flying over Antarctica on the NASA DC-8, members of the Workout Club Above Antarctica get moving. Left: John Woods and Walter Klein. Right: Emily Schaller and Walter Klein. Credit: NASA/Emily Schaller

On recent IceBridge flights, in addition to (or in place of) pushups (depending on the person), the on-the-hour exercise also includes squats, stretching, yoga and ballet.

 IceBridge instrument scientist, Eric Fraim, aboard the DC-8 during an hourly exercise break, practices a Barre3-inspired pose above Antarctica. Credit: NASA/Emily Schaller

IceBridge instrument scientist, Eric Fraim, aboard the DC-8 during an hourly exercise break, practices a Barre3-inspired pose above Antarctica. Credit: NASA/Emily Schaller

While not everyone gets up every hour due to their various duties, there are usually a few people nearly every hour doing activities to keep the blood flowing and their minds and bodies engaged during the long daily flights over Antarctica.

NASA IceBridge Antarctica: We are fit to fly!