Sep. 07, 2018 – NASA Finds Hurricane Norman Hammered by Wind Shear
NASA’s Aqua satellite obtained a visible image of Hurricane Norman northeast of the Hawaiian Islands and found the storm weakening and battling wind shear.
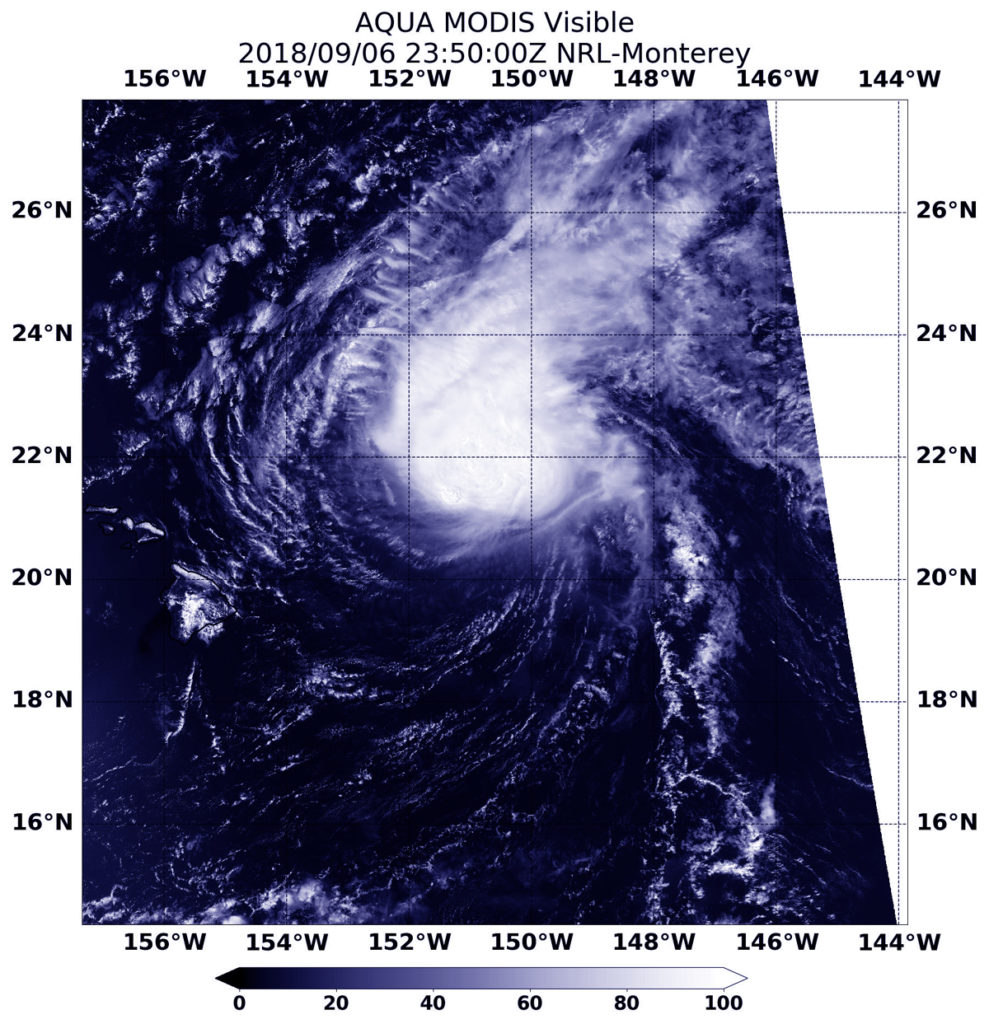
NASA’s Aqua satellite provided an infrared look at Norman as it continued weakening and moving northwest of the Hawaiian Islands. It is not close enough to the islands to generate any watches or warnings, however, a large swell generated by Norman peaked across the main Hawaiian Islands overnight on Sept. 6, causing large and potentially dangerous surf along east facing shores. The surf is forecast to diminish on Friday, Sept. 7.
The Aqua satellite image taken from the MODIS instrument showed the storm was being tilted from strong vertical wind shear. The eye was covered by clouds which made the center difficult to locate.
At 5 a.m. EDT on Sept. 7 (11 p.m. HST on Sept. 6) the center of Hurricane Norman was located near latitude 22.5 North, longitude 151.7 degrees west. That’s 290 miles (470 km) northeast of Hilo, Hawaii.
Norman is moving toward the northwest near 8 mph (13 km/h) and this motion is expected to continue through Saturday, remaining east of the main Hawaiian Islands. Maximum sustained winds are near 85 mph (140 kph) with higher gusts. Weakening is forecast through Saturday.
For updates on Norman, visit: http://www.prh.noaa.gov/cphc
By Rob Gutro
NASA’s Goddard Space Flight Center
Sep. 06, 2018 – Category 3 Hurricane Norman Expands its Area of Strength
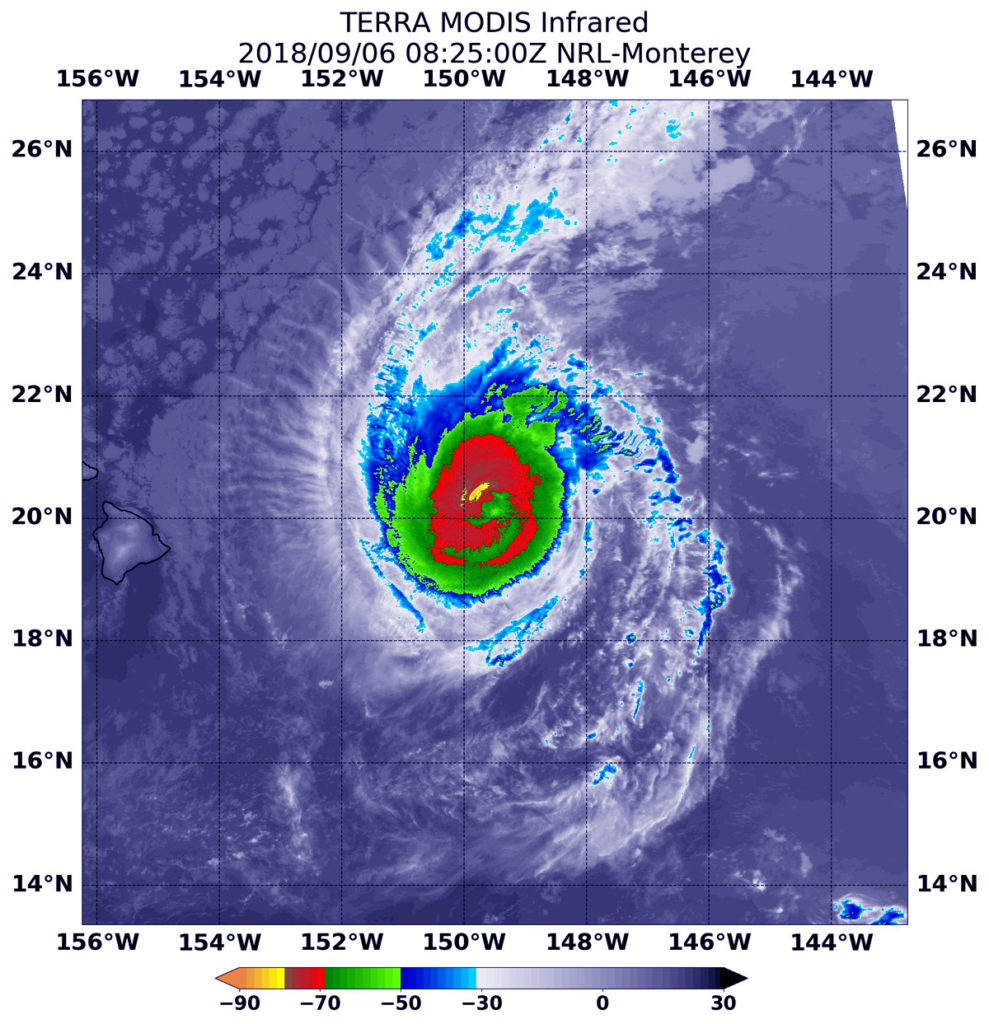
The area of stronger storms in Hurricane Norman have expanded over the last several day in infrared NASA imagery as the storm intensified. Stronger thunderstorms circled Norman’s center in a thicker ring on Sept. 6 when NASA’s Terra satellite passed over the hurricane.
On Sept. 6, Major Hurricane Norman was east of the Hawaiian Islands and tracking toward the west-northwest. Although there are no coastal warnings or watches in effect, NOAA’s Central Pacific Hurricane Center noted “Interests in the main Hawaiian Islands should monitor the progress of Norman over the next couple of days.”
Infrared satellite data at 4:25 a.m. EDT (0825 UTC) on Sept. 6, from the Moderate Resolution Imaging Spectroradiometer or MODIS instrument aboard NASA’s Terra satellite showed coldest cloud top temperatures in Norman completely circled the eye in a very wide band. On Sept 4, the MODIS instrument aboard NASA’s Aqua satellite showed a band of strong storms that circled the center was much thinner. As Norman intensified, the stronger storms expanded further out from the eye.
That powerful band of thunderstorms showed coldest cloud tops had temperatures near minus 70 degrees Fahrenheit (minus 56.6 degrees Celsius). NASA research has found that cloud top temperatures that cold have the capability to generate heavy rainfall.
At 5 a.m. EDT (0900 UTC) on Sept. 6 (11 p.m. HST on Sept. 5), the center of Hurricane Norman was located near latitude 20.3 degrees north and longitude 149.8 degrees west. Norman is moving toward the west-northwest near 8 mph. This motion is expected to continue tonight, followed by a turn toward the northwest on Thursday. Norman is forecast to continue to move toward the northwest on Friday and Saturday, and along the forecast track, the center of Norman is expected to pass 200 to 300 miles to the northeast of the main Hawaiian Islands.
Maximum sustained winds are near 120 mph (195 kph) with higher gusts. Norman is a category 3 hurricane on the Saffir-Simpson Hurricane Wind Scale. Weakening is expected over the next couple of days.
CPHC noted that “large swells generated by Norman will continue to build across the Hawaiian Islands through Thursday. Large and potentially dangerous surf is expected along east facing shores through at least Thursday night, Sept. 6.”
For updates on Norman, visit: http://www.prh.noaa.gov/cphc/
By Rob Gutro
NASA’s Goddard Space Flight Center
Sep. 05, 2018 – NASA-NOAA’s Suomi NPP Satellite Sees Norman Rapidly Intensifying
NASA-NOAA’s Suomi NPP analyzed Hurricane Norman in the Central Pacific Ocean as it was rapidly intensifying into a major hurricane.

On Sept. 4 at 7:24 p.m. EDT (2324 UTC) the Visible Infrared Imaging Radiometer Suite (VIIRS) instrument aboard NASA-NOAA’s Suomi NPP satellite captured a visible image of Hurricane Norman. The visible image revealed good formation with bands of thunderstorms spiraling into a cloud-filled eye. At the time, Norman was a Category 1 hurricane on the Saffir-Simpson hurricane wind scale with maximum sustained winds near 80 mph (70 knots/129.6 kph).
During the early morning on Sept. 5, maximum sustained winds rapidly intensified from 85 knots to 100 knots.
At 11 a.m. EDT (5 a.m. HST/1500 UTC) maximum sustained winds have increased to near 115 mph (100 knots/185 kph) with higher gusts, and Norman is now a category 3 hurricane on the Saffir-Simpson Hurricane Wind Scale. Some fluctuations in intensity are possible today, followed by gradual weakening from tonight.
The center of Hurricane Norman was located near latitude 19.5 degrees north and longitude 147.7 degrees west. That’s 480 miles (775 km) east of Hilo, Hawaii. Norman is moving toward the west near 12 mph (19 kph), and this general motion is expected to continue through this morning. Norman is expected to slow its forward motion slightly, and turn toward the west-northwest later today and tonight. A turn toward the northwest is expected Thursday and Thursday night.
Norman is expected to remain a hurricane through Thursday, Sept. 6.
For updated forecasts on Norman, visit: http://www.prh.noaa.gov/cphc
By Rob Gutro
NASA’s Goddard Space Flight Center
Sep. 04. 2018 – Infrared NASA Imagery Shows Hurricane Norman Holding its Own
NASA’s Aqua satellite passed over Hurricane Norman in the Central Pacific Ocean and found that the storm continued to maintain its structure.
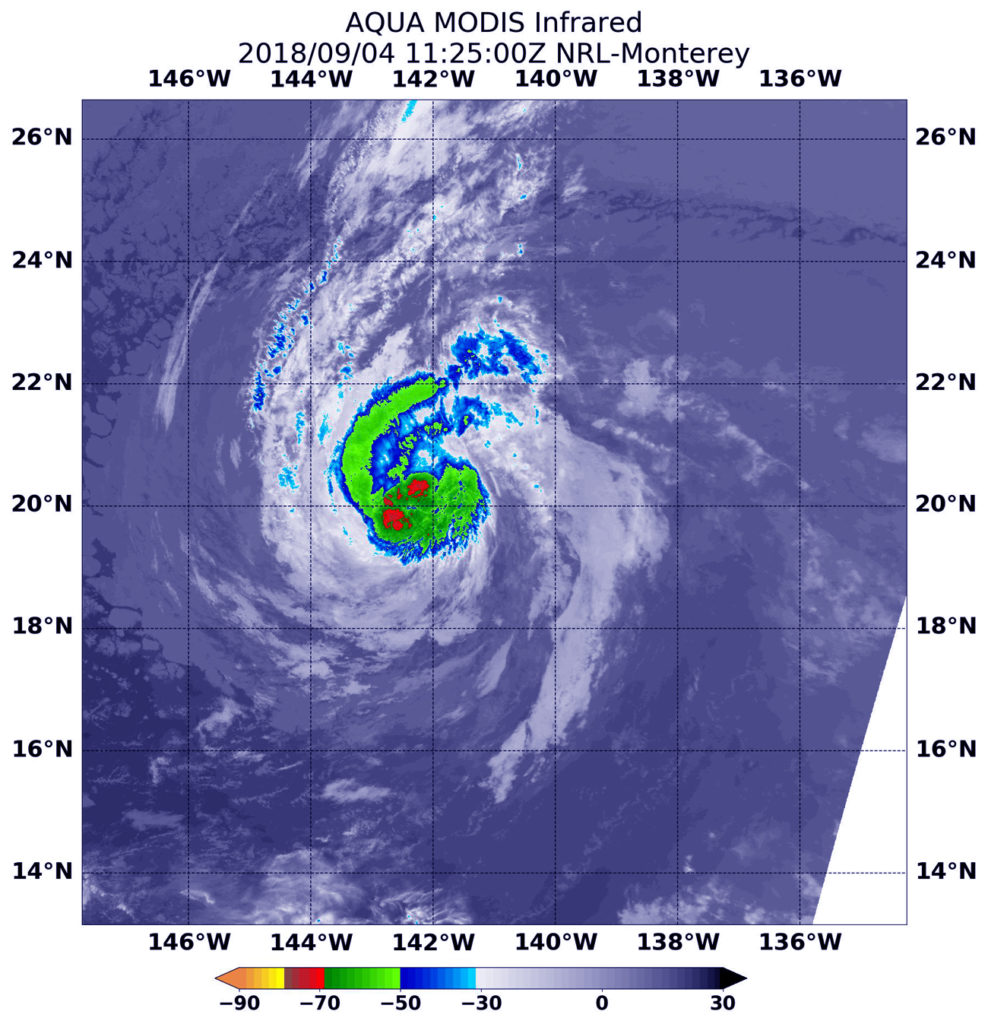
Infrared satellite data at 7:25 a.m. EDT (1125 UTC) on Sept. 4, from the Moderate Resolution Imaging Spectroradiometer or MODIS instrument aboard NASA’s Aqua satellite showed coldest cloud top temperatures in Norman were around the eye and southwest of the eye. In those areas, cloud tops had temperatures near minus 70 degrees Fahrenheit (minus 56.6 degrees Celsius). NASA research has found that cloud top temperatures that cold have the capability to generate heavy rainfall.
Overnight, Norman remained generally steady but had some recent development of new deep convection very close to the estimated low-level circulation center. A recent microwave image showed a rather well-defined eye.
At 11 a.m. EDT (5 a.m. HST/1500 UTC), the center of Hurricane Norman was located near latitude 19.9 degrees north and longitude 143.4 degrees west. That’s 760 miles (1,225 km) east of Hilo, Hawaii. Norman is moving toward the west near 17 mph (28 kph).
NOAA’s Central Pacific Hurricane Center or CPHC said a westward motion with a decrease in forward speed is expected to continue through tonight, followed by a turn to the west-northwest on Wednesday, Sept. 5 and to the northwest on Wednesday night.
Maximum sustained winds are near 85 mph (140 kph) with higher gusts. Little change in strength is forecast during the next 48 hours, with Norman forecast to remain a hurricane through Wednesday night.
CPHC noted that large ocean swells generated by Norman will produce rough surf along east facing shores of the Hawaiian Islands beginning later today and continuing through at least Thursday night.
For updates on Norman, visit: http://www.prh.noaa.gov/cphc/
By Rob Gutro
NASA’s Goddard Space Flight Center
Aug. 31, 2018 – Hurricane Norman’s Southeast Quadrant Appears Strongest on NASA Imagery
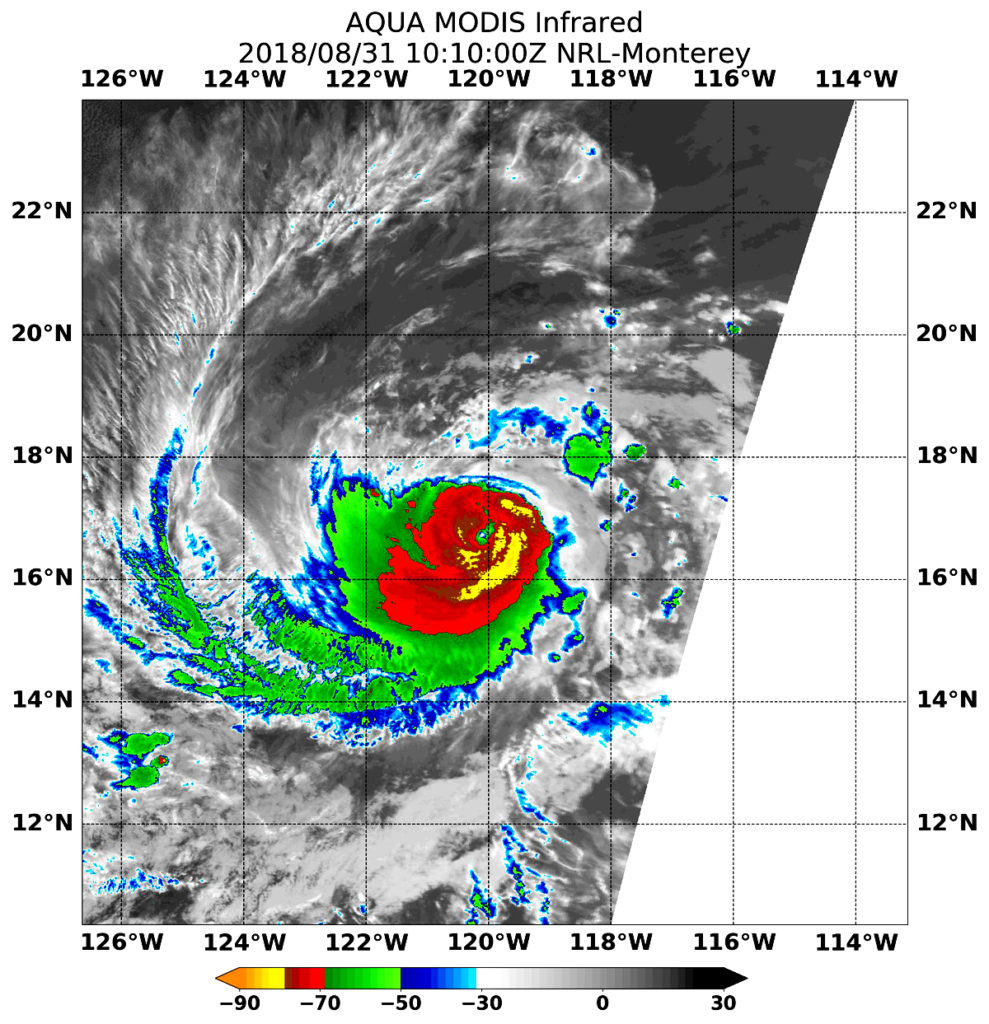
NASA’s Aqua satellite provided valuable infrared temperature data on Category 4 Hurricane Norman that showed its strongest storms were southeast of center.
Credits: NRL/NASA
On Aug. 31 at 6:10 a.m. EDT (1010 UTC) the Moderate Resolution Imaging Spectroradiometer or MODIS instrument aboard NASA’s Aqua satellite found the coldest temperatures of the strongest thunderstorms in Hurricane Norman were southeast of the center and were as cold as or colder than minus 80 degrees Fahrenheit (minus 62.2 Celsius). They were embedded in a large area of storms where cloud top temperatures were as cold as or colder than minus 70 degrees Fahrenheit (minus 56.6 degrees Celsius). NASA research has shown that storms with cloud top temperatures that cold (that are very high in the troposphere) have the capability to generate heavy rain.
There are no coastal watches or warnings in effect as Norman is far from land. It is 825 miles (1,330 km) west-southwest of the southern tip of Baja California.
The National Hurricane Center (NHC) noted at 11 a.m. EDT (1500 UTC), the eye of Hurricane Norman was located near latitude 16.7 degrees north and longitude 120.8 degrees west. Norman is moving toward the west-southwest near 8 mph (13 kph). A turn toward the west and west-northwest with an increase in forward speed is expected over the weekend and into next week.
Maximum sustained winds have decreased to near 130 mph (215 kph) with higher gusts. Norman is a category 4 hurricane on the Saffir-Simpson Hurricane Wind Scale. Hurricane-force winds extend outward up to 25 miles (35 km) from the center and tropical-storm-force winds extend outward up to 90 miles (150 km).
Gradual weakening is forecast, but Norman is expected to remain a powerful hurricane through the early part of next week.
For updated forecasts on Norman, visit: www.nhc.noaa.gov
By Rob Gutro
NASA’s Goddard Space Flight Center
Aug. 30, 2018 – NASA Finds Very Cold Storm tops Circling Hurricane Norman’s Center
When NASA’s Aqua satellite passed over Hurricane Norman on Aug. 30 infrared data showed very cold storm tops around a 20 nautical-mile-wide eye.
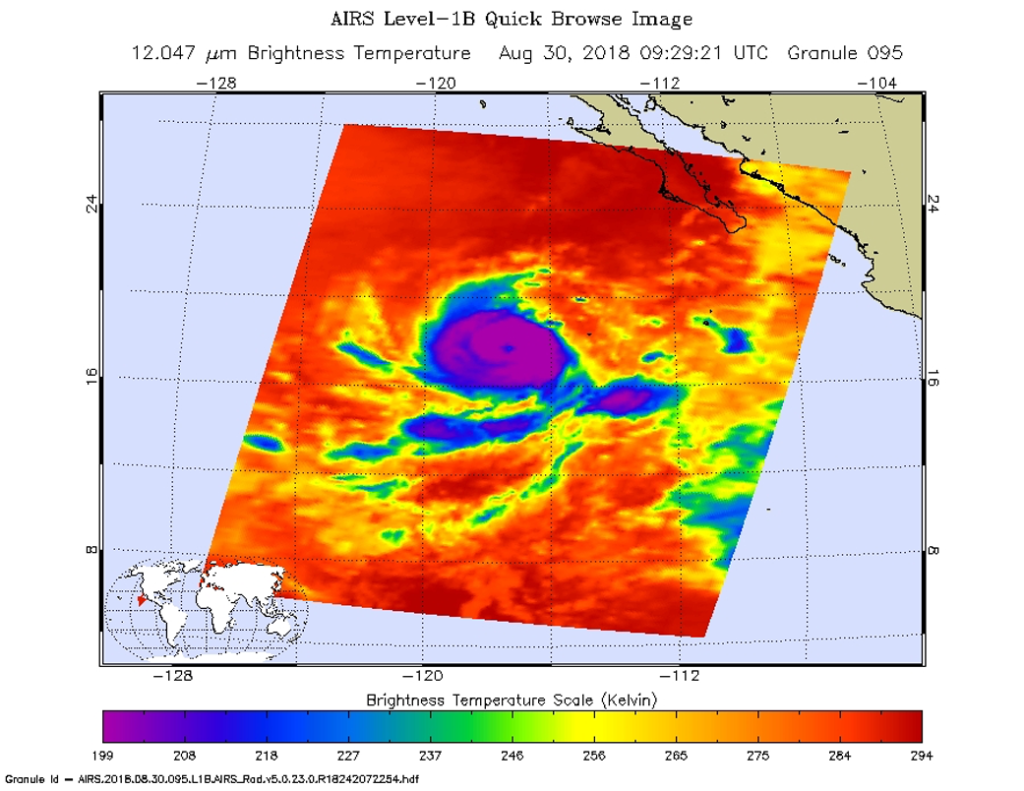
NASA’s Aqua satellite passed over Norman on Aug. 30 at 5:29 a.m. EDT (0929 UTC). The Atmospheric Infrared Sounder or AIRS instrument analyzed the storm in infrared light which provides temperature information. Temperature is important when trying to understand how strong storms can be. The higher the cloud tops, the colder and the stronger they are.
On Aug. 30 at 11 a.m. EDT (1500 UTC), NOAA’s National Hurricane Center or NHC noted Norman had rapidly strengthened during the past 12 to 24 hours, with the development of a well-defined 20-nautical mile wide eye and a thick ring of cold cloud tops of minus 94 to minus 121 degrees Fahrenheit (minus 70 to minus 85 degrees Celsius) Storms with cloud top temperatures that cold have the capability to produce heavy rainfall.
The eye of Hurricane Norman was located near latitude 17.8 degrees north and longitude 118.0 degrees west. That’s about 630 miles (1,015 km) west-southwest of the southern tip of Baja California, Mexico.
Norman was moving toward the west near 8 mph (13 kph), and this motion is expected to continue today. A west-southwestward motion is forecast on Friday, followed by a turn back toward the west and west-northwest over the weekend.
Maximum sustained winds have increased to near 150 mph (240 kph) with higher gusts. Norman is a category 4 hurricane on the Saffir-Simpson Hurricane Wind Scale. Some additional strengthening is forecast during the next 12 to 24 hours.
Gradual weakening is anticipated to begin by Friday night or Saturday, however, Norman is expected to remain a very powerful hurricane during the next few days.
For updated forecasts, visit: www.nhc.noaa.gov.
By Rob Gutro
NASA’s Goddard Space Flight Center
Aug. 29, 2018 – NASA Examines Intensifying Tropical Storm Norman
NASA’s Aqua satellite provided valuable temperature data on Tropical Storm Norman in the Eastern Pacific Ocean. Aqua data showed Norman was quickly intensifying
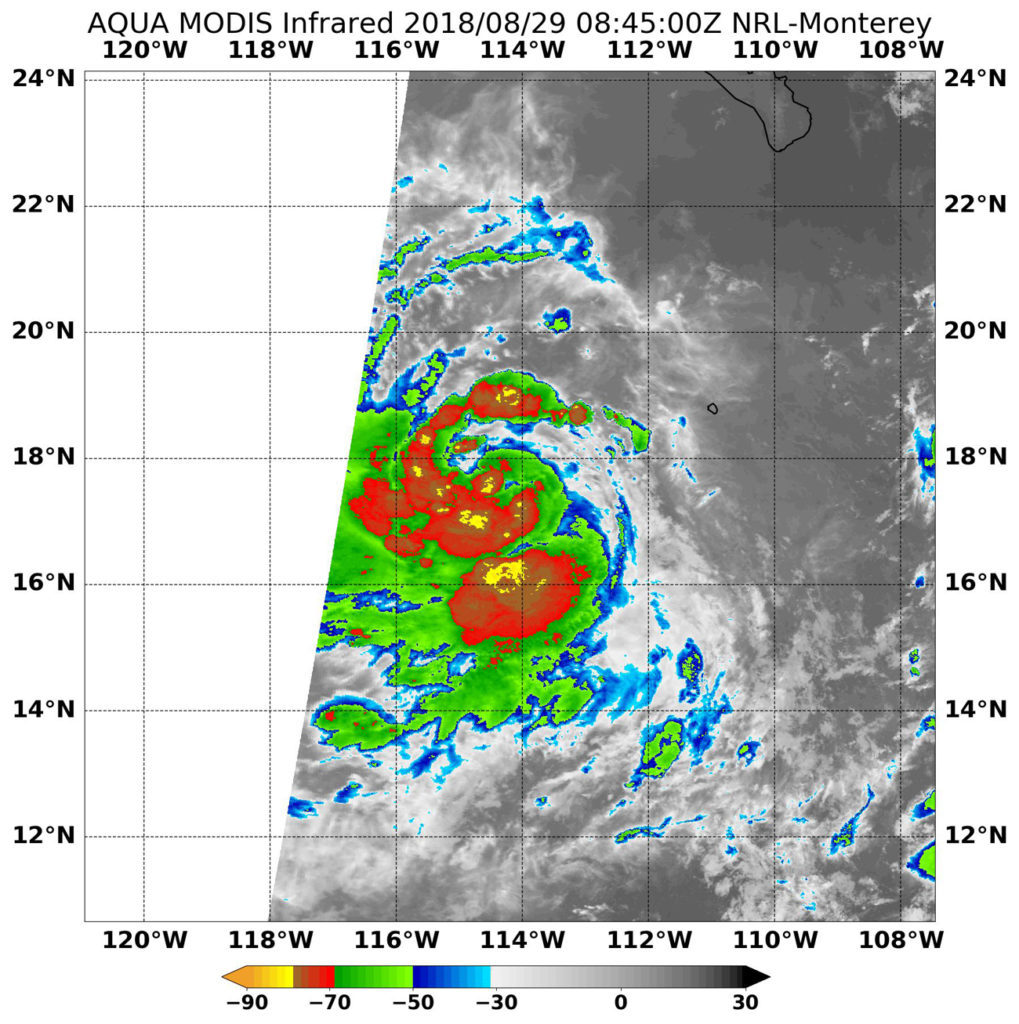
Credits: NRL/NASA
At 11 p.m. EDT on Aug. 28, Tropical Depression 16E strengthened into a tropical storm and was renamed Norman.
On Aug. 29 at 4:45 a.m. EDT (0845 UTC) the Moderate Resolution Imaging Spectroradiometer or MODIS instrument aboard NASA’s Aqua satellite found the coldest temperatures of the strongest thunderstorms in Tropical Storm Norman were north and south of the center and were as cold as or colder than minus 80 degrees Fahrenheit (minus 62.2 Celsius). They were embedded in a large area of storms where cloud top temperatures were as cold as or colder than minus 70 degrees Fahrenheit (minus 56.6 degrees Celsius). NASA research has shown that storms with cloud top temperatures that cold (that are very high in the troposphere) have the capability to generate heavy rain.
The National Hurricane Center (NHC) noted today, Aug. 29 that Norman is forecast to rapidly intensify and become a hurricane later today. Forecaster Berg of NHC said “Norman’s infrared satellite signature has the look of a cyclone ready to strengthen significantly over the next couple of days. Banding continues to increase, with the convective canopy expanding in nearly all quadrants.”
At 5 a.m. EDT (0900 UTC), the center of Tropical Storm Norman was located near latitude 17.5 degrees north and longitude 114.6 degrees west. That’s about 480 miles (775 km) southwest of the southern tip of Baja California, Mexico. Norman was moving toward the west near 10 mph (17 kph). A fairly steady westward or west-southwestward motion is expected during the next several days.
Maximum sustained winds have increased to near 60 mph (95 kph) with higher gusts. Rapid strengthening is forecast during the next 48 hours, and Norman is expected to become a hurricane later today, and possibly a major hurricane on Thursday, Aug. 30.
For updated forecasts on Norman, visit: www.nhc.noaa.gov
By Rob Gutro
NASA’s Goddard Space Flight Center
Aug. 28, 2018 – NASA Sees Formation of Eastern Pacific Tropical Depression 16E
NASA’s Aqua satellite saw the sixteenth tropical depression of the Eastern Pacific Ocean come together on Aug. 28.
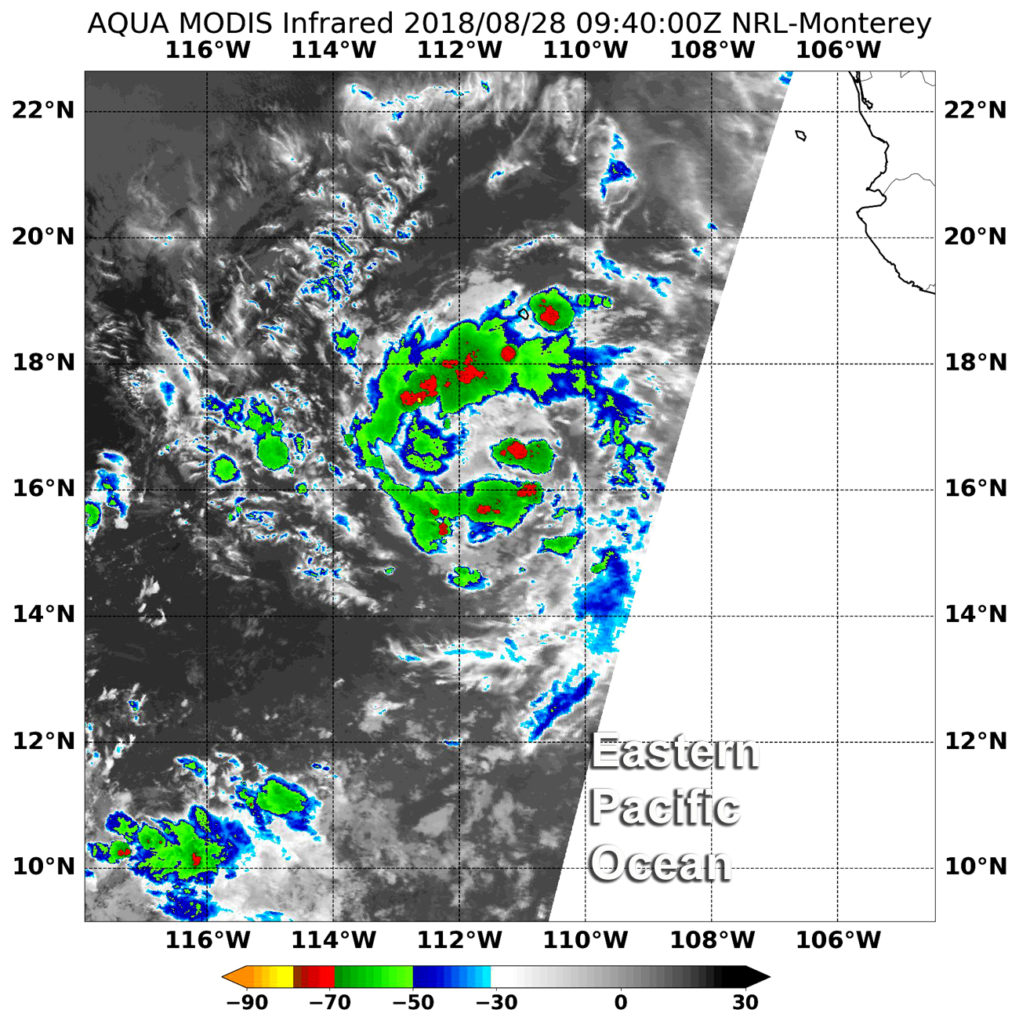
At 5:40 a.m. EDT (0940 UTC) on Aug. 28 the Moderate Resolution Imaging Spectroradiometer or MODIS instrument aboard Aqua used infrared data to measure cloud top temperatures in Tropical Depression 16E (TD16E) when it was forming.
Coldest cloud tops were near minus 70 degrees Fahrenheit (minus 56.6 degrees Celsius). Aqua observed fragmented bands of thunderstorms circling a low-level center of circulation and some stronger storms within them.
Storms with cloud top temperatures that cold have the capability to produce heavy rainfall. That heavy rain was falling over open ocean waters.
On August 28, 2018 there were no coastal watches or warnings in effect because TD16E formed far from land. It was located about 420 miles (675 km) south-southwest of the southern tip of Baja California, Mexico.
At 11 a.m. EDT (1500 UTC), the center of newly formed Tropical Depression Sixteen-E was located near latitude 17.1 degrees north and longitude 111.8 degrees west. The depression is moving toward the west-northwest near 10 mph (17 kph), and this motion is expected to continue for the next day or so with a gradual turn to the west thereafter.
NOAAs National Hurricane Center said “Maximum sustained winds are near 35 mph (55 kph) with higher gusts. Some strengthening is forecast during the next 48 hours, and the depression is expected to become a tropical storm later today or on Wednesday, and a hurricane by Thursday (Aug. 30).”
For updated forecasts from the NHC, visit: http://www.nhc.noaa.gov
By Rob Gutro
NASA’s Goddard Space Flight Center