Oct. 15, 2018 – Hurricane Michael’s Heavy Rainfall Measured by NASA
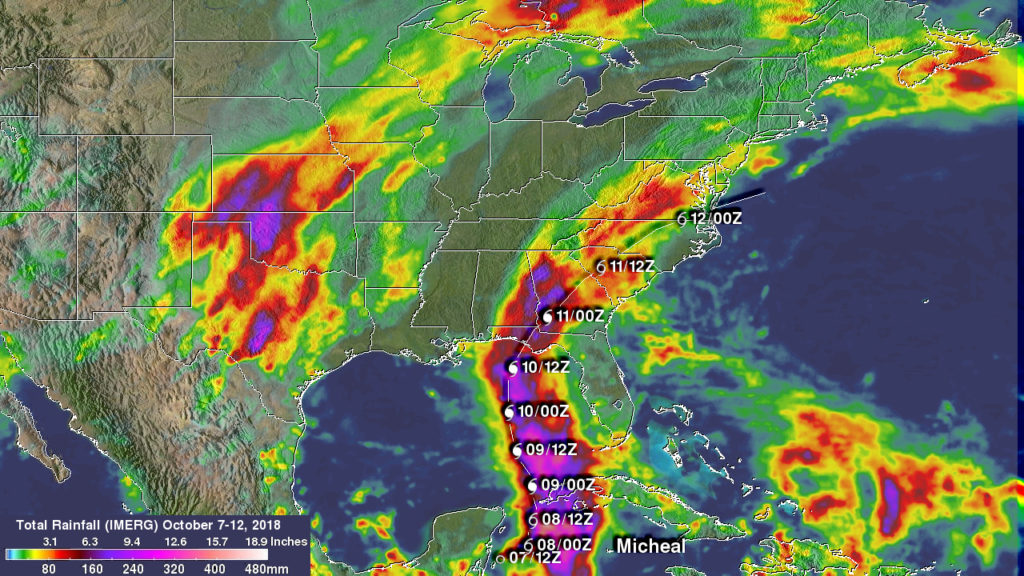
Some casualties resulted not only from Michael’s destructive winds and storm surges but also from the blinding rain that Michael produced as it battered states from Florida northeastward through Virginia. NASA used satellite data to estimate how much rainfall occurred along Hurricane Michael’s track from Oct. 7 to Oct. 12, 2018.

On Friday, Oct. 12, Tropical Storm Michael moved out over the Atlantic Ocean and has transitioned into a powerful extratropical storm.
A rainfall accumulation analysis created at NASA’s Goddard Space Flight Center in Greenbelt, Md. was derived from NASA’s Integrated Multi-satellitE Retrievals data (IMERG). IMERG data were used to calculate estimates of precipitation totals from a combination of space-borne passive microwave sensors, including the GMI microwave sensor on the GPM or Global Precipitation Measurement mission satellite, and geostationary infrared data. IMERG data benefits from algorithms developed by NASA’s Precipitation Measurement Missions (PMM) science team that supports GPM’s Missions. GPM is a joint mission between NASA and the Japan Aerospace Exploration Agency, JAXA.
An analysis showed IMERG rainfall accumulation estimates along Michael’s track during the period from becoming a tropical depression fourteen off the coast of the Yucatan Peninsula on Oct. 7 until it passed off the U.S. East Coast on Oct. 12. IMERG rainfall accumulation data indicated that Michael frequently produced rainfall totals greater than 10 inches (254 mm) along its track. IMERG data indicated that the heaviest rainfall accumulation occurred off the Yucatan where were over 20 inches (512 mm) were estimated.
Also of interest is the heavy rainfall that fell in less than a week with stormy weather extending from Texas to the Great Lakes.
By Harold F. Pierce
NASA Goddard Space Flight Center
