Sep. 20, 2018 – NASA Created Rainfall Analysis for Super Typhoon Mangkhut
At NASA’s Goddard Space Flight Center in Greenbelt, Md. data was used to create a map of rainfall generated by Super Typhoon Mangkhut.
Compared to hurricane Florence, that stalled over the state of North Carolina, super typhoon Mangkhut moved fairly quickly across the western Pacific. Mangkhut killed at least 81 people in the Philippines. The typhoon’s rainfall caused a landslide in the northern Philippines that killed at least 66 people. At least four people in China and one person in Taiwan were also reported victims of Mangkhut. When it was moving between the Marianas and the Philippines the typhoon had sustained winds reported at 155 knots (178 mph). Wind speeds of 135 knots (155 mph) were reported when it hit Hong Kong. This made it the most intense tropical cyclone in Hong Kong’s history.
The NASA rainfall accumulation analysis was derived from NASA’s Integrated Multi-satellitE Retrievals for GPM data (IMERG). GPM is the Global Precipitation Measurement mission satellite, managed by both NASA and the Japan Aerospace Exploration Agency.
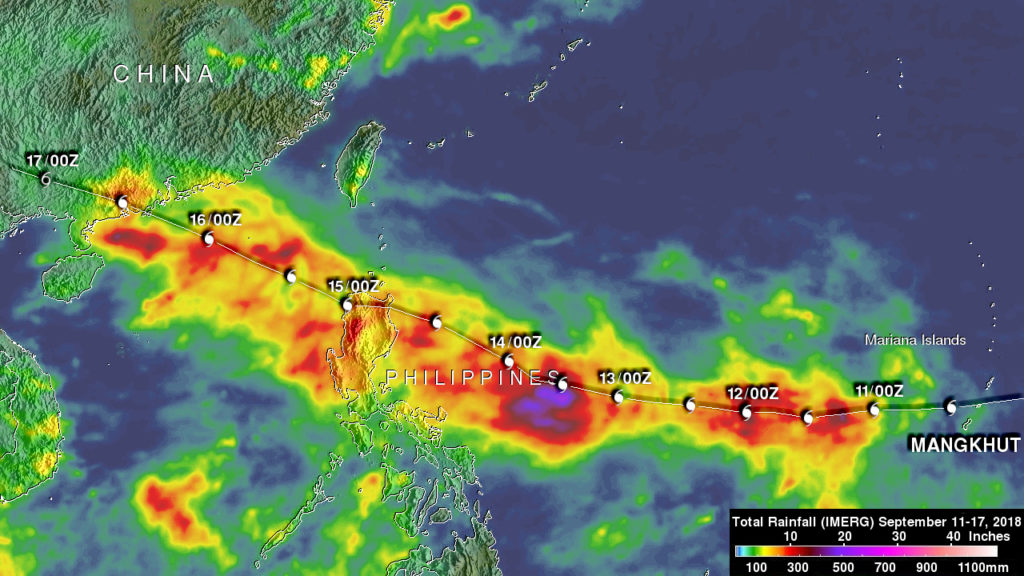
The NASA analysis showed IMERG rainfall estimates over the western Pacific Ocean during the period from September 11-17, 2018. Rainfall totals above 300 mm (11.8 inches) were often indicated along Mangkhut’s path. The highest rainfall accumulation estimates of over 700 mm (27.6 inches) were shown by IMERG south of Mangkhut’s track in the Philippine Sea. Credit: NASA/JAXA, Hal Pierce
IMERG data are used to calculate estimates of precipitation from a combination of space-borne passive microwave sensors, including the GMI microwave sensor onboard the GPM satellite, and geostationary IR (infrared) data. The analysis showed IMERG rainfall estimates over the western Pacific Ocean during the period from September 11-17, 2018. During that period typhoon Mangkhut moved west of Guam to the Philippines and then over the South China Sea into southeastern China. Rainfall totals above 300 mm (11.8 inches) were often indicated along Mangkhut’s path. The highest rainfall accumulation estimates of over 700 mm (27.6 inches) were shown by IMERG south of Mangkhut’s track in the Philippine Sea.
By Harold F. Pierce
NASA Goddard Space Flight Center
Sep. 18, 2018 – 7-Day Animation of Mangkhut Affecting the Philippines
In the past week, Typhoon Mangkhut has affected the Philippines, mainland China, and Hong Kong, as shown in this 7-day animation of NASA’s satellite-based IMERG precipitation product.
The upper frame shows the storm-total accumulation starting at 0000 UTC on September 11, 2018 (8 p.m. EDT on Sept. 10). Storm-total accumulations in excess of 4 inches stretched from Manila to the northern tip of Luzon Island where the rainfall triggered deadly landslides.
The lower frame shows the short-term accumulation in a 3-hour period that slides from the beginning to the end of the 7-day-long movie. The sliding 3-hour accumulation clearly shows how Mangkhut’s compact eyewall prior to its Philippines landfall was replaced by a much larger, ragged eyewall thereafter. In some cases, interactions with mountainous islands greatly reduce a tropical cyclone’s rainfall, but in this case, Typhoon Mangkhut was too powerful to succumb to these mountain interactions.
NASA’s GPM or Global Precipitation Measurement mission satellite provides information on precipitation from its orbit in space. GPM is a joint mission between NASA and the Japan Aerospace Exploration Agency or JAXA. GPM also utilizes a constellation of other satellites to provide a global analysis of precipitation that are used in the IMERG calculation.
At NASA’s Goddard Space Flight Center in Greenbelt, Maryland, those data are incorporated into NASA’s IMERG or Integrated Multi-satellitE Retrievals for GPM. IMERG is used to estimate precipitation from a combination of passive microwave sensors, including the Global Precipitation Measurement (GPM) mission’s core satellite’s GMI microwave sensor and geostationary IR (infrared) data. IMERG real-time data are generated by NASA’s Precipitation Processing System every half hour and are normally available within six hours.
For more information about IMERG, please visit https://pmm.nasa.gov/.
For storm history and NASA images on Mangkhut, visit:
https://blogs.nasa.gov/hurricanes/2018/09/10/mangkhut-nw-pacific-ocean-2018/
Credit: NASA/JAXA/NASA Goddard Scientific Visualization Studio
Sep. 17, 2018 – Warnings Were Up for Hong Kong for Typhoon Mangkhut After Landfall
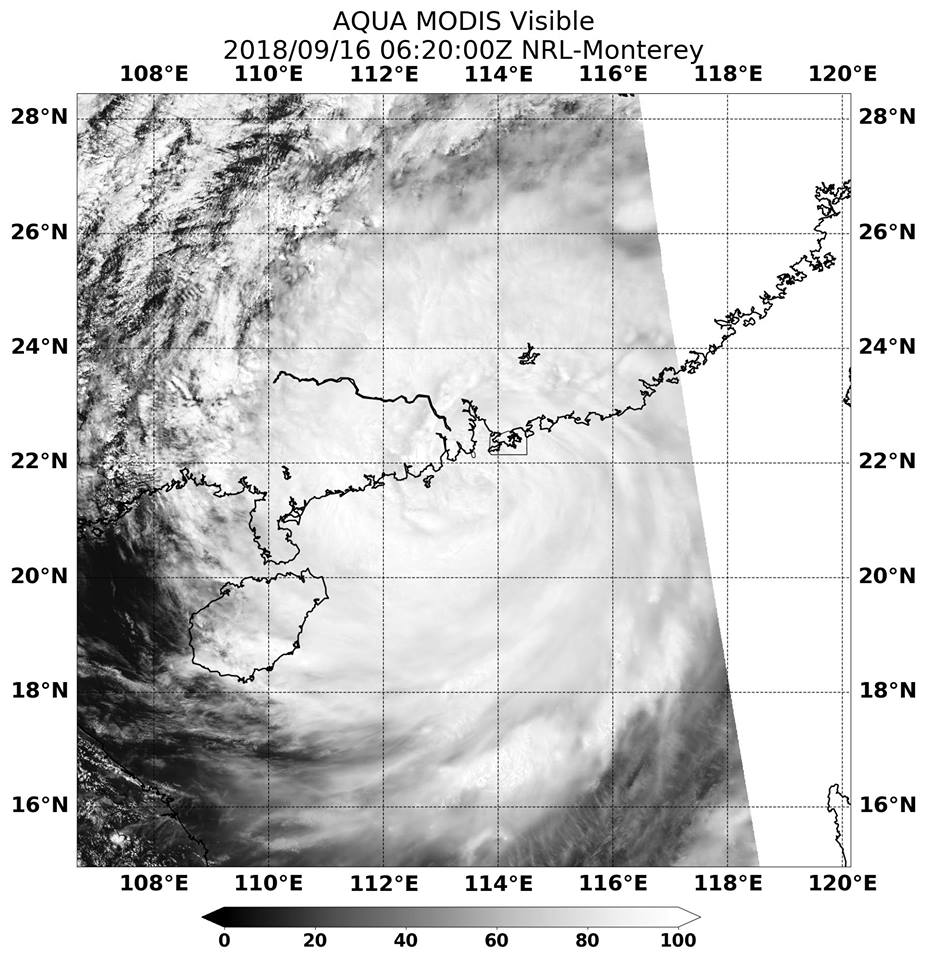
On Sunday, Sept. 16, Typhoon Mangkhut had made landfall in southern China and Hurricane signal #10 was still in force. NASA’s Aqua satellite passed over the storm and captured an image that showed the storm after landfall.
A Red Alert, the most severe warning was issued by authorities in southern China.
At 5 a.m EDT (0900 UTC) on Sunday, Sept. 16, Mangkhut was centered near 21.6 north latitude and 113.6 east longitude, about 54 miles southwest of Hong Kong. Mangkhut was moving to the west-northwest at 17 knots and had maximum sustained winds 80 knots (92 mph/148 kph)
NASA’s Aqua satellite provided a visible look at the storm on Sept. 16 on 2:20 a.m. EDT (0620 UTC) after it made landfall in China. The image showed the cloud-filled center of the storm over the coast. The storm brought surges as high as 3 meters (approx. 9 feet) around Hong Kong.
On Sunday evening, local time, Typhoon Mangkhut made landfall in southern China’s Guangdong province.
After landfall, the storm moved inland and continued to weaken, dropping very heavy rainfall.
By Rob Gutro
NASA Goddard Space Flight Center
Sep. 14, 2018 #2 – Typhoon Mangkhut Reaches Luzon
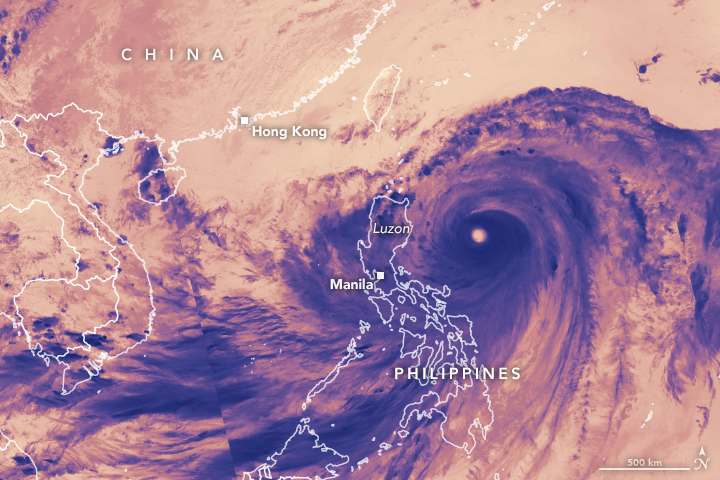
In the early hours of September 15, 2018, Super Typhoon Mangkhut (Ompong) blew into Cagayan Province near the northern tip of Luzon, one of the most populated of the Philippine islands. Local reports described wind speeds of 205 kilometers (130 miles) per hour. The storm stretched nearly 900 kilometers (600 miles) across, with an eye 50 kilometers (30 miles) wide. It is the strongest tropical cyclone in any ocean basin so far this year.
For more on this story visit: https://earthobservatory.nasa.gov/images/92761/typhoon-mangkhut-reaches-luzon?src=eoa-iotd
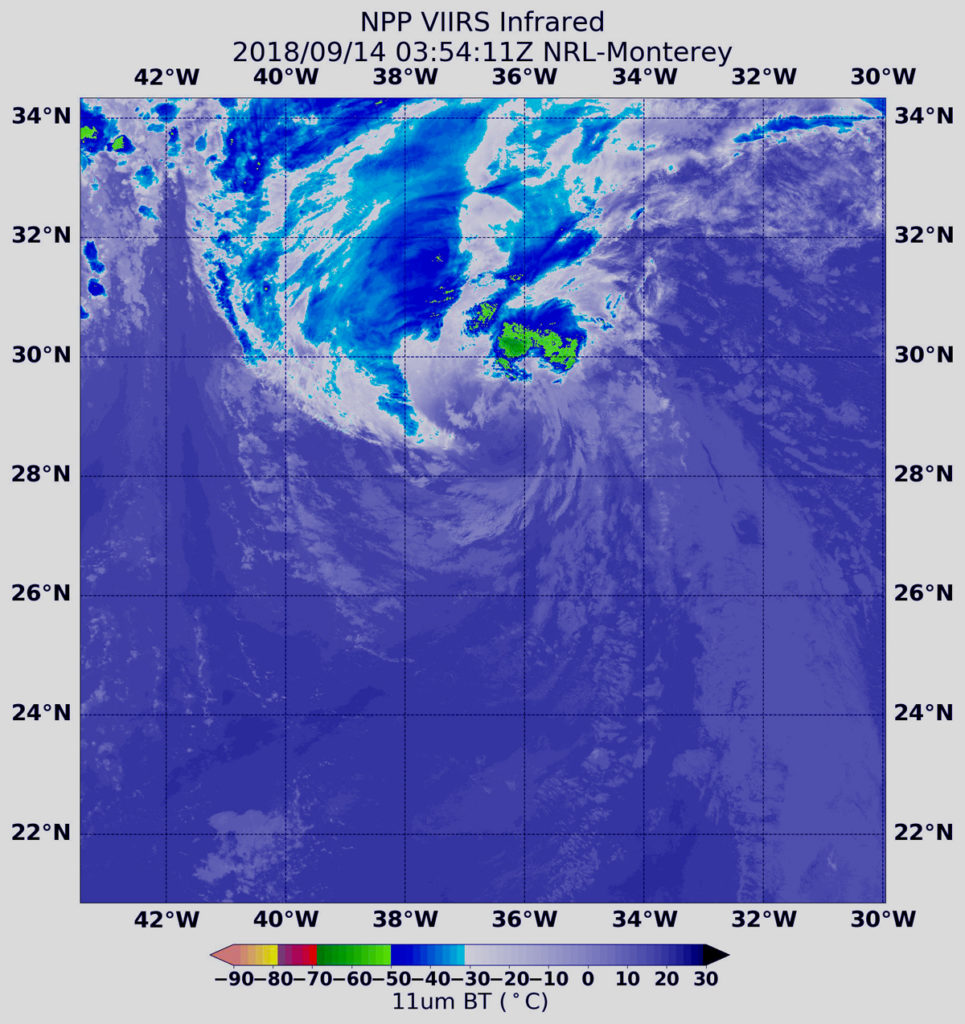
Sep. 14, 2018 #1 – NASA Sees Dangerous Super Typhoon Mangkhut, Eyeing the Philippines
Super Typhoon Mangkhut is a powerful tropical cyclone headed toward the northern Philippines. It is a Category 5 storm on the Saffir-Simpson hurricane wind scale. NASA-NOAA’s Suomi NPP satellite provided a visible image as it passed over the Northwestern Pacific Ocean and stared the storm in its eye.
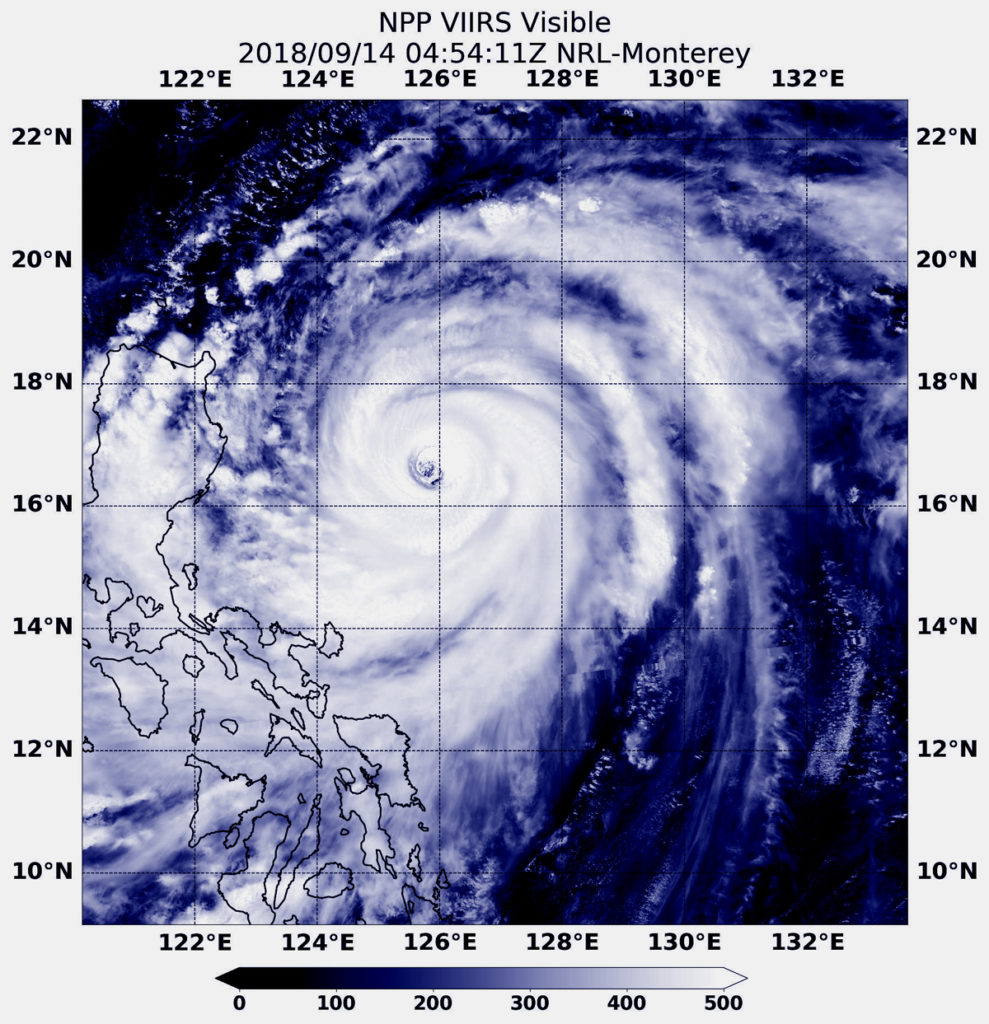
Many warnings are posted in the Philippines. They include: Public storm warning signal #3 for the Luzon provinces of Batanes, southern Isabela, Ilocos Sur, La Union, Mountain Province, Benguet, Ifugao, Nueva Vizcaya, Quirino, Northern Aurora. Public storm warning signal #2 is in effect for the Luzon provinces of Pangasinan, Tarlac, Nueva Ecija, southern Aurora, Zambales, Pampanga, Bulacan, Northern Quezon incl. Polillo Island. Public storm warning signal #1 is in effect for the Luzon provinces of Bataan, Rizal, Metro Manila, Cavite, Batangas, Laguna, Rest of Quezon, Lubang Is.,Marinduque, Camarines Norte, Camarines Sur, Catanduanes, Albay, Burias Island.
In the Philippines, Mangkhut is known locally as Ompong.
At 12:54 a.m. EDT (0454 UTC) on Sept. 14, the VIIRS instrument aboard NASA’s Aqua satellite captured a visible image of Mangkhut. The image showed a symmetrical storm with a clear eye surrounded by powerful thunderstorms. At the time of the image, the western quadrant of the storm was already spreading over the eastern Philippines.
The Joint Typhoon Warning Center noted on Sept. 14 at 11 a.m. EDT (1500 UTC) Barijat’s maximum sustained winds were near 167 mph (145 knots/268 kph). It was located near 17.4 degrees north latitude and 124.4 east longitude. That’s approximately 245 nautical miles northeast of Manila, Philippines. Mangkhut is moving to the west-northwest.
Mangkhut is moving northwest and is forecast to pass over the north of Luzon as a category 5 equivalent typhoon. After re-emerging over water, the system is forecast to re-strengthen slightly to pass close the south coast of China towards a landfall in northern Vietnam.
By Rob Gutro
NASA Goddard Space Flight Center
Sep. 13, 2018 – NASA Satellite Analyzes Powerful Super Typhoon Mangkhut
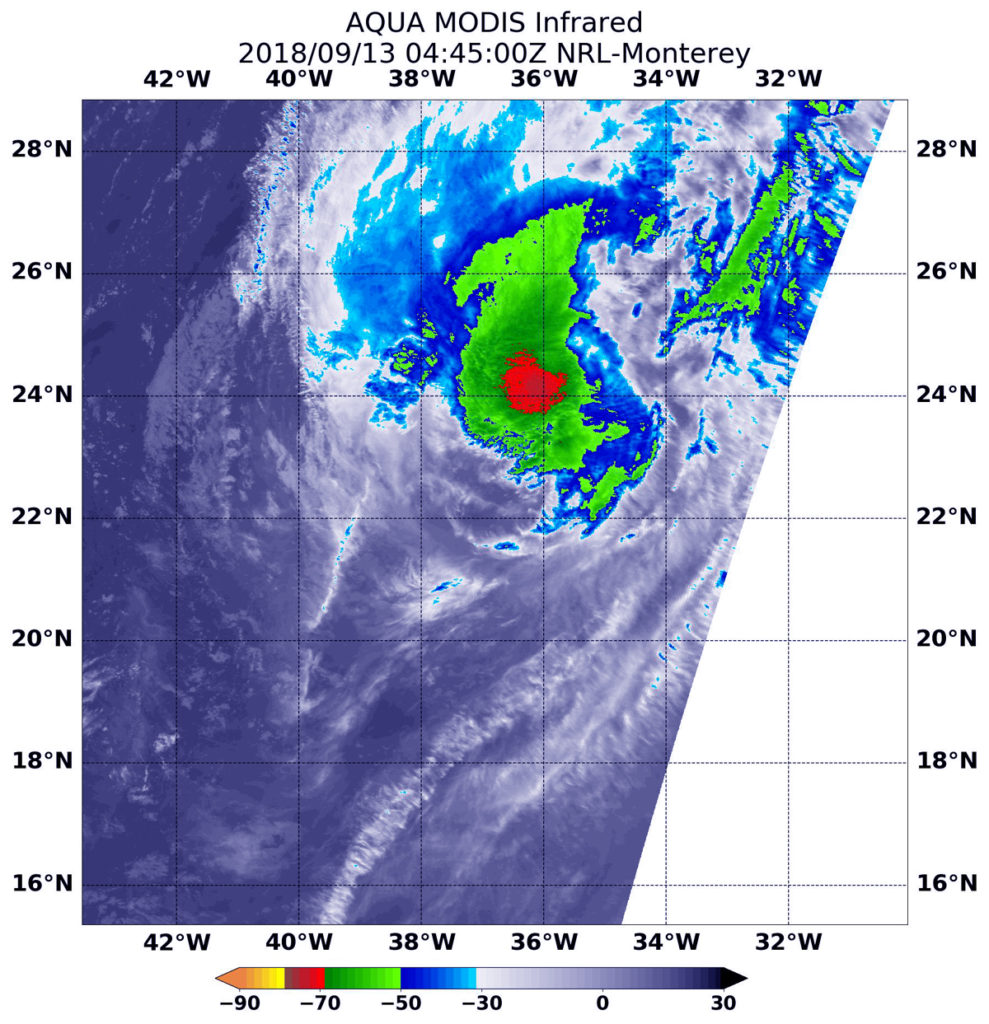
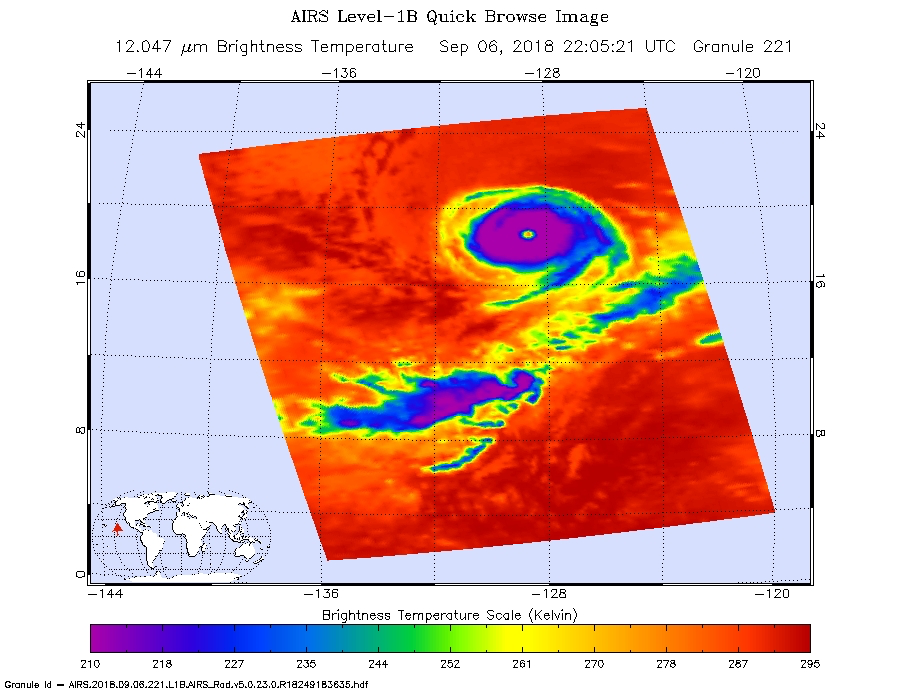
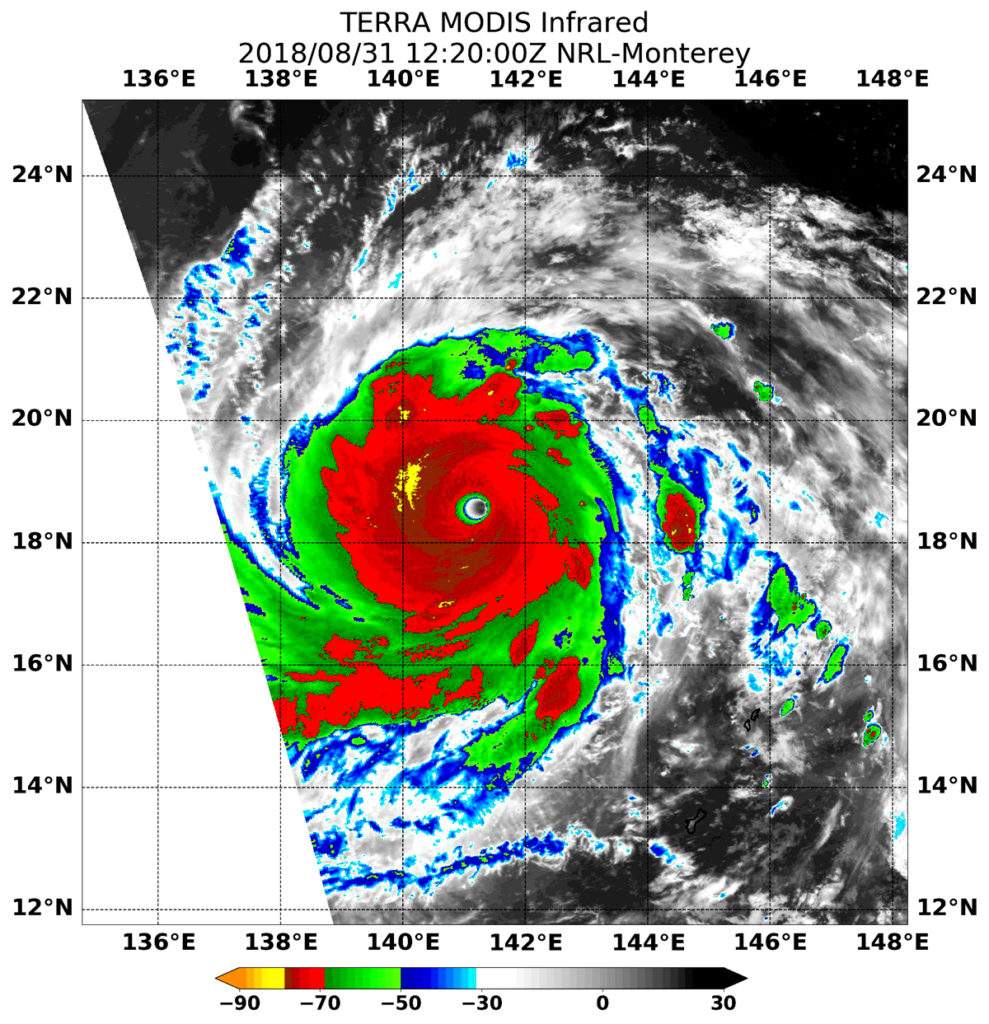
NASA’s Aqua satellite provided an infrared look at powerful Super Typhoon Mangkhut early on Sept. 13 that revealed a large eye surrounded by a large area of powerful storms. Mangkhut is a Category 5 storm.

The Joint Typhoon Warning Center noted that “animated enhanced infrared satellite imagery shows deepening or strengthening convection (rising air that forms the thunderstorms that make up a tropical cyclone) with colder cloud tops.” Colder cloud tops mean that the uplift of air has strengthened and pushed cloud tops higher in the troposphere. The higher and colder the cloud top, the stronger the storm and the greater potential for heavier rainfall.
At 9:35 a.m. EDT (1335 UTC) on Sept. 13, the MODIS instrument aboard NASA’s Aqua satellite looked at Typhoon Mangkhut in infrared light as it was approaching the Philippines. MODIS saw that Mangkhut has a 27 nautical-mile-wide eye.
MODIS also found coldest cloud top temperatures around the eye, as cold as or colder than minus 80 degrees Fahrenheit (F)/minus 112 degrees Celsius (C). Surrounding the eye were thick rings of powerful storms with cloud tops as cold as or colder than minus 70F (minus 56.6C).
NASA research has found that cloud top temperatures as cold as or colder than the 70F/56.6C threshold have the capability to generate heavy rainfall.
At 11 a.m. EDT (1500 UTC), the center of Super Typhoon Mangkhut was located near latitude 15.2 degrees north and longitude 128.4 degrees west. That’s about 465 miles east of Manila, Philippines. Super Typhoon Mangkhut was moving toward the west-northwest. Mangkhut’s maximum sustained winds were near 167 mph (145 knots/268 kph) with higher gusts. Mangkhut is a Category 5 hurricane on the Saffir-Simpson hurricane wind scale.
Mangkhut is forecast to make landfall along the northeast coast of Luzon, Philippines around 5 p.m. EDT (2100 UTC) on Sept. 14. Warnings are already in effect.
By Rob Gutro
NASA Goddard Space Flight Center
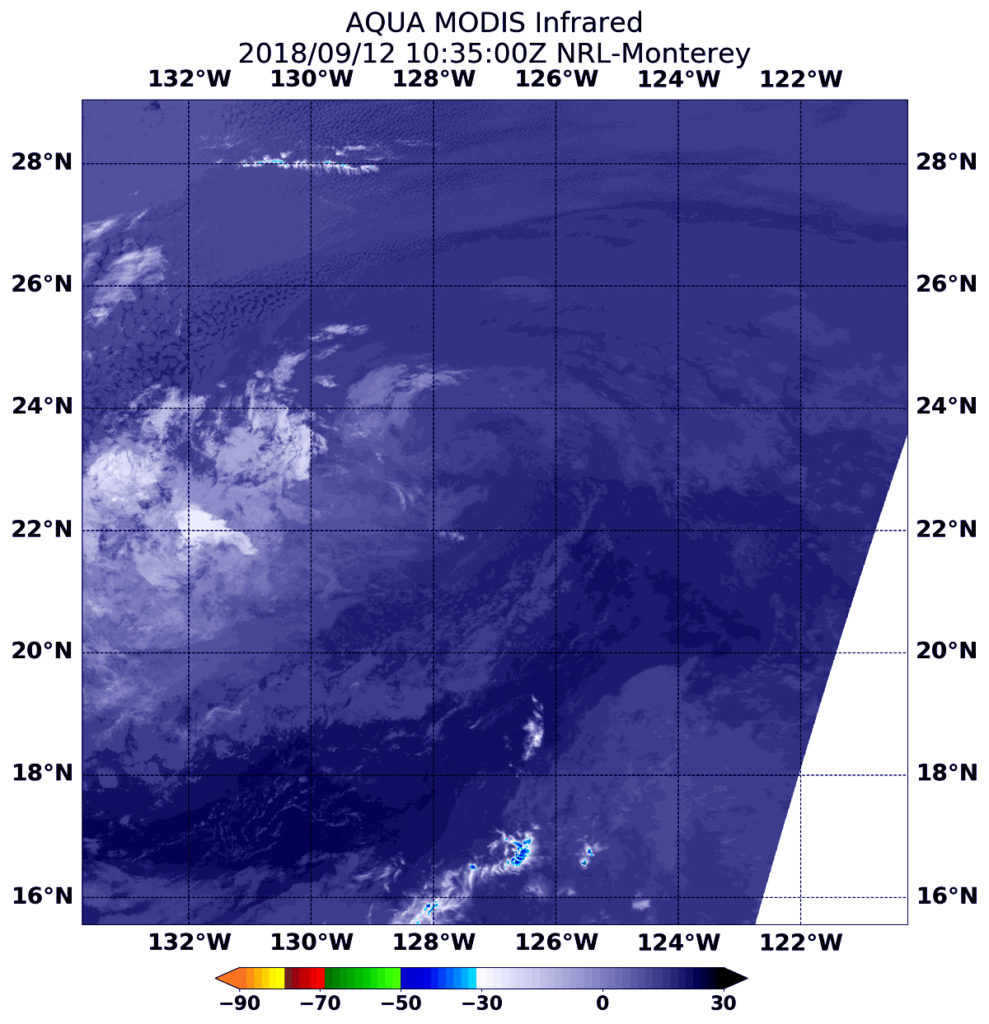
Sep. 12, 2018 – NASA-NOAA Satellite Stares Down Super Typhoon Mangkhut’s Eye
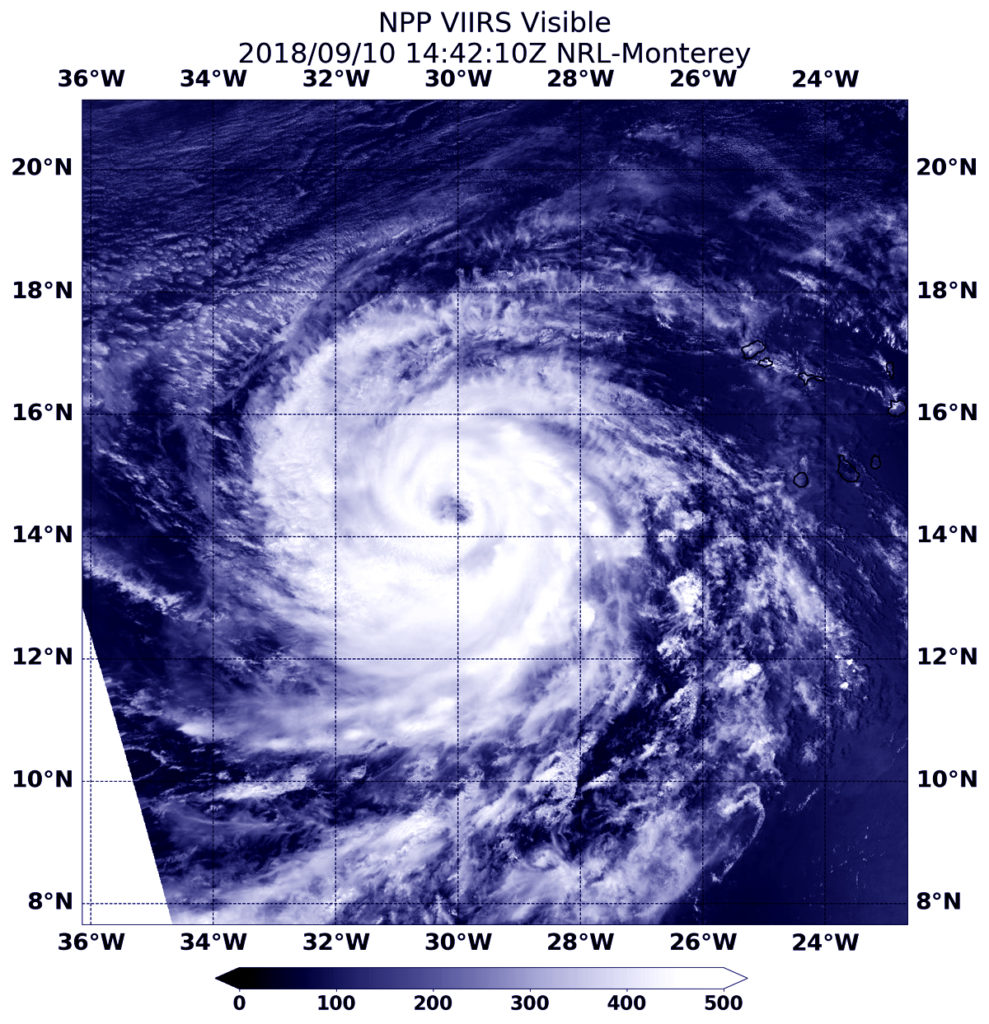
NASA-NOAA’s Suomi NPP satellite passed directly over Super Typhoon Mangkhut from space and stared down its almost 30 nautical-mile-wide eye to the waters of the Northwestern Pacific Ocean. Mangkhut is threatening the northern Philippines where is known as Ompong.
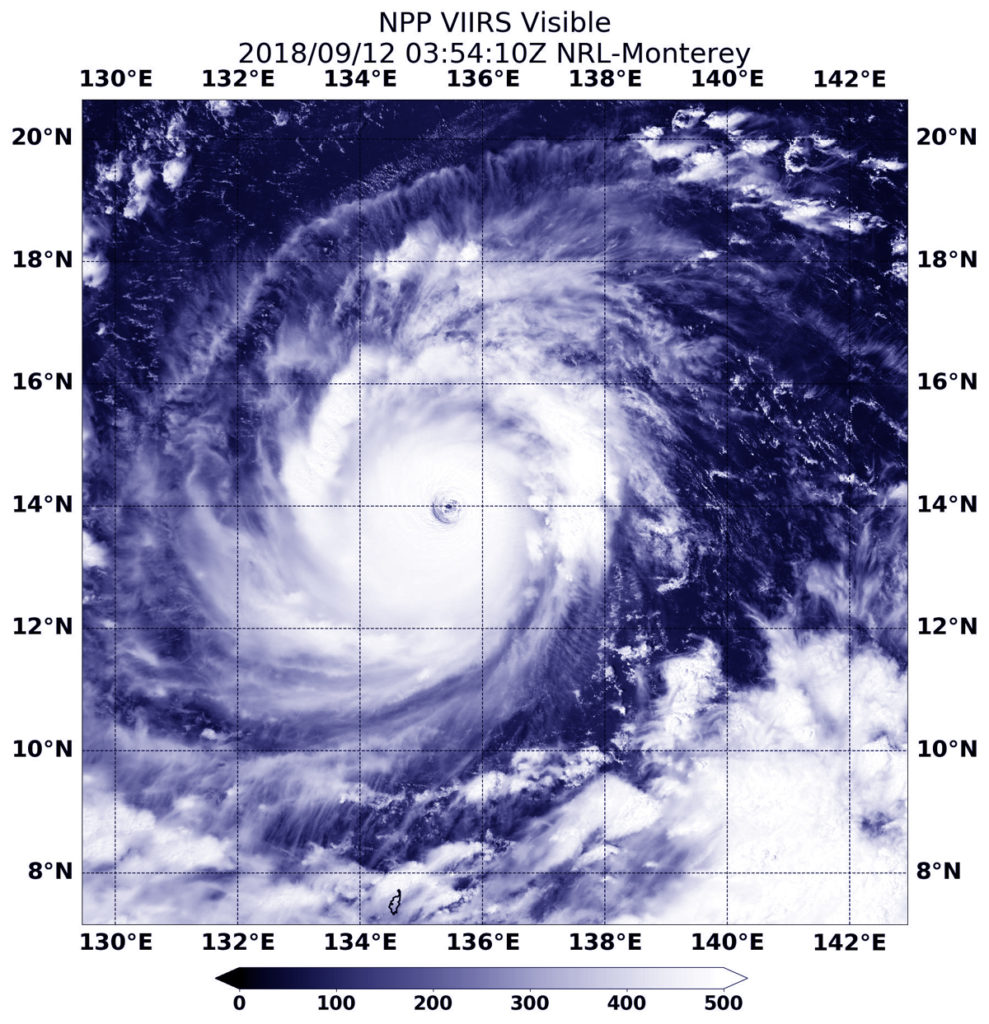
At 10 a.m. EDT (10 p.m. local time, Philippines) on Sept. 12, the eye of Typhoon Mangkhut was located approximately 1,005 km East of Virac, Catanduanes, Philippines near 14.3 degrees north latitude and 133.5 degrees east longitude. Maximum sustained winds were near 172 mph (150 knots/277 kph).
The Philippine Atmospheric, Geophysical, and Astronomical Services Administration (PAGASA) noted that the typhoon continues to threaten Northern Luzon.
On Sept. 13 at 11 a.m. local time (11 a.m. EDT), PAGASA noted that “the province of Catanduanes and Camarines Sur will experience the peripheral effects of Mangkhut within the next day and a half, bringing occasional rains and gusty winds. Possible inclusion to Tropical Cyclone Warning Signal (TCWS) #1over the provinces of Cagayan, Isabela, Aurora, Quirino, Pollilo Islands, Camarines Norte and Albay tomorrow morning (September 13).”
Visible imagery on Sept. 12 at 11:44 p.m. EDT (Sept. 12 at 0354 UTC from the Visible Infrared Imaging Radiometer Suite (VIIRS) instrument aboard NASA-NOAA’s Suomi NPP satellite showed that Mangkhut had a clear eye that enabled the satellite to see through it all the way to the surface of the Northwestern Pacific Ocean. Mangkhut was surrounded by a thick ring of powerful, rotating thunderstorms. The Joint Typhoon Warning Center noted that satellite imagery shows a symmetric and highly consolidated system with strong, compact feeder bands (bands of thunderstorms) spiraling tightly into a sharply-outlined 29 nautical mile wide eye.
The storm is expected to make landfall in the northern tip of Cagayan on Saturday, September 15 and make a second landfall south of Hong Kong, China on Sept. 16.
For updated forecasts, visit PAGASA at: http://bagong.pagasa.dost.gov.ph/tropical-cyclone/severe-weather-bulletin
By Rob Gutro
NASA’ Goddard Space Flight Center
Sep. 11, 2018 – NASA-NOAA Satellite Tracking Super Typhoon Mangkhut
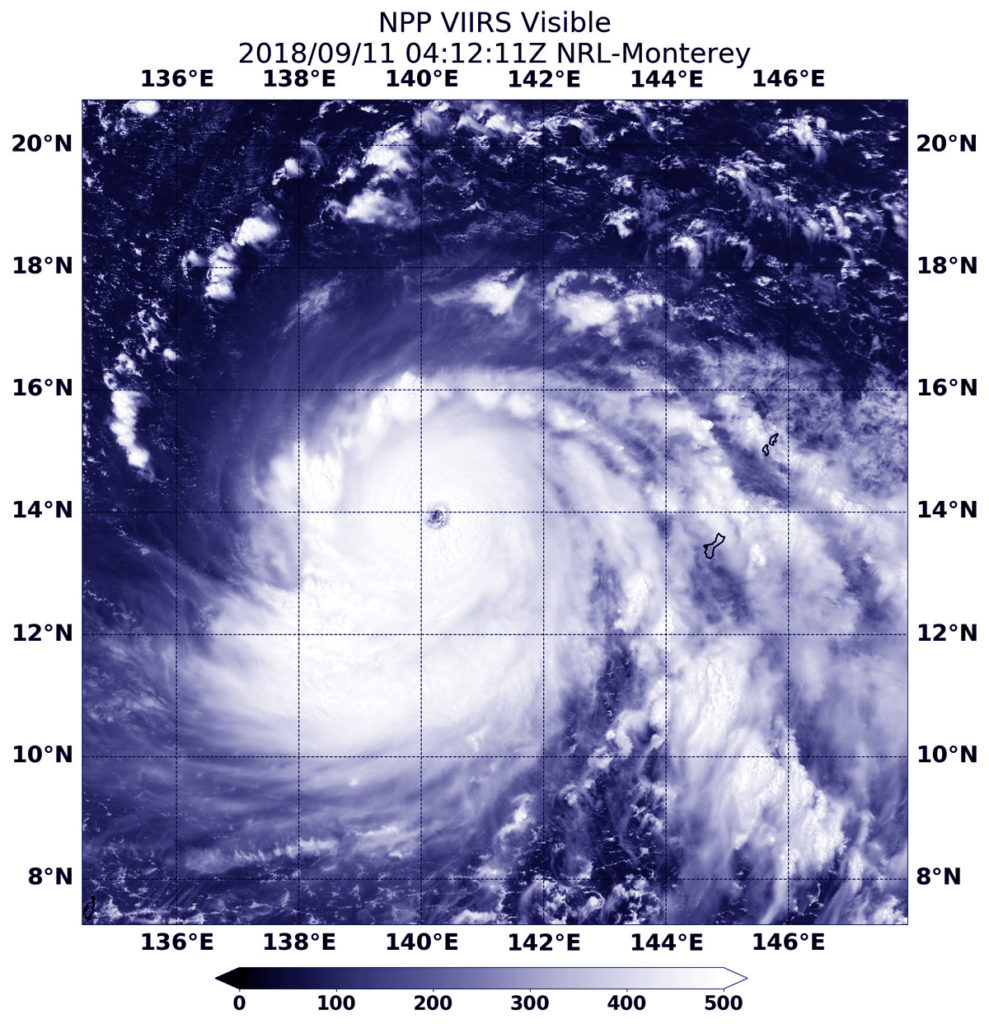
Typhoon Mangkhut had already strengthened into a Super Typhoon when NASA-NOAA’s Suomi NPP satellite grabbed a visible image of the storm in the Northwestern Pacific Ocean on Sept. 11. It is forecast to intensify even more.
Fortunately, Mangkhut has moved away from the Marianas Islands and is moving over open ocean so there are no watches or warnings in effect.
On Sept. 11 at 12:12 a.m. EDT (0412 UTC) the Visible Infrared Imaging Radiometer Suite (VIIRS) instrument aboard NASA-NOAA’s Suomi NPP satellite captured visible image of Super Typhoon Mangkhut. The image showed a clear eye surrounded by bands of powerful thunderstorms.
At 5 a.m. EDT (7 p.m. CHST/0900 UTC) on Sept. 11, the eye of Super Typhoon Mangkhut was located near latitude 14.0 degrees north and longitude 139.1 degrees east. That’s about 380 miles west of Guam. Mangkhut is moving west at 17 mph. This westward motion is expected to continue tonight, followed by a turn to the west-northwest on Wednesday and Thursday, bringing Mangkhut near northern Luzon Friday evening.
The National Weather Service in Tiyan, Guam noted that “Maximum sustained winds have increased to 155 mph, making Mangkhut a Category 4 super typhoon. Mangkhut is expected to intensify into a Category 5 super typhoon Wednesday and Thursday.”
Typhoon force winds extend up to 65 miles from the center. Tropical storm force winds extend up to 205 miles northeast of the center and up to 165 miles to the southwest.
By Rob Gutro
NASA’ Goddard Space Flight Center
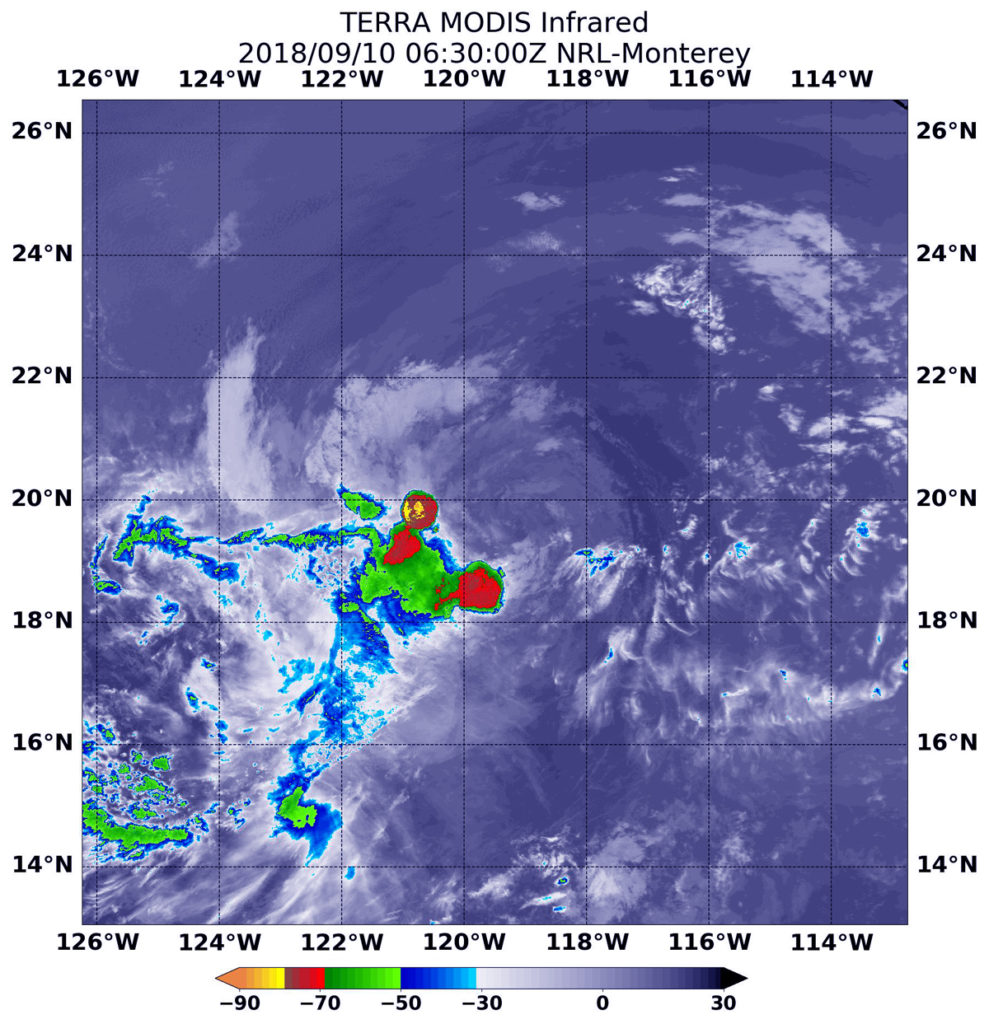
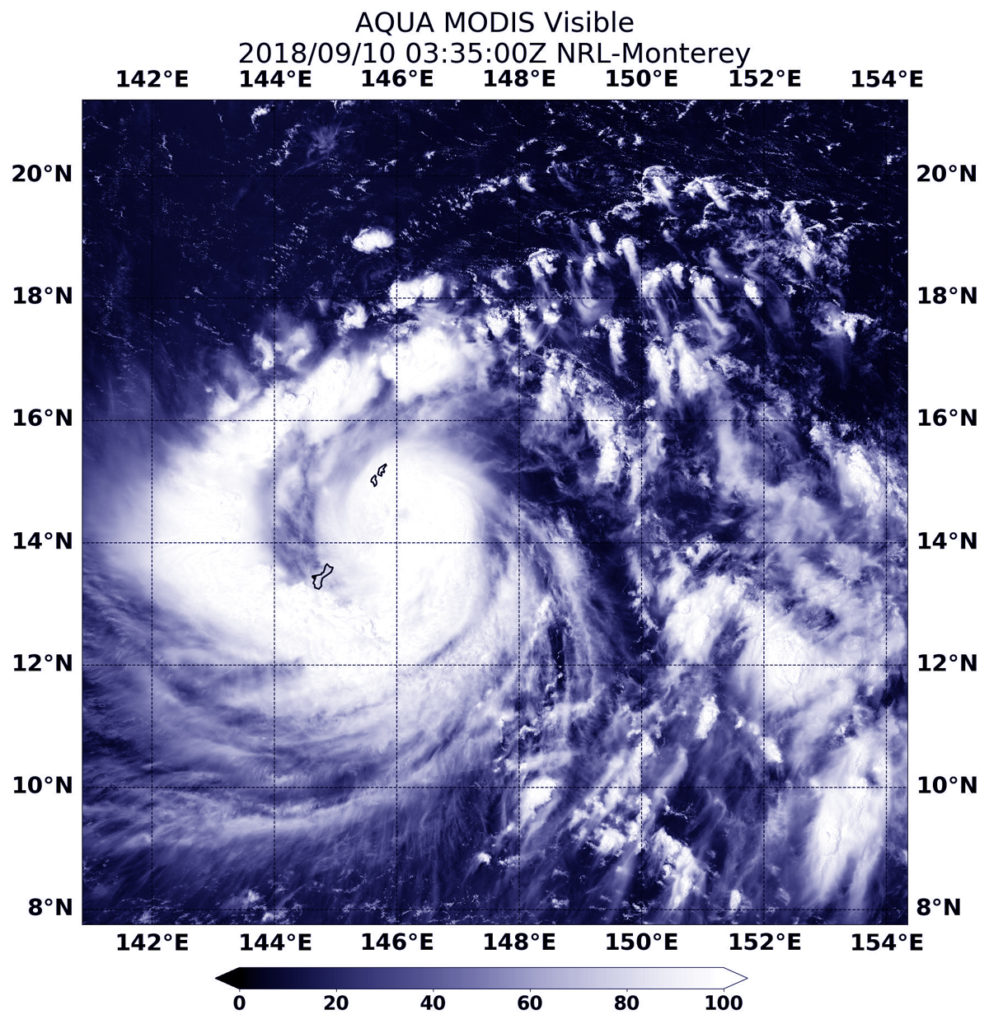
Sep. 10, 2018 – NASA Finds Typhoon Mangkhut Lashing Guam and the Northern Marianas Islands
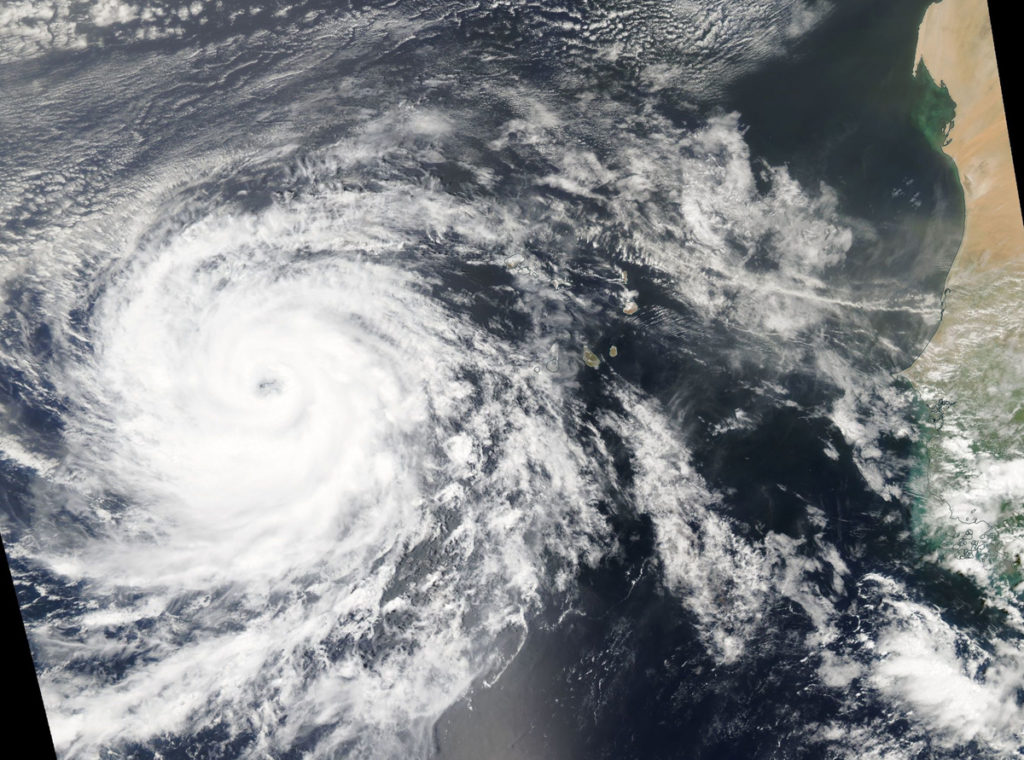
NASA’s Aqua satellite passed over the Northwestern Pacific Ocean and captured a visible image of Typhoon Mangkhut lashing Guam and the Northern Marianas Islands.
On Sept. 7 when Mangkhut formed as a tropical depression it was known as Tropical Depression 26W. On the day it formed, a tropical storm watch was posted for Enewetak. 26W then moved west toward Micronesia and strengthened into a typhoon.
On Sept. 10, the National Weather Service (NWS) in Tiyan, Guam said a Typhoon Warning remains in effect for Guam, Rota, Tinian, Saipan and adjacent coastal waters in the Mariana Islands. Guam is a U.S. island territory in Micronesia.
At 0335 UTC on Sept.10 (11:35 p.m. EDT on Sept. 9) the Moderate Resolution Imaging Spectroradiometer or MODIS instrument aboard NASA’s Aqua satellite provided a visible image of Typhoon Mangkhut. Satellite imagery shows the center over the Northern Mariana Islands and a thick band of thunderstorms wrapping from south of the center to the west past Guam.
At 5 a.m. EDT on Sept. 10 (7 p.m. CHST local time), the NWS in Guam noted that “Damaging or destructive winds are now occurring. Damaging south winds of up to 105 mph with gusts to 120 mph will continue for the next few hours. Winds will gradually decrease to between 55 and 65 mph around midnight. Damaging south winds early Tuesday morning will decrease to 25 to 35 mph by the afternoon. Small craft should remain in port and well secured.”
At 11 a.m. EDT (1 a.m. CHST/1500 UTC) the center of Typhoon Mangkhut was located near Latitude 14.1 degrees north and longitude 143.5 degrees east. That’s about 95 miles west-northwest of Guam, 115 miles west of Rota, 155 miles west-southwest of Tinian and about 165 miles west-southwest of Saipan.
Typhoon Mangkhut is moving toward the west at 17 mph. It is expected to make a slight turn to the west-northwest with a decrease in forward speed over the next few days.Maximum sustained winds remain at 115 mph. Typhoon Mangkhut (26W) is forecast to intensify through Wednesday, Sept 12.
Typhoon force winds extend outward from the center up to 50 miles. Tropical storm force winds extend outward from the center up to 180 miles to the north and up to 120 miles to the south.
Mangkhut is forecast to move on a westerly track and move away from Guam and the Marianas while strengthening.
Updated forecasts can be found at: http://www.prh.noaa.gov/guam/cyclone.php