July 31, 2019 – NASA Casts a Double Eye on Hurricane Flossie
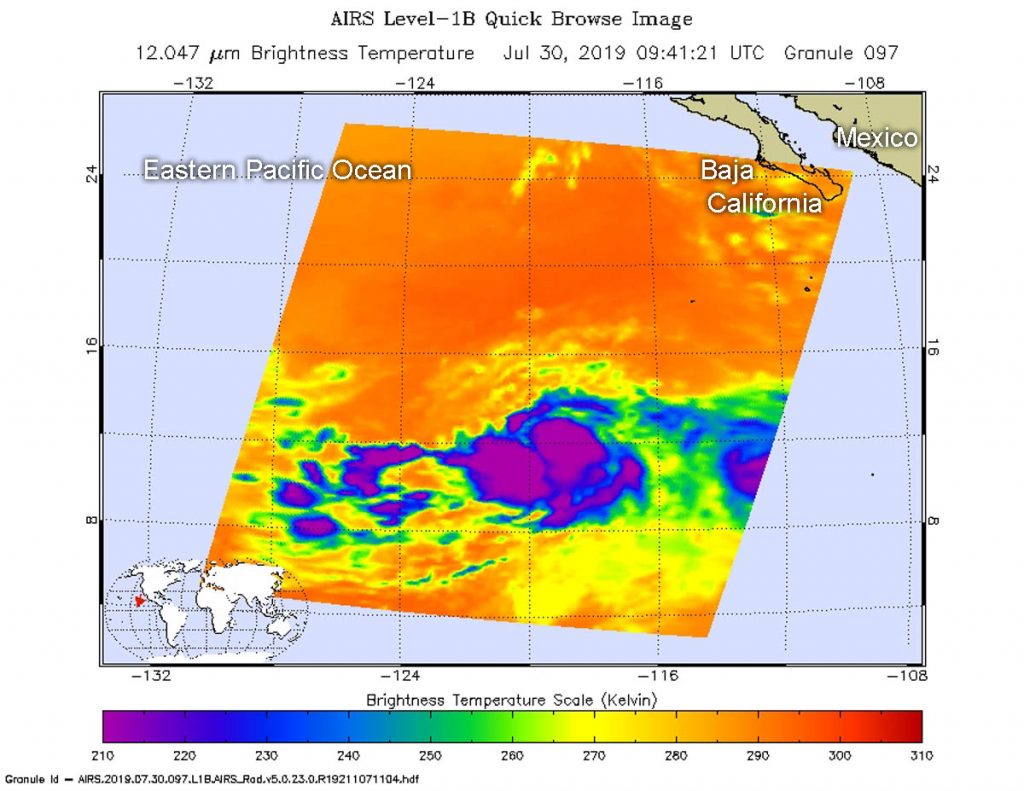
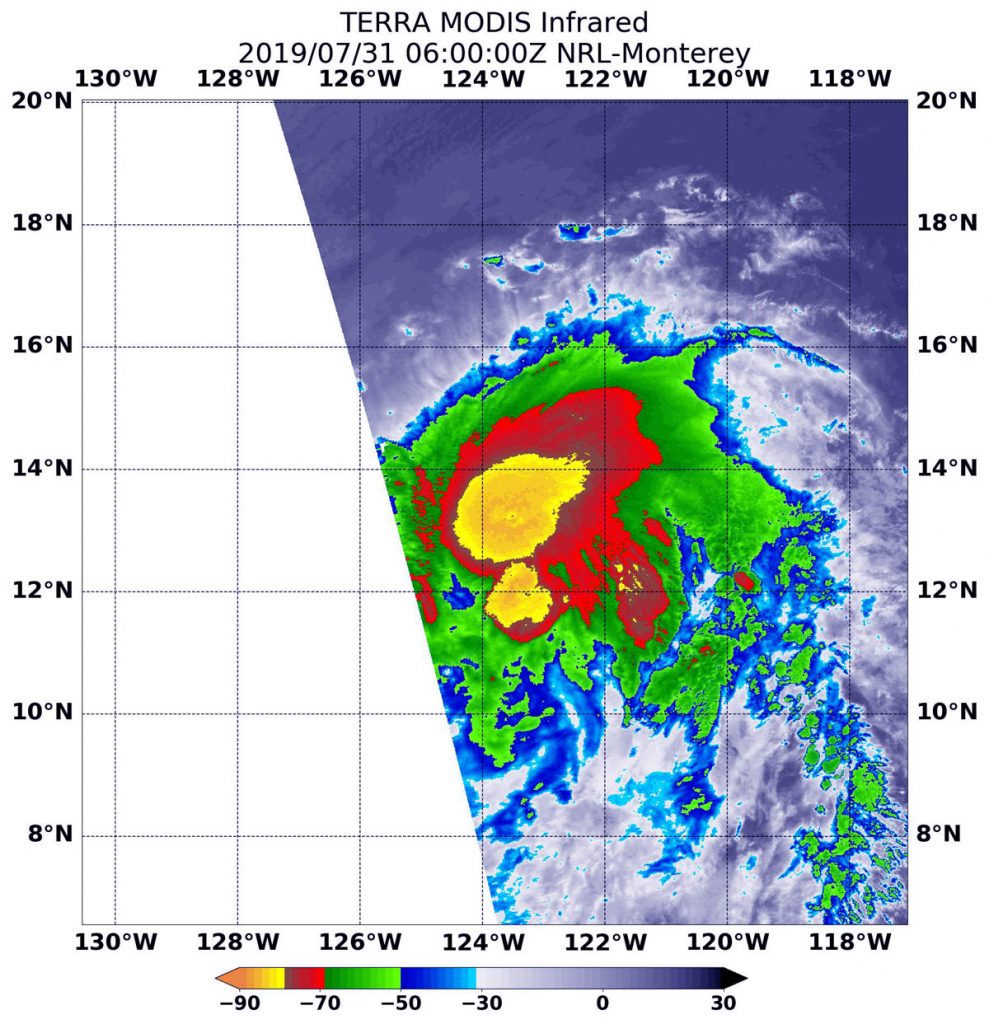
NASA’s Aqua and Terra satellites provided infrared views of Flossie before and after it became a hurricane while moving through the Eastern Pacific Ocean. Both satellites analyzed Flossie’s cloud top temperatures and structure as the storm strengthened.

On July 30 at 5:41 a.m. EDT (0941 UTC) infrared data and cloud top temperatures were obtained in then Tropical Storm Flossie, using the Atmospheric Infrared Sounder or AIRS instrument. AIRS found coldest cloud top temperatures as cold as or colder than minus 63 degrees Fahrenheit (minus 53 degrees Celsius) around the center of circulation and in a large area west of the center. The stronger the storms, the higher they extend into the troposphere, and they have the colder cloud temperatures.
Flossie continued to strengthen after Aqua passed overhead, and by 5 p.m. EDT (11 a.m. HST/2100 UTC) on July 30, it became a hurricane.
On July 31 at 6:35 a.m. EDT (1035 UTC),the Moderate Imaging Spectroradiometer or MODIS instrument that flies aboard NASA’s Terra satellite gathered infrared data on Flossie after it became a hurricane. Like the AIRS image the previous day, there were two areas of strongest storms. In the Terra imagery, the strongest storms were also colder and clouds tops higher in the troposphere than they were in the July 30 AIRS imagery.

On July 31, the strongest storms were located around the center and in a band of thunderstorms southwest of the center where cloud top temperatures were as cold as minus 80 degrees Fahrenheit (minus 62.2 Celsius). Cloud top temperatures that cold indicate strong storms with the potential to generate heavy rainfall.
At 11 a.m. EDT (5 a.m. HST/1500 UTC) the center of Hurricane Flossie was located near latitude 14.0 degrees north latitude and longitude 125.8 degrees west. Flossie is moving toward the west-northwest near 15 mph (24 kph). A west-northwestward to westward motion at a similar forward speed is anticipated for the next several days.
Maximum sustained winds have decreased to near 75 mph (120 kph) with higher gusts. Flossie is expected to weaken to tropical-storm strength later today. Hurricane-force winds extend outward up to 30 miles (45 km) from the center and tropical-storm-force winds extend outward up to 105 miles (165 km).
The National Hurricane Center said that re-strengthening is possible later this week, and Flossie is forecast to become a hurricane again in a few days.
For forecast updates, visit: www.nhc.noaa.gov.
