Nov. 08, 2019 – NASA Finds a Stronger Matmo Headed for Landfall
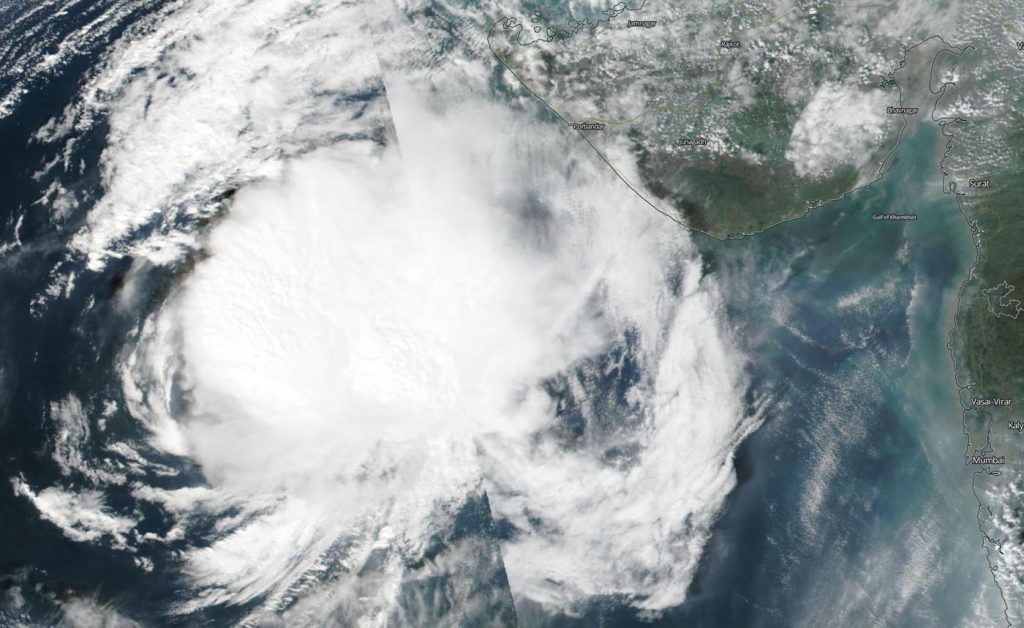
Matmo strengthened from a tropical storm to a storm with hurricane-force in the overnight hours of Nov. 7 into Nov. 8. NASA-NOAA’s Suomi NPP satellite passed over the Bay of Bengal, Northern Indian Ocean and found Matmo appeared more organized. Warnings are in effect in northeastern India and Bangladesh as Matmo approaches.
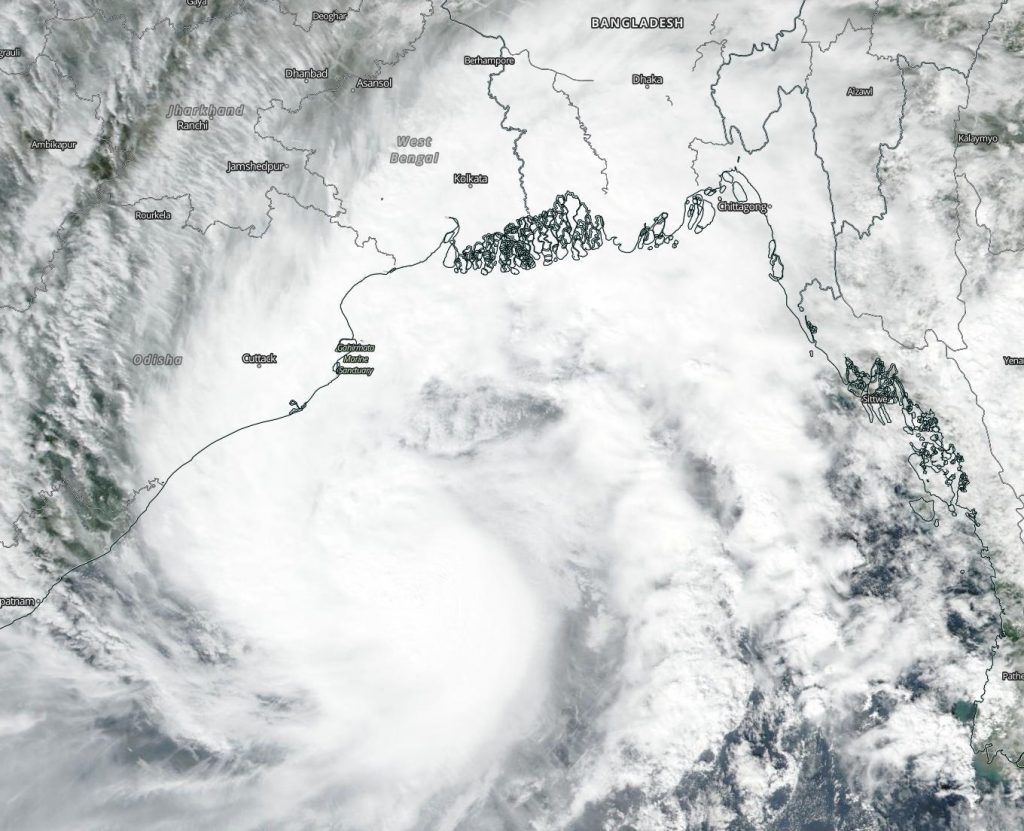
Visible imagery from the Visible Infrared Imaging Radiometer Suite (VIIRS) instrument aboard NASA-NOAA’s Suomi NPP satellite on Nov. 8 showed Matmo appeared more circular indicating it may have intensified. The imagery also showed a large band on thunderstorms extending north from the center of circulation and over northeastern India and Bangladesh.
The satellite imagery showing better organization complemented the increase in Matmo’s maximum sustained winds. Sustained winds on Nov. 7 were near 55 knots (63 mph/102 kph). On Nov. 8 at 10 a.m. EST (1500 UTC), Matmo’s maximum sustained winds had increased to near 85 knots (98 mph/157 kph). Matmo was located near latitude 19.1 degrees north and longitude 88.1 degrees east, about 235 nautical miles south of Kolkata, India. Matmo is moving to the north.

The India Meteorological Service (IMS) has issued a cyclone watch for the Odisha-West Bengal coasts. Odisha is a state in India. Odisha has 301 miles (485 kilometers) of coastline along the Bay of Bengal from Balasore to Ganjam. West Bengal is on the eastern bottleneck of India. It extends from the Himalayas (in the north) to the Bay of Bengal in the south. IMS said, “Matmo is expected to cross the West Bengal – Bangladesh Coasts between Sagar Islands (West Bengal) and Khepupara (Bangladesh), across Sunderban delta by midnight of November 9 [local time].”
The Joint Typhoon Warning Center expects Matmo to make landfall near the border of India and Bangladesh on Saturday, Nov. 9 and continue moving inland.
Typhoons and hurricanes are the most powerful weather event on Earth. NASA’s expertise in space and scientific exploration contributes to essential services provided to the American people by other federal agencies, such as hurricane weather forecasting.