Sarai – Southern Pacific Ocean

Dec. 31, 2019 – NASA Finds a Weaker Sarai Now a Depression

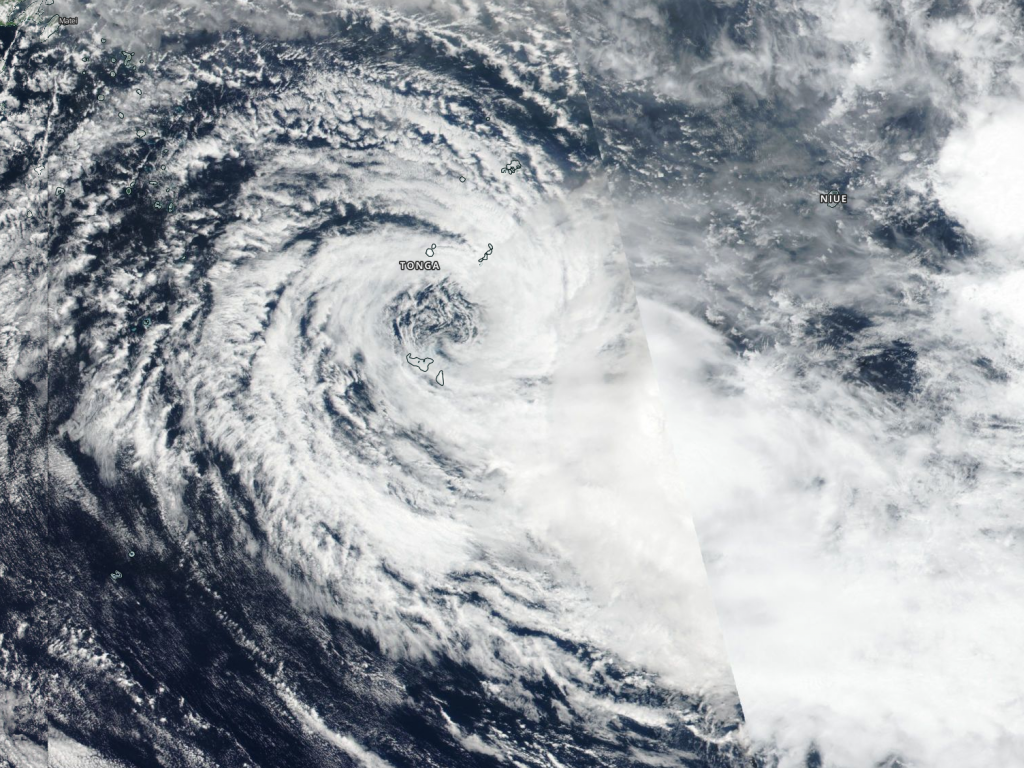
NASA-NOAA’s Suomi NPP satellite provided forecasters with an image of Tropical Cyclone Sarai and it showed a much weaker storm near Tonga in the South Pacific Ocean.
Suomi NPP Image of Sarai
NASA-NOAA’s Suomi NPP satellite provided forecasters with a visible image of Tropical Depression Sarai near the island of Tonga in the South Pacific Ocean. Credit: NASA Worldview, Earth Observing System Data and Information System (EOSDIS)

Visible imagery from NASA satellites help forecasters understand if a storm is organizing or weakening. The Visible Infrared Imaging Radiometer Suite (VIIRS) instrument aboard Suomi NPP provided a visible image of Sarai on Dec. 31.

The shape of a tropical cyclone provides forecasters with an idea of its organization and strength, and NASA-NOAA’s Suomi NPP satellite provided a visible image of Sarai that showed the center of circulation was surrounded by wispy clouds, while the bulk of clouds and showers were pushed to the southeast of the center from outside winds or vertical wind shear. Because the center of circulation was near Tonga, Regional warnings were still in effect for Tonga. A gale warning is in force for Vava’u, Ha’apai, Tongatapu and ‘Eua land areas.

At 4 a.m. EST (0900 UTC), the Joint Typhoon Warning Center issued the final advisory on  Tropical cyclone Sarai as it weakened to a depression. Sarai was centered near latitude 20.3 degrees south and longitude 174.3 degrees west, about 259 miles west-southwest of Niue. The storm is moving to the east-northeast with maximum sustained winds 30 knots  (34.5 mph/55.5 kph).

Sarai is rapidly weakening and is dissipating under adverse atmospheric conditions.

Tropical cyclones and hurricanes are the most powerful weather events on Earth. NASA’s expertise in space and scientific exploration contributes to essential services provided to the American people by other federal agencies, such as hurricane weather forecasting.

By Rob Gutro 
NASA’s Goddard Space Flight Center

Calvinia – Southern Indian Ocean

Dec. 31, 2019 – NASA Finds Tropical Storm Calvinia Moving Away from Mauritius

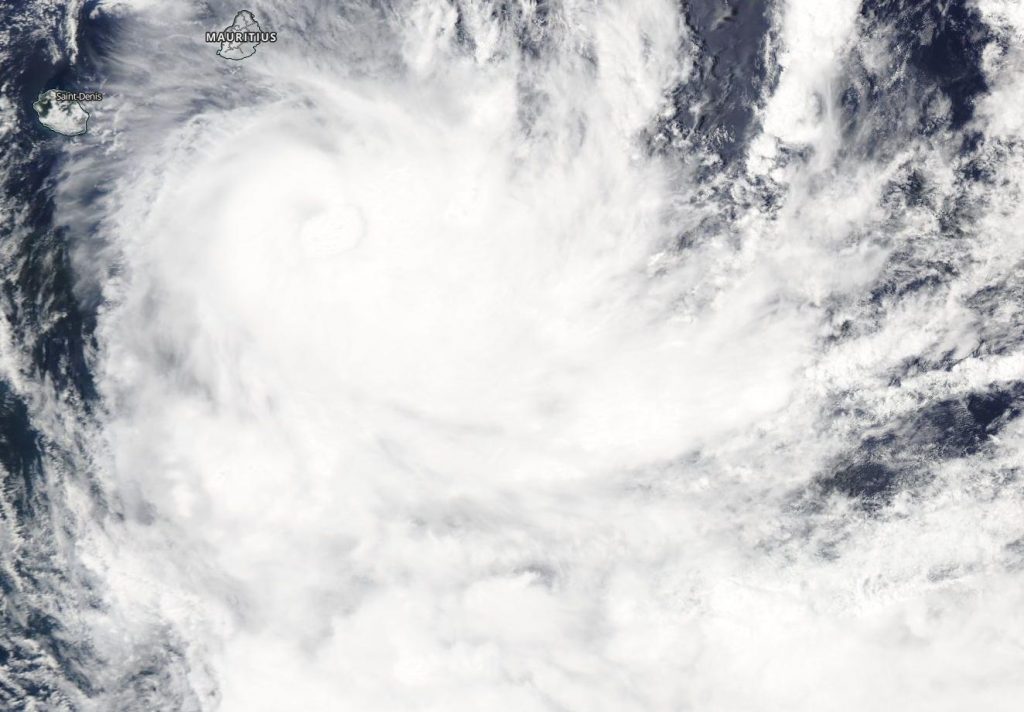
Visible imagery from NASA’s Aqua satellite on Dec. 31 revealed that Tropical Cyclone Calvinia had moved south of the island of Mauritius in the Southern Indian Ocean.

Aqua image of Calvinia
On Dec. 31, 2019, the MODIS instrument that flies aboard NASA’s Aqua satellite provided a visible image of Tropical Storm Calvinia in the Southern Indian Ocean. Credit: NASA Worldview

A tropical cyclone warning class III was still in effect in Mauritius.

On Dec. 31 at 0300 UTC (Dec. 30 at 10 p.m. EST) the Joint Typhoon Warning Center noted that Tropical Cyclone Calvinia was located near latitude 21.1 degrees south and longitude 58.0 degrees east, about 72 nautical miles south-southeast of Port Louis, Mauritius. Maximum sustained winds had increased to 60 knots (69 mph/112 kph).

Later on Dec. 31 the Moderate Resolution Imaging Spectroradiometer or MODIS instrument that flies aboard NASA’s Aqua satellite provided a visible image of Calvinia that showed the storm had a well-rounded shape. The MODIS image revealed bands of thunderstorms spiraling into the tight low-level center of circulation.

Calvinia is forecast to turn to the southeast and strengthen to 65 knots.  After Jan. 1, the storm will start to become extra-tropical.

NASA’s Aqua satellite is one in a fleet of NASA satellites that provide data for hurricane research.

Tropical cyclones and hurricanes are the most powerful weather events on Earth. NASA’s expertise in space and scientific exploration contributes to essential services provided to the American people by other federal agencies, such as hurricane weather forecasting.
By Rob Gutro
NASA’s Goddard Space Flight Center

Sarai – Southern Pacific Ocean

Dec. 30, 2019 – NASA Tracks Tropical Storm Sarai Moving Away from Fiji

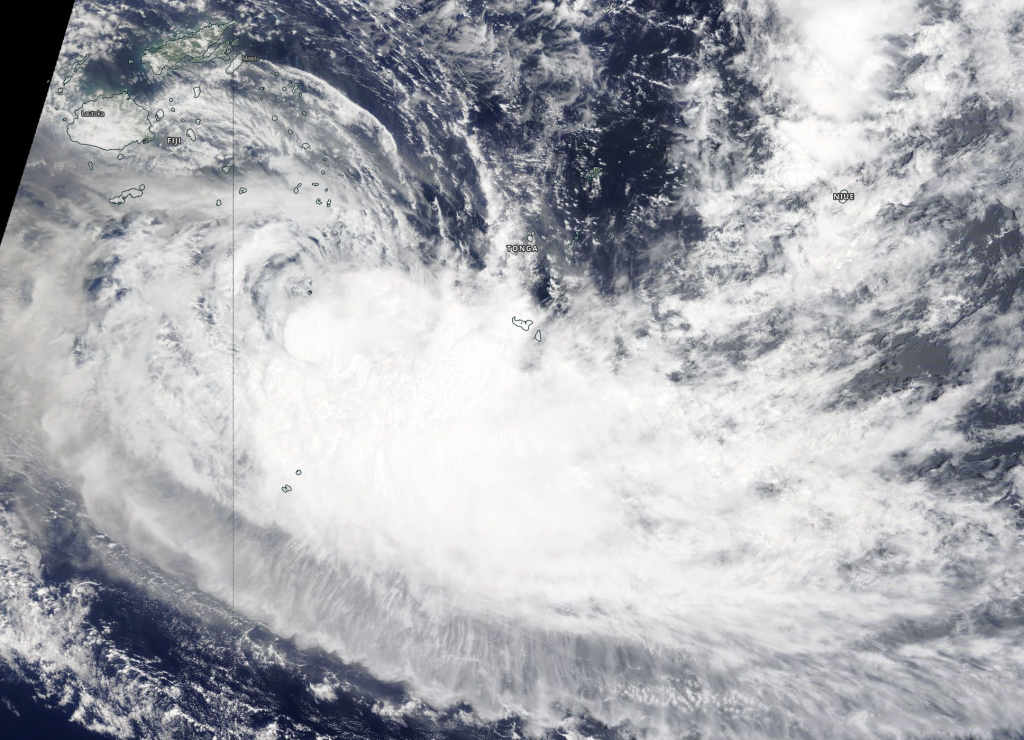
NASA’s Terra satellite passed over the Southern Pacific Ocean on Dec. 30 and found that Tropical Storm Sarai continued to move further away from Fiji and toward Tonga.

Terra image of Sarai
On Dec. 30, 2019, the MODIS instrument that flies aboard NASA’s Terra satellite provided a visible image of Tropical Storm Sarai moving away from Fiji. Credit: NASA Worldview

On Dec. 30, 2019, the Moderate Resolution Imaging Spectroradiometer or MODIS instrument that flies aboard NASA’s Terra satellite provided a visible image of Sarai that showed the storm had flaring convection andthe strongest thunderstorms were around the low-level center. The storm also appeared elongated indicating it was weakening.

On Dec. 30 at 10 a.m. EST (1500 UTC), the Joint Typhoon Warning Center noted that Tropical Cyclone Sarai was located near latitude 22.1 degrees south and longitude 176.4 degrees west, about 403 nautical miles west-southwest of Niue. Maximum sustained winds were 45 knots (52 mph) and weakening.

Sarai is forecast to curve to the northeast and pass just north of Tonga and Niue over the next several days. Both of those islands can expect rough surf, tropical storm force winds and heavy rains. As this storm continues tracking in an easterly direction, the Joint Typhoon Warning Center expects vertical wind shear, or outside winds, to increase leading to a weakening trend.

NASA’s Terra satellite is one in a fleet of NASA satellites that provide data for hurricane research.

Tropical cyclones and hurricanes are the most powerful weather events on Earth. NASA’s expertise in space and scientific exploration contributes to essential services provided to the American people by other federal agencies, such as hurricane weather forecasting.
By Rob Gutro
NASA’s Goddard Space Flight Center

Calvinia – Southern Indian Ocean

Dec. 30, 2019- NASA Sees Mauritius Covered by Tropical Storm Calvinia

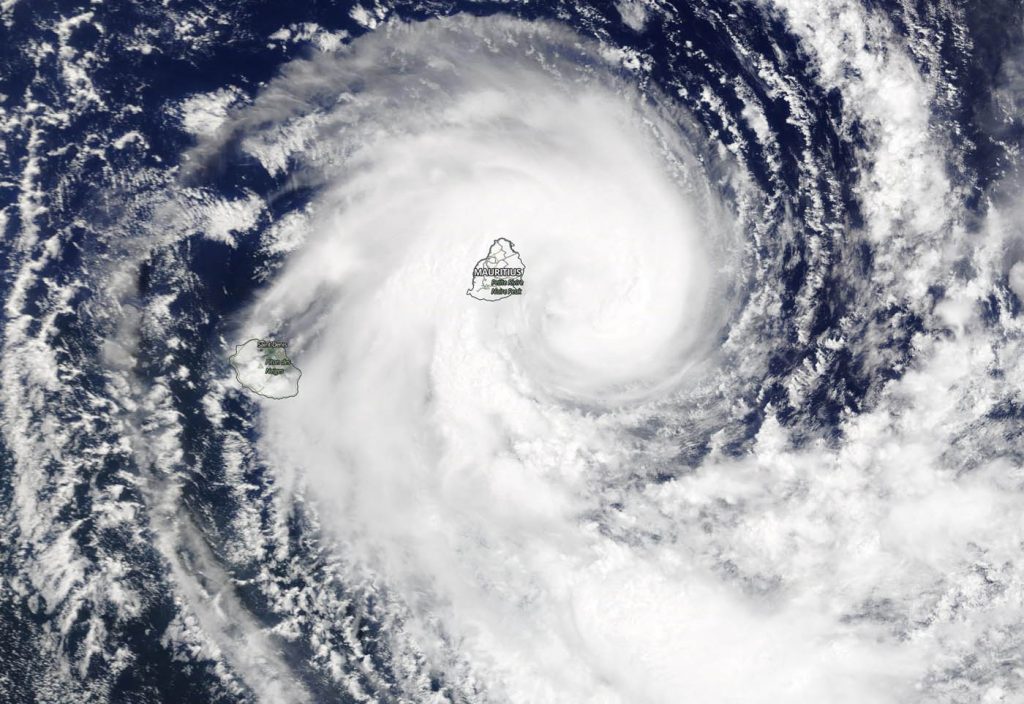
Tropical Cyclone Calvinia formed on Dec. 29 and by the next day, its clouds from a band of thunderstorms on its western side had blanketed the island of Mauritius in the Southern Indian Ocean.

Terra image of Calvinia
On Dec. 30, 2019, the MODIS instrument that flies aboard NASA’s Terra satellite provided a visible image of Tropical Storm Calvinia covering the island of Mauritius in the Southern Indian Ocean. Credit: NASA Worldview

Calvinia’s center was just east of the island on Dec. 30. The storm has triggered a tropical cyclone warning class III in Mauritius.

On Dec. 30, 2019, the Moderate Resolution Imaging Spectroradiometer or MODIS instrument that flies aboard NASA’s Terra satellite provided a visible image of Calvinia that showed the storm had a rounded shape. A rounded shape in a tropical cyclone indicates an organized storm. The MODIS image revealed bands of thunderstorms from the western side spiraled into the low-level center of circulation. That thick band of thunderstorms blanketed Mauritius bringing gusty winds and heavy rains.

On Dec. 30 at 0300 UTC (Dec. 29 at 10 p.m. EST) the Joint Typhoon Warning Center noted that Tropical Cyclone Calvinia was located near latitude 20.6 degrees south and longitude 58.8 degrees east, about 90 nautical miles east-southeast of Mauritius. Maximum sustained winds were 35 knots (40 mph). This storm is moving to the southwest.

Calvinia is forecast to strengthen to 55 knots and curve to the southeast and away from Mauritius and St. Denis.

NASA’s Terra satellite is one in a fleet of NASA satellites that provide data for hurricane research.

Tropical cyclones and hurricanes are the most powerful weather events on Earth. NASA’s expertise in space and scientific exploration contributes to essential services provided to the American people by other federal agencies, such as hurricane weather forecasting.
By Rob Gutro
NASA’s Goddard Space Flight Center

Sarai – Southern Pacific Ocean

Dec. 27, 2019 – NASA Finds Heavy Rain Potential in Tropical Storm Sarai

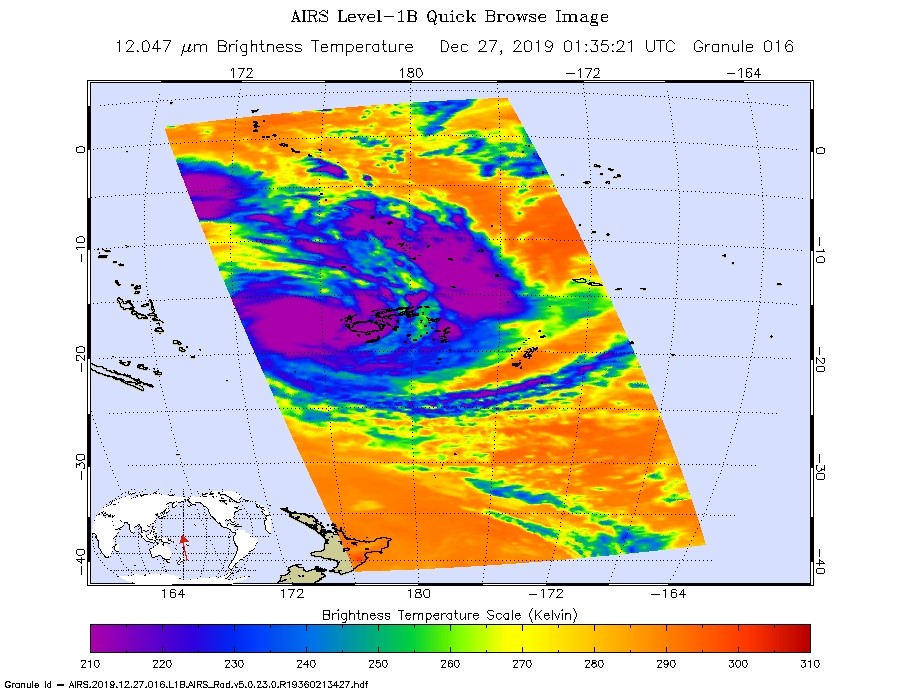
NASA analyzed the cloud top temperatures in Tropical Storm Sarai using infrared light to determine the strength of the storm. Sarai has triggered warnings for Fiji and Tonga in the Southern Pacific Ocean,

AIRS image of Sarai
On Dec. 27 at 0135 UTC (Dec. 26 at 8:35 p.m. EST) NASA’s Aqua satellite analyzed the using the AIRS instrument. AIRS showed that the strongest storms were located over the Lakshadweep Islands where the coldest cloud top temperatures were as cold as or colder than 210 Kelvin (purple) minus 81 degrees Fahrenheit (minus 63.1 degrees Celsius) around the center. Credit: NASA JPL/Heidar Thrastarson

On Dec. 27, there are regional warnings in effect for Fiji and Tonga. In Fiji, there is a storm warning is in force for Vatulele and Kadavu. A gale warning is in force for Vanua Levu, Taveuni, Yasawa and the Mamanuca Group, Kadavu, Lomaiviti Group, Viti Levu and nearby smaller islands. Tonga is on a tropical cyclone alert.

One of the ways NASA researches tropical cyclones is using infrared data that provides temperature information. Cloud top temperatures identify where the strongest storms are located. The stronger the storms, the higher they extend into the troposphere, and the colder the cloud top temperatures.

On Dec. 27 at 0135 UTC (Dec. 26 at 8:35 p.m. EST) NASA’s Aqua satellite analyzed the storm using the Atmospheric Infrared Sounder or AIRS instrument. The AIRS imagery showed the strongest storms circling the center of circulation, just west of Fiji and in a thick band of thunderstorms northeast of Fiji. In those areas, AIRS found coldest cloud top temperatures as cold as or colder than 210 Kelvin (minus 81 degrees Fahrenheit/minus 63.1 degrees Celsius). NASA research has shown that cloud top temperatures that cold indicate strong storms that have the capability to create heavy rain.

Tropical cyclones do not always have uniform strength, and some sides have stronger sides than others, so knowing where the strongest sides of the storms are located helps forecasters. NASA then provides data to tropical cyclone meteorologists so they can incorporate it in their forecasts.
At 10 a.m. EST (1500 UTC) on Dec.27 the Joint Typhoon Warning Center or JTWC noted that the center of Tropical cyclone Sarai was located near latitude 18.7 degrees south and longitude 176.1 degrees east, about 136 nautical miles west-southwest of Suva, Fiji. Maximum sustained winds were near 55 knots (63 mph/102 kph) and the storm was strengthening. It was moving to the south and expected to turn east.

Sarai is forecast to move toward the east. The storm is expected to strengthen briefly to 65 knots on its closest approach to the main Fijian islands, but weaken as it nears Tonga.

Typhoons and hurricanes are the most powerful weather events on Earth. NASA’s expertise in space and scientific exploration contributes to essential services provided to the American people by other federal agencies, such as hurricane weather forecasting.

The AIRS instrument is one of six instruments flying on board NASA’s Aqua satellite, launched on May 4, 2002.

By Rob Gutro
NASA’s Goddard Space Flight Center  

Phanfone – Northwestern Pacific Ocean

Dec. 27, 2019 – NASA Finds an Elongated Phanfone Now a Tropical Storm

NASA-NOAA’s Suomi NPP satellite provided a visible image of Phanfone as it continued moving through the South China Sea. Visible imagery showed that the storm was less organized and elongated as the storm weakened from a typhoon to a tropical storm.

Suomi NPP Image of Phanfone
NASA-NOAA’s Suomi NPP satellite provided forecasters with a visible image of a weaker and more asymmetrical Tropical Storm Phanfone on Dec. 27 as it continued moving through the South China Sea. Credit: NASA Worldview, Earth Observing System Data and Information System (EOSDIS)

Satellite imagery gives forecasters a look at the structure and strength of tropical cyclones. Visible imagery helps forecasters understand if a storm is organizing or weakening. If a storm appears more circular in nature it is an indication the storm is consolidating and strengthening. If a storm appears more elongated or asymmetrical, it is a sign that the storm is weakening.

In the visible image captured by Suomi NPP’s Visible Infrared Imaging Radiometer Suite (VIIRS) instrument, Phanfone appeared more asymmetrical.

Forecasters at the Joint Typhoon Warning Center in Pearl Harbor, Hawaii noted that Phanfone is being affected by vertical wind shear, which is a factor in elongating the storm. Wind shear are winds around the storm that blow against it at different levels in the atmosphere. The storm is also being weakened by dry air moving into it from the west. Dry air saps the ability for thunderstorms to form, and thunderstorms make up a tropical cyclone.

At 10 a.m. EST (1500 UTC) on Dec. 27, Phanfone’s maximum sustained winds had dropped to 50 knots. It was located in the South China Sea, near latitude 15.0 degrees north and longitude 115.9 degrees east, approximately 461 nautical miles east of Da Nang, Vietnam.

Phanfone is moving across the South China Sea in a westerly direction and is continuing to weaken. The forecasters at the Joint Typhoon Warning Center expect the storm to dissipate by Dec. 29, just off the coast of Vietnam.

Tropical cyclones and hurricanes are the most powerful weather events on Earth. NASA’s expertise in space and scientific exploration contributes to essential services provided to the American people by other federal agencies, such as hurricane weather forecasting.

By Rob Gutro 
NASA’s Goddard Space Flight Center

Phanfone – Northwestern Pacific Ocean

Dec. 26, 2019  – NASA Satellite Tracks Tropical Storm Phanfone into the South China Sea

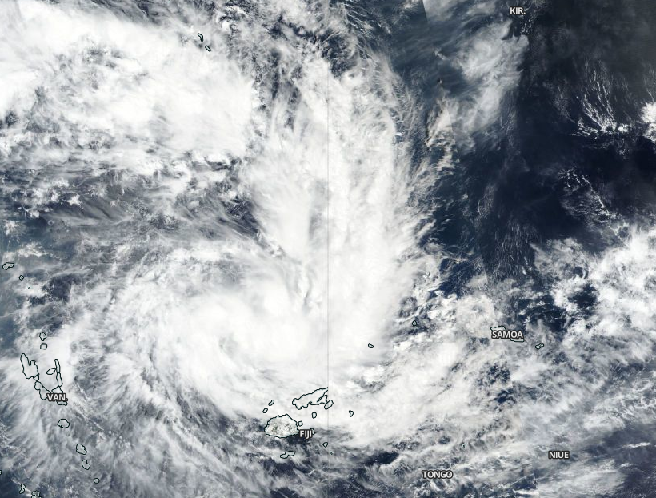
Tropical Storm Phanfone brought typhoon-force winds and heavy rains across sections of the Philippines on Christmas Eve and Christmas day. Phanfone is known as Ursula in the Philippines. Now the storm has moved into the South China Sea and NASA’s Terra satellite captured an image of the tropical cyclone.

Terra image of Phanfone
On Dec. 26, 2019, the MODIS instrument that flies aboard NASA’s Terra satellite provided a visible image of Tropical Storm Phanfone re-strengthening in the South China Sea. Credit: NASA Worldview

Phanfone’s maximum sustained winds peaked near 95 knots on Dec. 25 at 4 a.m. EST (0900 UTC) as it passed through the Philippine archipelago.

On Dec. 26, 2019, the Moderate Imaging Spectroradiometer or MODIS instrument that flies aboard NASA’s Terra satellite provided a visible image of Phanfone that showed the storm maintained its circular shape after crossing the Philippines. A rounded shape of a tropical cyclone indicates an organized storm. The MODIS image revealed bands of thunderstorms spiraled into the low-level center of circulation.

At 10 a.m. EST (1500 UTC) on Dec. 26, the Joint Typhoon Warning Center noted that Tropical Cyclone Phanfone was located near latitude 14.0 degrees north and longitude 117.4 degrees east, about 554 nautical miles east-southeast of Da Nang, Vietnam. Maximum sustained winds were 75 knots (86 mph/139 kph). Phanfone is moving to the northwest.

Phanfone is forecast to begin a weakening trend and move toward Hainan Island, China. After two days, the storm is expected to weaken to a tropical depression.

NASA’s Terra satellite is one in a fleet of NASA satellites that provide data for hurricane research.

Tropical cyclones and hurricanes are the most powerful weather events on Earth. NASA’s expertise in space and scientific exploration contributes to essential services provided to the American people by other federal agencies, such as hurricane weather forecasting.
By Rob Gutro
NASA’s Goddard Space Flight Center

Sarai – Southern Pacific Ocean

Dec. 26, 2019 – NASA-NOAA Satellite Finds Development of Tropical Cyclone Sarai

Imagery from NASA-NOAA’s Suomi NPP satellite showed that a tropical low-pressure area has consolidated and organized in the Southern Pacific Ocean near Fiji.

Suomi NPP image of Sarai
NASA-NOAA’s Suomi NPP satellite passed over the Southern Pacific Ocean on Dec. 26 and found Tropical Storm Sarai had developed near Fiji. The image showed strong bands of thunderstorms from the western quadrant wrapping into the low-level center of circulation. Credit: NASA Worldview, Earth Observing System Data and Information System (EOSDIS)

Tropical Storm Sarai has formed to the west of Fiji. Fiji is an archipelago, consisting of more than 300 islands in the South Pacific Ocean.

On Dec. 26 at 6:43 a.m. EST) Dec. 27 at 12:43 a.m. Fiji local time, the Fiji Meteorological Service has issued various warnings for Fiji and surrounding islands. A gale warning remains in force for Rotuma, Vanua Levu, Taveuni and nearby smaller islands, Yasawa and Mamanuca Group, Kadavu, Lomaiviti group, Viti Levu and nearby smaller islands. A strong wind warning remains in force for the rest of Fiji. A heavy rain warning remains in force for the Fiji group.

The Visible Infrared Imaging Radiometer Suite (VIIRS) instrument aboard Suomi NPP provided a visible image of Sarai that revealed a band of thunderstorms were wrapping into the low-level center of circulation.

At 4 a.m. EST (0900 UTC) on Dec. 26, the Joint Typhoon Warning Center or JTWC in Pearl Harbor, Hawaii noted that Sarai had maximum sustained winds near 35 knots (40 mph/65 kph). Sarai was located near latitude 13.7 degrees south and longitude 176.2 degrees east, approximately 320 nautical miles north-northwest of Suva, Fiji. The tropical cyclone has tracked south southeastward. The tropical storm’s center is expected to stay over water, just southwest of Fiji. JTWC said, “The favorable environment will allow steady ‘intensification to 65 knots as it passes Nadi.”

Tropical cyclones and hurricanes are the most powerful weather events on Earth. NASA’s expertise in space and scientific exploration contributes to essential services provided to the American people by other federal agencies, such as hurricane weather forecasting.
For updated forecasts from the Fiji Meteorological Service, visit: http://www.met.gov.fj/

By Rob Gutro 
NASA’s Goddard Space Flight Center

Phanfone – Northwestern Pacific Ocean

Dec. 24, 2019 – NASA Sees Typhoon Phanfone Landfall in the Philippines

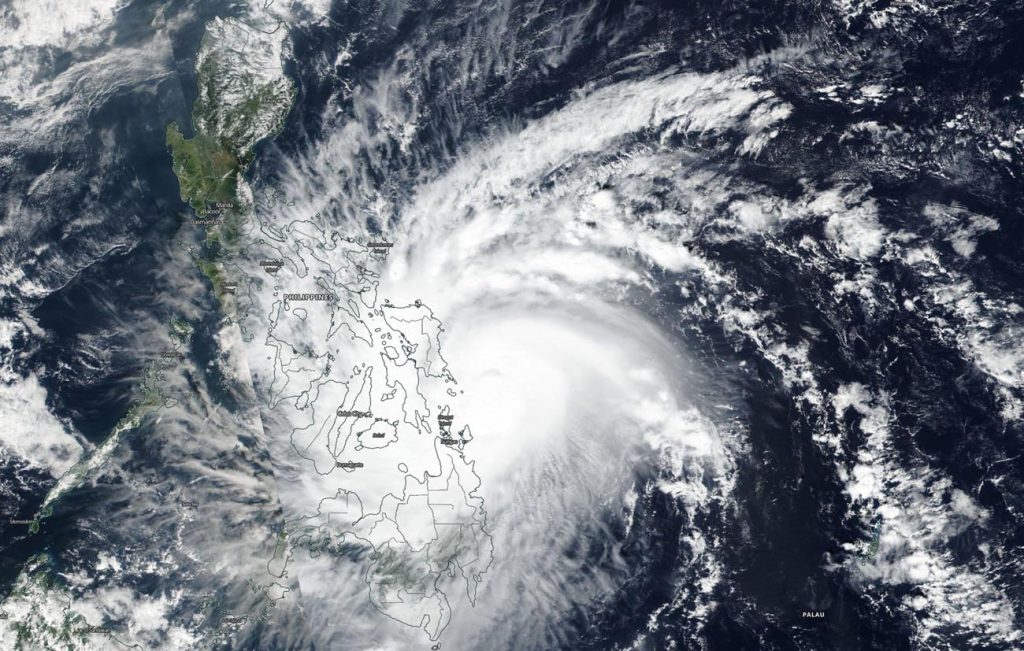
Typhoon Phanfone, known locally in the Philippines as Ursula, was making landfall in the central part of the country when NASA-NOAA’s Suomi NPP satellite passed overhead on Dec. 24.

Suomi NPP image of Phanfone
NASA-NOAA Suomi NPP’s VIIRS instrument provided a visible image of Phanfone that showed its center had made landfall in the eastern Visayas region of the Philippines on Dec. 24, 2019. VIIRS and other satellite imagery has shown an intermittent eye feature peeking out within a compact area of sustained deep central convection. Credit: NOAA/NASA Worldview

Suomi NPP’s VIIRS instrument provided a visible image of Phanfone that showed its center had made landfall in the eastern Visayas region of the Philippines. The Visible Infrared Imaging Radiometer Suite (VIIRS) is one of 5 instruments aboard Suomi NPP. VIIRS and other satellite imagery has shown an intermittent eye feature peeking out within a compact area of sustained deep central convection.

At 4 a.m. EST (0900 UTC) on Dec. 24, there were many warning signals in effect for the country. Philippines tropical cyclone Signal #3 was in effect for Luzon (northern Philippines) that included Masbate including Ticao Island. In Visayas (central Philippines), the warning covered Northern Samar, eastern Samar, Samar, Biliran, Leyte and extreme northern Cebu.

Signal #2 was in effect in Luzon for the southern part of Cebu, Oriental and Occidental Mindoro, Romblon, Albay, Sorsogon, Burias Island and Calamian and Cuyo Islands.

Also in the Visayas region, Signal #2 included the central part of northern Cebu, northern Antique, Capiz, Aklan, southern Leyte and northern Negros Occidental Mindanao and the Dinagat islands.

Signal #1 was also posted for parts of Luzon that included Bulacan, Bataan, Metro Manila, Rizal, Cavite, rest of Quezon, Laguna, Batangas, Camarines Norte & Sur, Catanduanes, and northern Palawan. In Visayas the signal covered the rest of Cebu, Bohol, Aklan, rest of Antique, rest of Iloilo, Guimaras, rest of Negros Occidental and Negros Oriental. Signal #1 was also posted for Mindanao’s Surigao del Northe including Siargao and Bucas Grande Islands.

At 4 a.m. EST (0900 UTC) Phanfone (Philippines designation Ursula) was located near latitude 11.1 degrees north and longitude 126.5 degrees east, about 384 nautical miles east-southeast of Manila, Philippines. Phanfone was moving to the west-northwest with maximum sustained winds 65 knots (75 mph/120 kph).

Phanfone is forecast to strengthen to 80 knots as it moves over the Sulu Sea, and strengthen further once it moves into the South China Sea.

By Rob Gutro
NASA’s Goddard Space Flight Center

Phanfone – Northwestern Pacific Ocean

Dec. 23, 2019 – NASA Analyzes Tropical Cyclone Phanfone’s Water Vapor Concentration

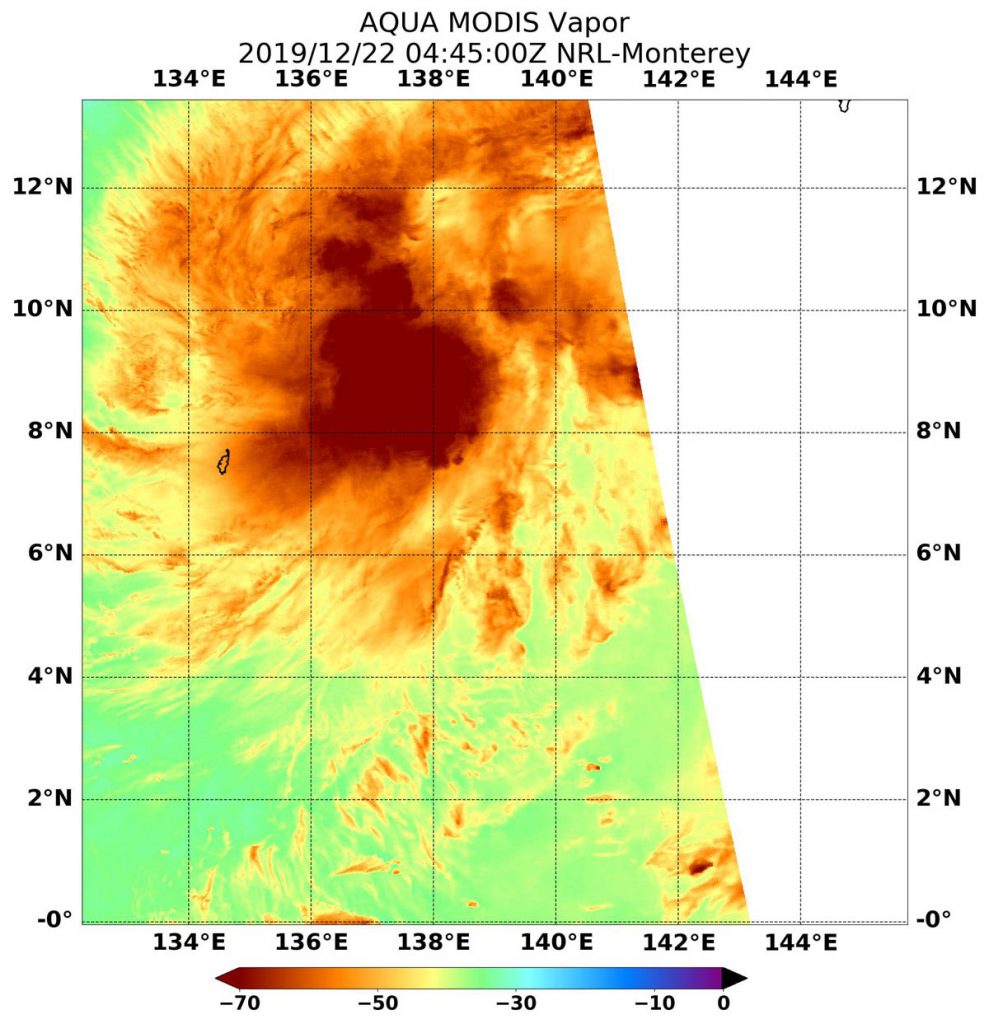
When NASA’s Aqua satellite passed over the Northwestern Pacific Ocean, water vapor data provided information about the intensity of Tropical Cyclone Phanfone. In the Philippines, the storm is known locally as Ursula.

Aqua image of Phanfone
NASA’s Aqua satellite passed over Tropical Cyclone Phanfone in the Northwestern Pacific Ocean on Dec. 22 at 0445 UTC (Dec. 21 at 11:45 p.m. EST) and the highest concentrations of water vapor (brown) and coldest cloud top temperatures were around the center. Credits: NASA/NRL

Tropical Depression 30W formed early on Dec. 22 and strengthened into a tropical storm. By 4 a.m. EST (0900 UTC), the storm was renamed Phanfone.

NASA’s Aqua satellite passed over Tropical Cyclone on Dec. 22 at 0445 UTC (Dec. 21 at 11:45 p.m. EST) and the Moderate Resolution Imaging Spectroradiometer or MODIS instrument gathered water vapor content and temperature information. The MODIS image showed highest concentrations of water vapor and coldest cloud top temperatures were around the center of circulation.

MODIS data also showed coldest cloud top temperatures were as cold as or colder than minus 70 degrees Fahrenheit (minus 56.6 degrees Celsius) in those storms. Storms with cloud top temperatures that cold have the capability to produce heavy rainfall.

Water vapor analysis of tropical cyclones tells forecasters how much potential a storm has to develop. Water vapor releases latent heat as it condenses into liquid. That liquid becomes clouds and thunderstorms that make up a tropical cyclone. Temperature is important when trying to understand how strong storms can be. The higher the cloud tops, the colder and the stronger the storms.

On Dec. 23 at 4 a.m. EST (0900 UTC), Tropical Storm Phanfone (Philippines designation Ursula) was located near latitude 9.8 degrees north and longitude 132.2 degrees east, about 717 nautical miles east-southeast of Manila, Philippines. Phanfone is moving to the west-northwest and had maximum sustained winds near 40 knots (46 mph/74 kph).

On Dec. 23 at 10 a.m. EST (1500 UTC), the GMI or Microwave Imager sensor aboard NASA and the Japan Aerospace Exploration Agency’s Global Precipitation Measurement mission or GPM core satellite, showed an eye was developing in Phanfone’s center.

Forecasters at the Joint Typhoon Warning Center expect Phanfone will move west-northwest toward and through the central Philippine archipelago and the Visayas and Mindanao regions on Dec. 24 and 25.

NASA’s Aqua satellite is one in a fleet of NASA satellites that provide data for hurricane research.

Typhoons and hurricanes are the most powerful weather event on Earth. NASA’s expertise in space and scientific exploration contributes to essential services provided to the American people by other federal agencies, such as hurricane weather forecasting.
By Rob Gutro
NASA’s Goddard Space Flight Center