Aug. 12, 2020 – NASA-NOAA’s Suomi NPP Satellite Finds a Stubborn Tropical Depression 06W
Tropical Depression 06W has been around for days, and continues to hold together as it moves in a westerly direction toward Taiwan in the Northwestern Pacific Ocean. NASA-NOAA’s Suomi NPP satellite captured a visible image of the storm.
NASA-NOAA’s Suomi NPP satellite provided forecasters with a visible image of Tropical Depression 06W moving through the Northwestern Pacific Ocean on Aug. 12. Credit: NASA Worldview, Earth Observing System Data and Information System (EOSDIS)
On Aug. 12, the Visible Infrared Imaging Radiometer Suite (VIIRS) instrument aboard Suomi NPP revealed a partially exposed low-level circulation with building thunderstorms over the western quadrant of Tropical Depression 06W. Satellite imagery also showed a weakly defined, broad center. The image was created by NASA Worldview website at NASA’s Goddard Space Flight Center in Greenbelt, Md.
At 11 a.m. EDT (1500 UTC) on Aug. 12, the Joint Typhoon Warning Center (JTWC) noted Tropical Depression 06W (TD06W) was centered near latitude 5.0 degrees north and longitude 133.4 degrees east, approximately 349 nautical miles east-southeast of Kadena Air Base, Okinawa Island, Japan. 06W was moving to the west-southwest. Maximum sustained winds remained near 25 knots (29 mph/46 kph).
TD06W is expected to maintain intensity for another day and a half, when it will then weaken.
NASA Researches Tropical Cyclones
Hurricanes/tropical cyclones are the most powerful weather events on Earth. NASA’s expertise in space and scientific exploration contributes to essential services provided to the American people by other federal agencies, such as hurricane weather forecasting.
For more than five decades, NASA has used the vantage point of space to understand and explore our home planet, improve lives and safeguard our future. NASA brings together technology, science, and unique global Earth observations to provide societal benefits and strengthen our nation. Advancing knowledge of our home planet contributes directly to America’s leadership in space and scientific exploration.
Aug. 12, 2020 – NASA Finds Hurricane Elida’s Eye Covered
NASA’s Aqua satellite obtained visible imagery of Hurricane Elida in the Eastern Pacific as it continued to weaken. Imagery revealed that Elida’s eye had become covered as the storm embarks on a weakening trend over cooler waters.
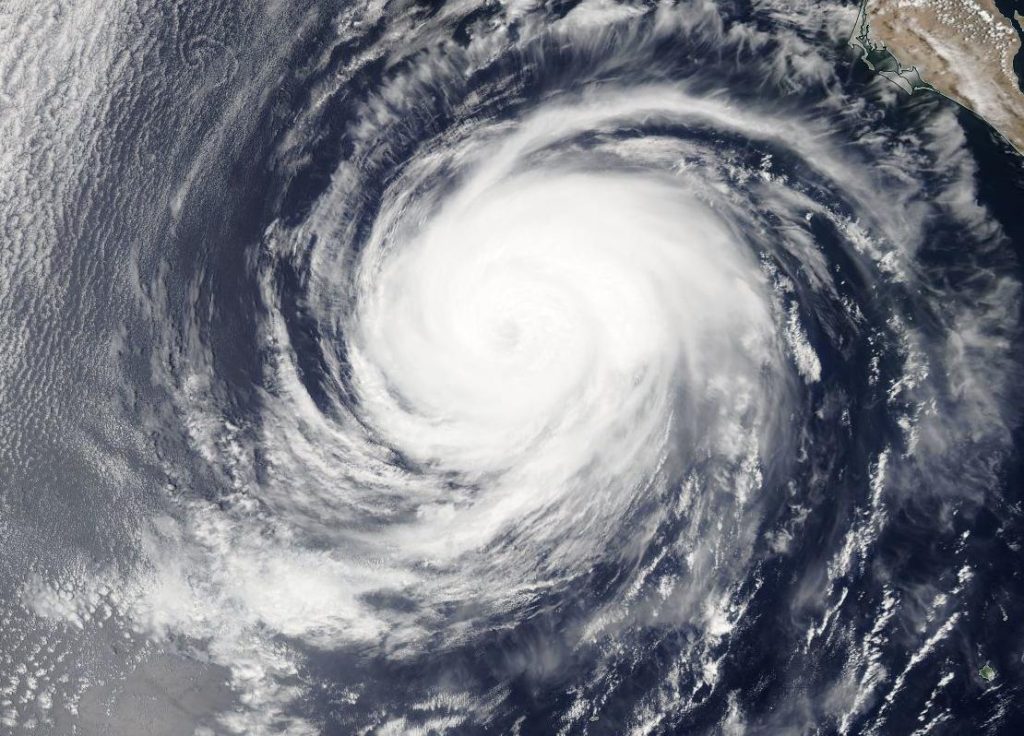
NASA’s Aqua satellite provided a visible image to forecasters of Hurricane Elida on Aug. 11 that showed the eye had become covered by high clouds and the storm appeared more elongated. Image Courtesy: NASA Worldview, Earth Observing System Data and Information System (EOSDIS).
The Moderate Resolution Imaging Spectroradiometer or MODIS instrument that flies aboard NASA’s Aqua satellite captured a visible image of Hurricane Elida on Aug. 11 at 4:30 p.m. EDT and the eye had become obscured by high clouds. The image also revealed that the storm looked more elongated, another sign a storm is weakening. Satellite imagery was created using NASA’s Worldview product at NASA’s Goddard Space Flight Center in Greenbelt, Md.
Elida has moved into cooler waters, causing the storm to weaken. The hurricane have moved over waters of 23 to 24 degrees Celsius (73.4 to 75.2 degrees Fahrenheit). A hurricane needs sea surface temperatures of at least 26.6 degrees Celsius (80 degrees Fahrenheit) to maintain intensity.
Elida’s Status on Aug. 12
At 5 a.m. EDT (0900 UTC) on Aug. 12, the center of Hurricane Elida was located near latitude 23.0 degrees north and longitude 117.7 degrees west. That’s about 495 miles (800 km) west of the southern tip of Baja California, Mexico. Elida is moving toward the west-northwest near 13 mph (20 kph). A turn to the northwest along with some decrease in forward speed is expected to occur tonight. Maximum sustained winds are near 75 mph (120 kph) with higher gusts. The estimated minimum central pressure is 988 millibars.
Satellite imagery on Aug. 12 show that Elida’s remaining deep convection, located northeast of the center of circulation, continues to shrink in coverage and wane in intensity.
Elida Still Causing Ocean Swells
The National Hurricane Center (NHC) said, “Swells generated by Elida are expected to affect portions of the coast of west-central Mexico and the southern Baja California peninsula during the next day or two. These swells are likely to cause life-threatening surf and rip current conditions.”
Elida’s Forecast Calls for Quick Demise
NHC noted that Elida is expected to weaken quickly. “Rapid weakening is expected during the next day or so as Elida moves over colder water, and the cyclone is forecast to weaken to a tropical storm today and degenerate to a remnant low [pressure area] on Thursday.”
About NASA’s Worldview and Aqua Satellite
NASA’s Earth Observing System Data and Information System (EOSDIS) Worldview application provides the capability to interactively browse over 700 global, full-resolution satellite imagery layers and then download the underlying data. Many of the available imagery layers are updated within three hours of observation, essentially showing the entire Earth as it looks “right now.”
NASA’s Aqua satellite is one in a fleet of NASA satellites that provide data for hurricane research.
Tropical cyclones/hurricanes are the most powerful weather events on Earth. NASA’s expertise in space and scientific exploration contributes to essential services provided to the American people by other federal agencies, such as hurricane weather forecasting.
Aug. 11, 2020 – NASA Finds Mekkhala Coming Apart After Landfall in Southeastern China
NASA-NOAA’s Suomi NPP satellite provided forecasters with a visible image of former Typhoon Mekkhala shortly after it made landfall in southeastern China. Wind shear had torn the storm apart.
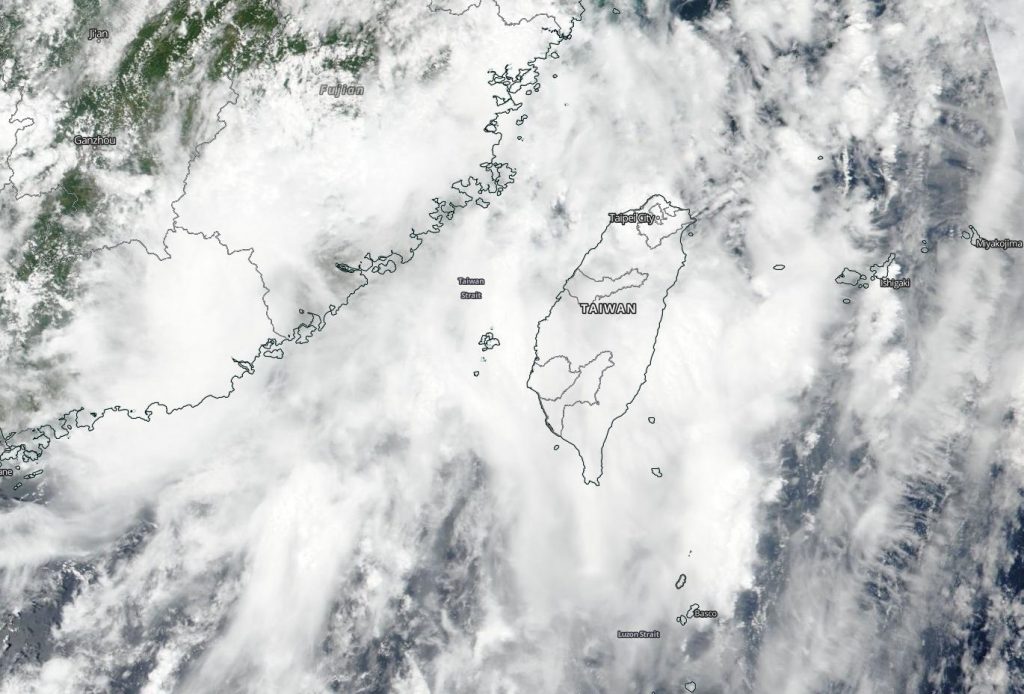
NASA-NOAA’s Suomi NPP satellite provided forecasters with a visible image of Tropical Storm Mekkhala as it was making landfall in southeastern China. Credit: NASA Worldview, Earth Observing System Data and Information System (EOSDIS)
Mekkhala made landfall in Fujian, southeastern China, bringing strong winds and torrential rain. According to the China Meteorological Agency, the typhoon came ashore in coastal areas of Zhangpu County at around 7:30 a.m. local time on Aug. 11 (7:30 p.m. EDT on Aug. 10). The storm generated at least 170 mm (6.7 inches) of rainfall in Zhangpu County by the middle of the day on Aug. 11.
At 11 p.m. EDT on Aug. 10 (0300 UTC, Aug. 11) the Joint Typhoon Warning Center (JTWC) issued their final bulletin on Mekkhala. At that time, the storm was centered near latitude 24.1 degrees north and longitude 117.7 degrees east, about 216 nautical miles west-southwest of Taipei, Taiwan. Mekkhala’s maximum sustained winds were near 70 knots (81 mph/129 kph) at landfall. It continued to move to the north-northwest.
Wind Shear Tearing at Mekkhala
The shape of a tropical cyclone provides forecasters with an idea of its organization and strength. When outside winds batter a storm, it can change the storm’s shape and push much of the associated clouds and rain to one side of it which is what wind shear does.
In general, wind shear is a measure of how the speed and direction of winds change with altitude. Tropical cyclones are like rotating cylinders of winds. Each level needs to be stacked on top each other vertically in order for the storm to maintain strength or intensify. Wind shear occurs when winds at different levels of the atmosphere push against the rotating cylinder of winds, weakening the rotation by pushing it apart at different levels.
Suomi NPP’s Satellite View
On Aug. 11, the Visible Infrared Imaging Radiometer Suite (VIIRS) instrument aboard NASA-NOAA’s Suomi NPP satellite showed a somewhat shapeless storm. Satellite imagery showed that Typhoon Mekkhala was quickly becoming sheared, with the outer low-level bands of thunderstorms on the north side of the system exposed, but with deep convection and strong thunderstorms remaining in place over and south of the center.
The JTWC expects Mekkhala to dissipate within the next day or two.
NASA Researches Tropical Cyclones
Hurricanes/tropical cyclones are the most powerful weather events on Earth. NASA’s expertise in space and scientific exploration contributes to essential services provided to the American people by other federal agencies, such as hurricane weather forecasting.
For more than five decades, NASA has used the vantage point of space to understand and explore our home planet, improve lives and safeguard our future. NASA brings together technology, science, and unique global Earth observations to provide societal benefits and strengthen our nation. Advancing knowledge of our home planet contributes directly to America’s leadership in space and scientific exploration.
Aug. 11, 2020 – NASA-NOAA Satellite Night-time Animation Shows Intensification of Hurricane Elida
A new animation of night-time imagery from NASA-NOAA’s Suomi NPP satellite revealed how the Eastern Pacific Ocean’s Elida transformed into a hurricane over a three-day period.
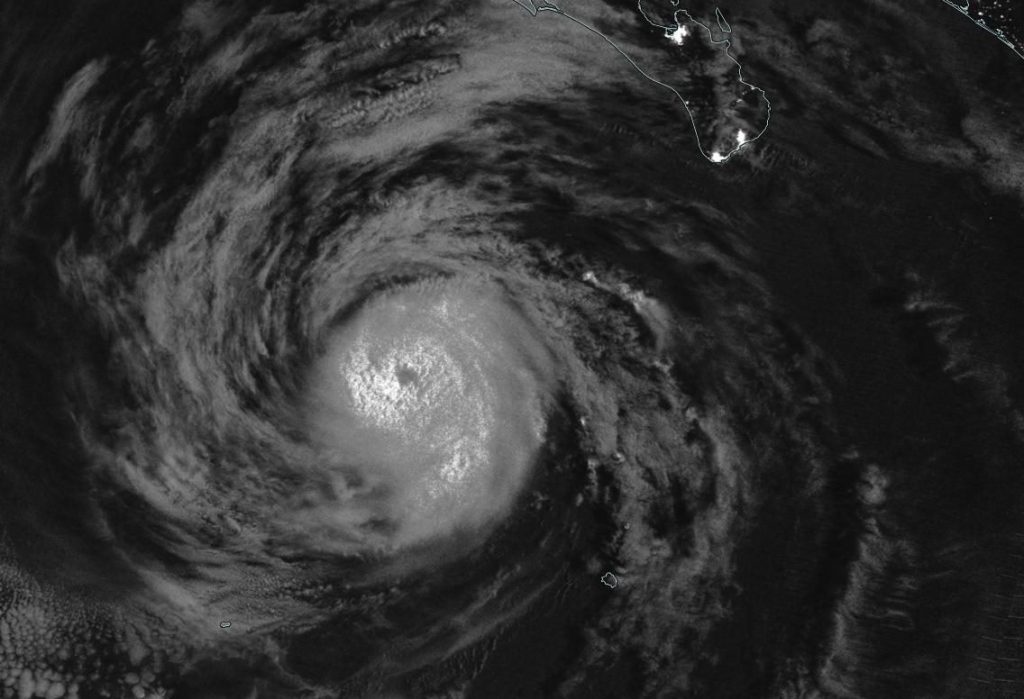
NASA-NOAA’s Suomi NPP satellite passed the Eastern Pacific Ocean overnight on Aug. 10 at 10 p.m. EDT (Aug. 11 at 0000 UTC) and captured a night-time image of Hurricane Elida. Credit: NASA Worldview, Earth Observing System Data and Information System (EOSDIS)
NASA’s Night-Time View of Elida’s Intensification
The Visible Infrared Imaging Radiometer Suite (VIIRS) instrument aboard Suomi NPP provided a night-time image of Hurricane Elida during the early morning hours of Aug. 11 (8 p.m. EDT on Aug. 10). The storm had intensified into a hurricane and an eye was clearly apparent, surrounded by powerful thunderstorms around it.
NASA-NOAA’s Suomi NPP satellite passed the Eastern Pacific Ocean overnight on Aug. 10 at 10 p.m. EDT (Aug. 11 at 0000 UTC) and captured a night-time image of Hurricane Elida. Credit: NASA Worldview, Earth Observing System Data and Information System (EOSDIS)
At NASA’s Goddard Space Flight Center in Greenbelt, Md. an animation of night-time imagery from NASA-NOAA’s Suomi NPP satellite shows the development and intensification of Hurricane Elida in the Eastern Pacific Ocean from Aug. 9 to 11, 2020 at 0000 UTC (which is 8 p.m. EDT Aug. 8 to 10). On Aug. 9, Elida appeared somewhat shapeless, and by the night-time hours of Aug.10, the storm took on a general tropical cyclone shape with bands of thunderstorms wrapping into the low-level center. Elida became a hurricane by 5 p.m. EDT (2100 UTC) on Aug. 10. By Aug. 11, Elida had a tight circulation of powerful thunderstorms around the center and an eye was apparent on the night-time imagery. The animation was created using the NASA Worldview application.
Hurricane Elida’s Status on Aug. 11
At 11 a.m. EDT (1500 UTC) on Aug. 11, the National Hurricane Center (NHC) noted the center of Hurricane Elida was located near latitude 21.3 degrees north and longitude 113.8 degrees west. That is about 275 miles (440 km) west-southwest of the southern tip of Baja California, Mexico.
Elida was moving toward the northwest near 14 mph (22 kph). A west-northwestward to northwestward motion with a decrease in forward seed is expected during the next several days. Maximum sustained winds have increased to near 100 mph (155 kph) with higher gusts. Elida is now a Category 2 hurricane on the Saffir-Simpson Hurricane Wind Scale. Hurricane-force winds extend outward up to 15 miles (30 km) from the center and tropical-storm-force winds extend outward up to 70 miles (110 km). The estimated minimum central pressure is 975 millibars.
Rapid weakening is expected to begin tonight as Elida moves over colder water, and the cyclone is expected to weaken to a tropical storm on Wednesday and degenerate to a remnant low pressure area on Thursday, Aug. 13.
About NASA’s EOSDIS Worldview
NASA’s Earth Observing System Data and Information System (EOSDIS) Worldview application provides the capability to interactively browse over 700 global, full-resolution satellite imagery layers and then download the underlying data. Many of the available imagery layers are updated within three hours of observation, essentially showing the entire Earth as it looks “right now.”
NASA Researches Earth from Space
For more than five decades, NASA has used the vantage point of space to understand and explore our home planet, improve lives and safeguard our future. NASA brings together technology, science, and unique global Earth observations to provide societal benefits and strengthen our nation. Advancing knowledge of our home planet contributes directly to America’s leadership in space and scientific exploration.
Aug. 11, 2020 – NASA Finds a Wispy, Wind-Sheared Tropical Depression 06W
NASA’s Terra satellite revealed that a wispy looking Tropical Depression 06W in the Northwestern Pacific Ocean was being battered by wind shear. That wind shear is not expected to wane and the storm is expected to weaken.
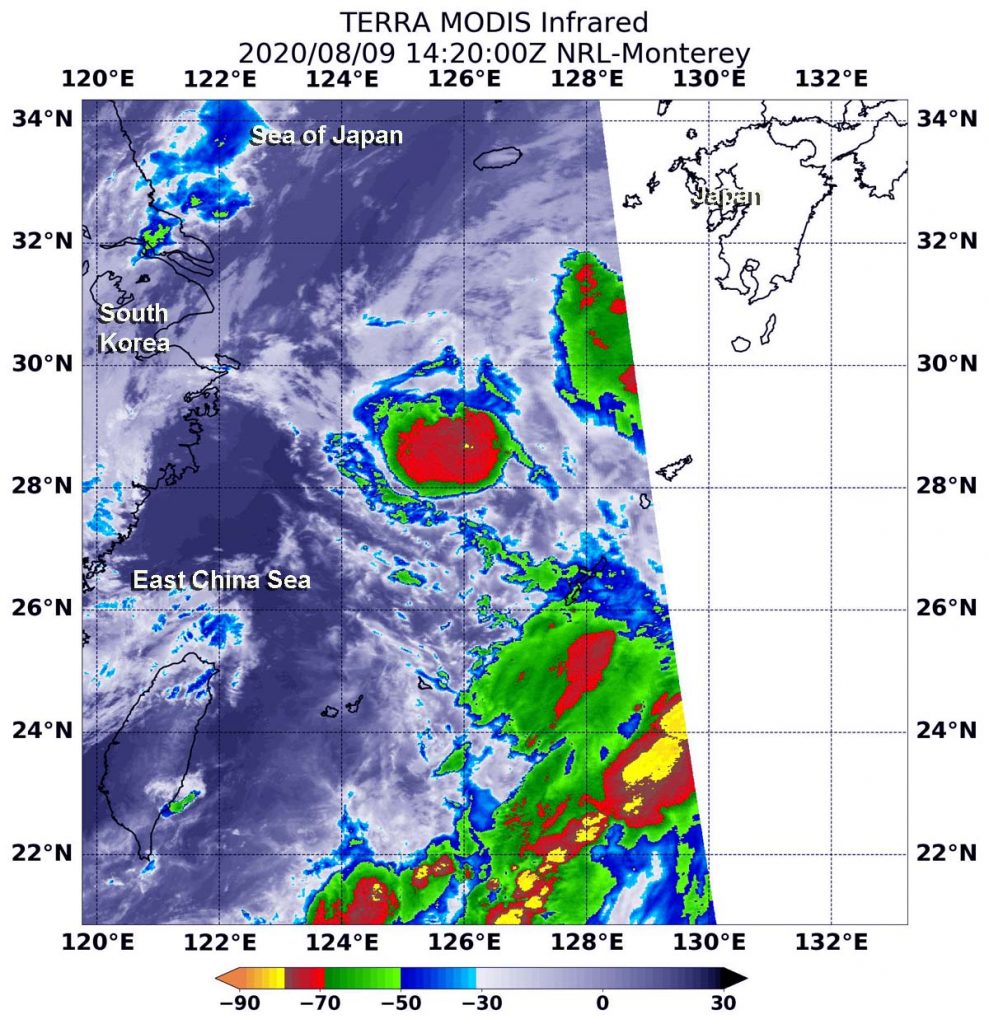
On Aug. 11, 2020, NASA’s Terra satellite provided a visible image of Tropical Depression 06W in the Northwestern Pacific Ocean that showed a ring of wispy clouds around a fully-exposed, well-defined, low-level center of circulation. It also showed that any precipitation and thunderstorms were pushed to the south-southwest of the center from vertical wind shear. Japan is located in the top left of this image. Credit: NASA/NRL
Tropical Depression 06W formed two days ago on August 9 by 11 a.m. EDT (1500 UTC) near latitude 26.1 degrees north and longitude 147.6 east, about 250 nautical miles east-northeast of Iwo To Island, Japan. 06W briefly strengthened to a tropical storm by 5 p.m. EDT (2100 UTC) when maximum sustained winds reached 45 knots (52 mph/83 kph). By Aug. 10 at 11 a.m. EDT (1500 UTC) the storm had weakened back to tropical depression status.
On Aug. 11, 2020, the Moderate Resolution Imaging Spectroradiometer or MODIS instrument that flies aboard NASA’s Terra satellite provided forecasters at the Joint Typhoon Warning Center in Honolulu, Hawaii with a visible image of Tropical Depression 06W. The image showed a ring of wispy clouds around a fully-exposed, well-defined, low-level center of circulation. It also showed that any precipitation and thunderstorms were pushed to the south-southwest of the center from vertical wind shear.
Vertical wind shear, that is, winds outside of a tropical cyclone at different heights in the atmosphere (the troposphere) push against a tropical cyclone and tear it apart. Winds from the north-northeast were affecting 06W. In addition, dry air was moving into the storm and sapping the development of the thunderstorms that make up a tropical cyclone.
At 5 a.m. EDT (0900 UTC) on Aug. 11, the center of Tropical Depression 06W was located near latitude 26.6 degrees north and longitude 140.5 degrees east, about 681 nautical miles east of Kadena Air Base, Okinawa Island, Japan. 06W was moving to the west and had maximum sustained winds near 25 knots (29 mph/46 kph).
The Joint Typhoon Warning Center (JTWC) forecast notes that 06W will continue to move west and weaken before dissipating after a few days.
About NASA’s Worldview and Terra Satellite
NASA’s Earth Observing System Data and Information System (EOSDIS) Worldview application provides the capability to interactively browse over 700 global, full-resolution satellite imagery layers and then download the underlying data. Many of the available imagery layers are updated within three hours of observation, essentially showing the entire Earth as it looks “right now.”
NASA’s Terra satellite is one in a fleet of NASA satellites that provide data for hurricane research.
Tropical cyclones/hurricanes are the most powerful weather events on Earth. NASA’s expertise in space and scientific exploration contributes to essential services provided to the American people by other federal agencies, such as hurricane weather forecasting.
Aug. 11, 2020 – NASA Finds Jangmi Now an Extra-Tropical Storm
NASA’s Aqua satellite obtained a visible image of Tropical Storm Jangmi after it transitioned into an extra-tropical storm.
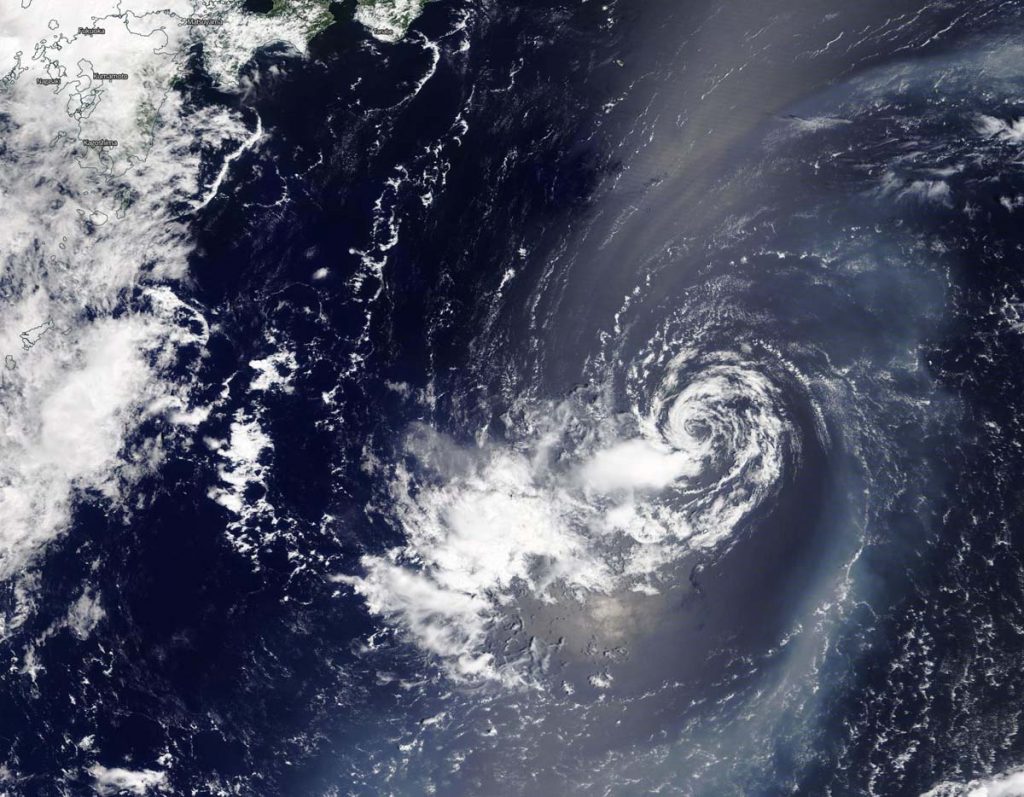
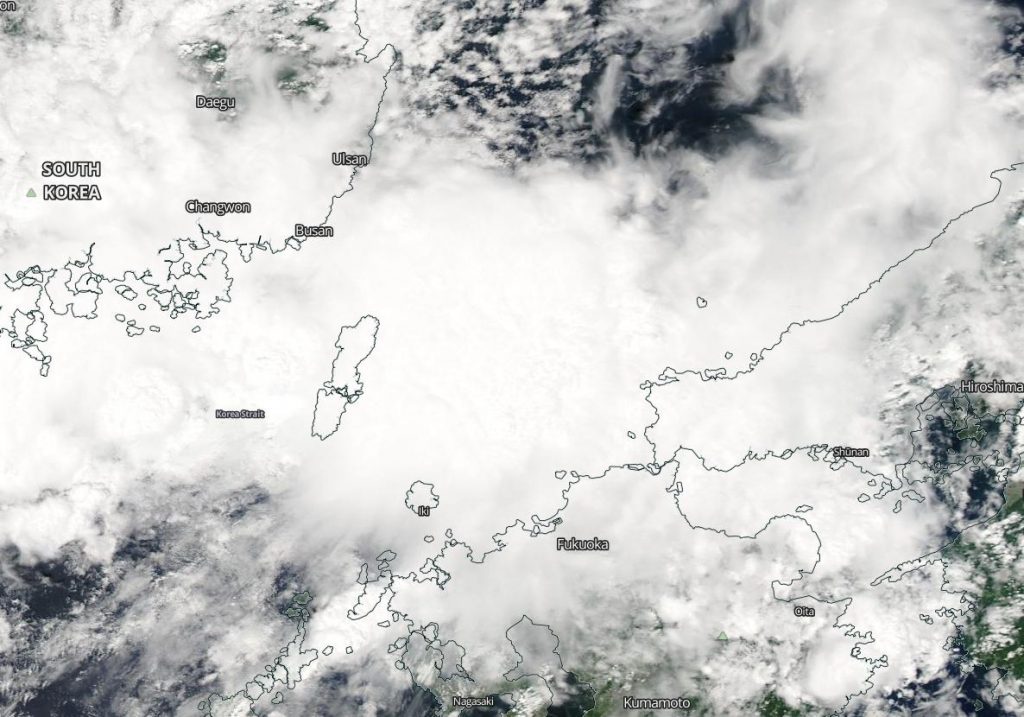
NASA’s Aqua satellite provided a visible image to forecasters of extra-tropical storm Jangmi in the Sea of Japan on Aug. 11, 2020. Image Courtesy: NASA Worldview, Earth Observing System Data and Information System (EOSDIS).
The Joint Typhoon Warning Center (JTWC) posted its final bulletin on Tropical Storm Jangmi on Aug. 10 at 11 a.m. EDT (1500 UTC). At that time, it was located near latitude 26.9 degrees north and longitude 130.4 degrees east, about 139 miles northeast of Chinhae, South Korea. Jangmi was speeding to the north-northeast at 29 knots and had maximum sustained winds of 35 knots (40 mph).
On Aug. 11, Jangmi had moved into the Sea of Japan and had become extra-tropical.
What an Extra-tropical Storm Means
When a storm becomes extra-tropical, it means that a tropical cyclone has lost its “tropical” characteristics. The National Hurricane Center defines “extra-tropical” as a transition that implies both poleward displacement (meaning it moves toward the north or south pole) of the cyclone and the conversion of the cyclone’s primary energy source from the release of latent heat of condensation to baroclinic (the temperature contrast between warm and cold air masses) processes. It is important to note that cyclones can become extratropical and retain winds of hurricane or tropical storm force.
The Moderate Resolution Imaging Spectroradiometer or MODIS instrument that flies aboard NASA’s Aqua satellite captured a visible image of extra-tropical storm Jangmi in the Sea of Japan, near the Korea Strait. The Korea Strait is located between South Korea and Japan, connecting the East China Sea, the Yellow Sea and the Sea of Japan. The MODIS image showed that the storm had become somewhat elongated. Satellite imagery was created using NASA’s Worldview product at NASA’s Goddard Space Flight Center in Greenbelt, Md.
On Aug. 11, the Japan Meteorological Agency posted advisories along the prefectures in the Sea of Japan as Jangmi is forecast to move through it in a north-northeasterly direction and weaken. For updated warnings and watches, visit: https://www.jma.go.jp/en/warn/.
About NASA’s Worldview and Aqua Satellite
NASA’s Earth Observing System Data and Information System (EOSDIS) Worldview application provides the capability to interactively browse over 700 global, full-resolution satellite imagery layers and then download the underlying data. Many of the available imagery layers are updated within three hours of observation, essentially showing the entire Earth as it looks “right now.”
NASA’s Aqua satellite is one in a fleet of NASA satellites that provide data for hurricane research.
Tropical cyclones/hurricanes are the most powerful weather events on Earth. NASA’s expertise in space and scientific exploration contributes to essential services provided to the American people by other federal agencies, such as hurricane weather forecasting.
Aug. 10, 2020 – NASA Finds Strong Storms in Developing Tropical Storm Mekkhala
After Tropical Depression 07W formed close to the western Philippines, it moved away and strengthened into a tropical storm in the South China Sea. NASA’s Terra satellite provided a look at the strength of the storms that make up the tropical cyclone.
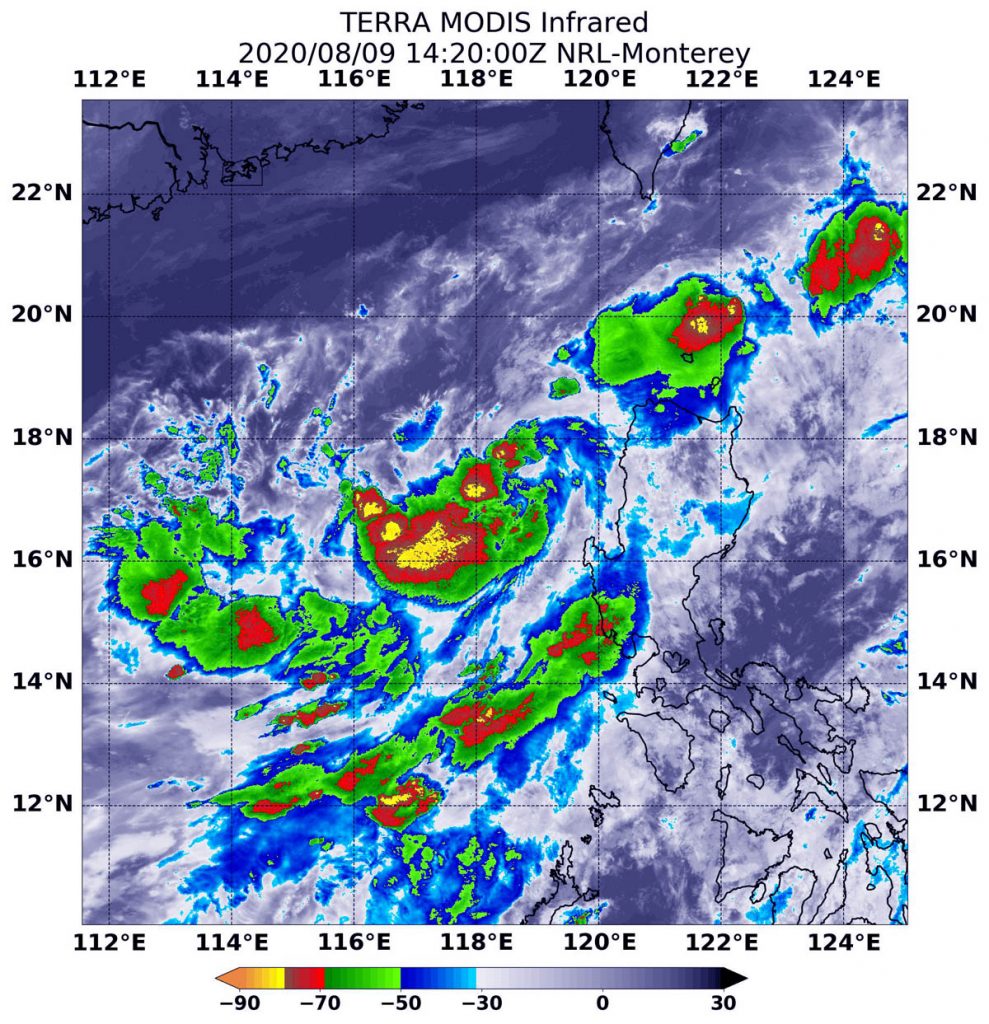
On Aug. 9 at 10:20 a.m. EDT (1420 UTC), NASA’s Terra satellite found the most powerful thunderstorms (yellow) were around Mekkhala’s center of circulation and in several other areas, where temperatures were as cold as or colder than minus 80 degrees Fahrenheit (minus 62.2 Celsius). Those areas were surrounded by thunderstorms (red) slightly less high in the atmosphere, but still powerful rainmakers with cloud top temperatures as cold as or colder than minus 70 degrees Fahrenheit (minus 56.6 Celsius). Credit: NASA/NRL
On Aug. 9 at 11 p.m. EDT (Aug. 10 at 0300 UTC), Tropical Depression 07W formed near latitude 16.8 degrees north and longitude 118.3 degrees east, about 204 nautical miles northwest of Manila, Philippines.
When it formed it was close enough to the Philippines to generate warnings. Tropical cyclone wind signal #1 was posted for western portions of Ilocos Norte and Sur, La Union, western parts of Pangasinan, and northern part of Zambales. Those warnings were dropped by Aug. 10 as the system moved west and away from the Philippines.
Infrared imagery gathered on Aug. 9 at 10:20 a.m. EDT (1420 UTC) was from the Moderate Resolution Imaging Spectroradiometer or MODIS instrument. MODIS flies aboard NASA’s Terra satellite. MODIS gathered temperature information about 07W’s cloud tops. Infrared data provides temperature information, and the strongest thunderstorms that reach high into the atmosphere have the coldest cloud top temperatures.
MODIS found the most powerful thunderstorms were around the center of circulation, and several other areas around the center where temperatures were as cold as or colder than minus 80 degrees Fahrenheit (minus 62.2 Celsius). Those areas were surrounded by thunderstorms slightly less high in the atmosphere, but still powerful rainmakers with cloud top temperatures as cold as or colder than minus 70 degrees Fahrenheit (minus 56.6 Celsius). Cloud top temperatures that cold indicate strong storms with the potential to generate heavy rainfall.
Tropical Depression 07W became a tropical storm at 5 a.m. EDT (0900 UTC) on Aug, 10 and was renamed Tropical Storm Mekkhala. Mekkhala is known locally in the Philippines as Ferdie. The storm’s maximum sustained winds had increased to 35 knots (40 mph). It was centered near latitude 20.2 degrees north and longitude 118.7 degrees east, about 332 nautical miles south-southwest of Taipei, Taiwan. Mekkhala was moving to the north.
The Joint Typhoon Warning Center expects that Mekkhala will continue to move north before moving ashore in southern China.
Tropical cyclones/hurricanes are the most powerful weather events on Earth. NASA’s expertise in space and scientific exploration contributes to essential services provided to the American people by other federal agencies, such as hurricane weather forecasting.
Aug. 10, 2020 – NASA Sees Compact Tropical Storm Jangmi Exiting East China Sea
Tropical Storm Jangmi was exiting the East China Sea and moving toward the Sea of Japan when NASA’s Aqua satellite measured the strength of the system.
On Aug. 9 at 10:20 a.m. EDT (1420 UTC) NASA’s Aqua satellite gathered temperature information about Tropical Storm Jangmi’s cloud tops. Aqua found the most powerful thunderstorms (red) around the center where cloud top temperatures were as cold as or colder than minus 70 degrees Fahrenheit (minus 56.6 Celsius). Credit: NASA/NRL
Jangmi formed as a depression on Aug. 8. At 5 a.m. EDT (0900 UTC), Tropical Depression 05W formed about 377 miles northeast of Manila, Philippines. Locally in the Philippines, the depression was known as Enteng. By 5 a.m. EDT (0900 UTC) on Aug. 9, the depression strengthened into a tropical storm.
On Aug. 9 at 10:20 a.m. EDT (1420 UTC) infrared data from the Moderate Resolution Imaging Spectroradiometer or MODIS instrument that flies aboard NASA’s Aqua satellite provided a look at cloud top temperatures in Tropical Storm Jangmi as it was about to move out of the East China Sea. Strongest thunderstorms that reach high into the atmosphere have the coldest cloud top temperatures.
MODIS found the most powerful thunderstorms were around the center of circulation, where temperatures were as cold as or colder than minus 70 degrees Fahrenheit (minus 56.6 Celsius). Cloud top temperatures that cold indicate strong storms with the potential to generate heavy rainfall.
On Aug. 10, the Joint Typhoon Warning Center noted that animated multispectral satellite imagery showed a partially exposed low-level circulation center with building strong thunderstorms in the northwestern quadrant of the storm.
On Monday, August 10, 2020 at 5 a.m. EDT (0900 UTC), the Joint Typhoon Warning Center (JTWC) noted that Tropical storm Jangmi was located near latitude 34.2 degrees north and longitude 128.7 degrees east, approximately 48 nautical miles south of Chinhae, South Korea. Jangmi was moving at 23 knots (26 mph/43 kph) and had maximum sustained winds of 35 knots gusting to 45 knots (52 mph/ 83 kph).
Jangmi is moving northeast past South Korea and is forecast to move into the Sea of Japan where it is forecast to merge with an approaching mid-latitude elongated area of low pressure (trough) and then become extra-tropical.
Tropical cyclones/hurricanes are the most powerful weather events on Earth. NASA’s expertise in space and scientific exploration contributes to essential services provided to the American people by other federal agencies, such as hurricane weather forecasting.
Aug. 10, 2020 – NASA Infrared Data Confirms Depression Became Tropical Storm Elida
After Tropical Depression 09E formed near the coast of southwestern Mexico, infrared data from NASA’s Aqua satellite helped confirm its transition to a tropical storm.
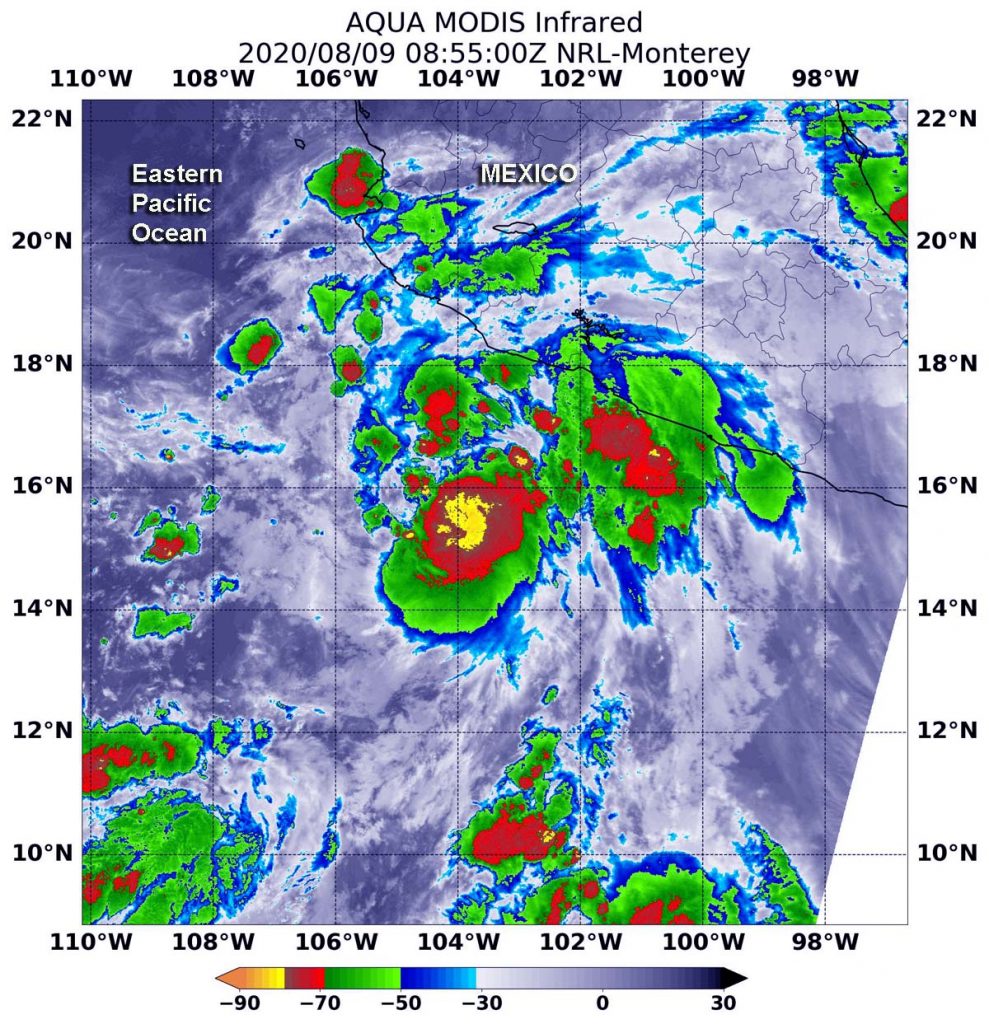
On Aug. 9 at 4:55 a.m. EDT (0855 UTC) NASA’s Aqua satellite gathered temperature information about Elida’s cloud tops. Aqua found the most powerful thunderstorms (yellow) were around the center of circulation, where temperatures were as cold as or colder than minus 80 degrees Fahrenheit (minus 62.2 Celsius). That area was surrounded by thunderstorms (red) slightly less high in the atmosphere, but still powerful rainmakers with cloud top temperatures as cold as or colder than minus 70 degrees Fahrenheit (minus 56.6 Celsius). Credit: NASA/NRL
On Aug. 9 at 11 p.m. EDT (Aug. 10 at 0300 UTC), Tropical Depression 09E formed near latitude 14.7 degrees north and longitude 102.6 degrees west, about 315 miles (510 km) south-southeast of Manzanillo, Mexico. By 5 a.m. EDT (0900 UTC), infrared imagery helped confirm that 09E strengthened into a tropical storm and was renamed Elida.
The infrared imagery gathered on Aug. 9 at 4:55 a.m. EDT (0855 UTC) that helped make that confirmation included data from the Moderate Resolution Imaging Spectroradiometer or MODIS instrument. MODIS flies aboard NASA’s Aqua satellite. MODIS gathered temperature information about Elida’s cloud tops. Infrared data provides temperature information, and the strongest thunderstorms that reach high into the atmosphere have the coldest cloud top temperatures.
MODIS found the most powerful thunderstorms were around the center of circulation, where temperatures were as cold as or colder than minus 80 degrees Fahrenheit (minus 62.2 Celsius). That area was surrounded by thunderstorms slightly less high in the atmosphere, but still powerful rainmakers with cloud top temperatures as cold as or colder than minus 70 degrees Fahrenheit (minus 56.6 Celsius). Cloud top temperatures that cold indicate strong storms with the potential to generate heavy rainfall.
At 5 a.m. EDT (0900 UTC) on Aug. 10, the National Hurricane Center (NHC) said the center of Tropical Storm Elida was located near latitude 18.3 degrees north and longitude 108.8 degrees west. That is about 145 miles (235 km) east-southeast of Socorro Island, Mexico. Elida is moving toward the west-northwest near 15 mph (24 kph), and this general motion is expected to continue through Wednesday. The estimated minimum central pressure is 995 millibars.
Maximum sustained winds are near 65 mph (100 kph) with higher gusts. Tropical-storm-force winds extend outward up to 60 miles (95 km) from the center. Strengthening is forecast during the next day or two, and Elida is expected to become a hurricane later today.
NHC cautioned, “Swells generated by Elida are expected to affect portions of the coast of west-central Mexico and the southern Baja California peninsula during the next couple of days. These swells are likely to cause life-threatening surf and rip current conditions.”
Tropical cyclones/hurricanes are the most powerful weather events on Earth. NASA’s expertise in space and scientific exploration contributes to essential services provided to the American people by other federal agencies, such as hurricane weather forecasting.
Aug. 05, 2020 – NASA Satellites Capture Isaias’ Nighttime Track Into Canada
Tropical Storm Isaias has transitioned into a post-tropical storm as it moved out of the U.S. and into eastern Canada on Aug. 5 and 6. NASA created an animation of nighttime satellite imagery that shows Isaias’ track up the U.S. East Coast. In addition, NASA’s Aqua satellite provided a view of Isaias’ powerful storms over New York and New England.
What is a Post-Tropical Storm?
A Post-Tropical Storm is a generic term for a former tropical cyclone that no longer possesses sufficient tropical characteristics to be considered a tropical cyclone. Former tropical cyclones that have become fully extratropical, subtropical, or remnant lows, make up three classes of post-tropical cyclones. In any case, they no longer possesses sufficient tropical characteristics to be considered a tropical cyclone. However, post-tropical cyclones can continue carrying heavy rains and high winds.
This animation of NASA-NOAA’s Suomi NPP satellite imagery shows the positions of Tropical Storm Isaias from Aug. 2 to Aug. 5 at night as it moved north along the U.S. East Coast. Courtesy: NASA Worldview, Earth Observing System Data and Information System (EOSDIS).
NASA Tracks Isaias at Night
Infrared instruments enable satellites to gather imagery on storms at night because they read temperature. At NASA’s Goddard Space Flight Center in Greenbelt, Md. an animation of imagery from the VIIRS instrument aboard NASA-NOAA’s Suomi NPP satellite imagery showed the positions of Tropical Storm Isaias from Aug. 2 to Aug. 5 at night as it moved north along the U.S. East Coast.
NASA’s Earth Observing System Data and Information System (EOSDIS) Worldview application provides the capability to interactively browse over 700 global, full-resolution satellite imagery layers and then download the underlying data. Many of the available imagery layers are updated within three hours of observation, essentially showing the entire Earth as it looks “right now.”
Isaias’ Rain Potential Over New York and New England
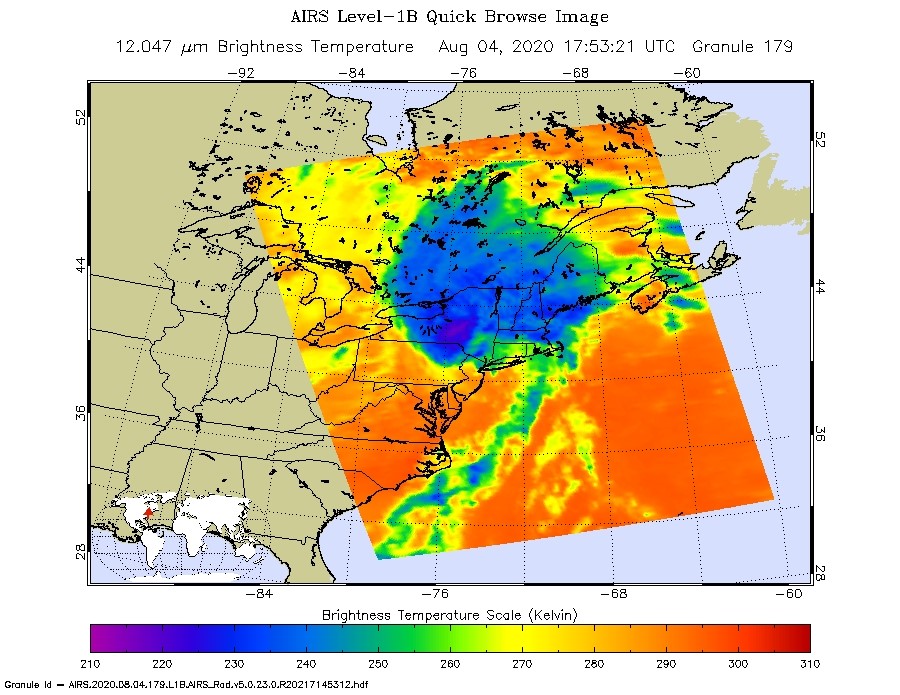
On Aug. 4 at 1:53 p.m. EDT (1753 UTC) NASA’s Aqua satellite analyzed cloud top temperatures in Tropical Storm Isaias using the Atmospheric Infrared Sounder or AIRS instrument. Isaias was centered near Albany, New York at the time of the over pass.
On Aug. 4 at 1:53 p.m. EDT (1753 UTC) NASA’s Aqua satellite analyzed Tropical Storm Isaias, centered near Albany, NY at the time, using the Atmospheric Infrared Sounder or AIRS instrument. AIRS found coldest cloud top temperatures as cold as or colder than (purple) minus 63 degrees Fahrenheit (minus 53 degrees Celsius). Credit: NASA JPL/Heidar Thrastarson
Cloud top temperatures provide information to forecasters about where the strongest storms are located within a tropical cyclone. The stronger the storms, the higher they extend into the troposphere, and the colder the cloud temperatures. AIRS found coldest cloud top temperatures as cold as or colder than minus 63 degrees Fahrenheit (minus 53 degrees Celsius). NASA research has shown that cloud top temperatures that cold indicate strong storms that have the capability to create heavy rain.
That heavy rain potential was included in the National Hurricane Center (NHC) forecast at 5 p.m. EDT, “Heavy rainfall near the path of Isaias, through the Hudson River Valley, is likely to result in flash flooding, particularly through urban areas and the surrounding terrain of the Catskills, Adirondack and Green Mountain Ranges through Tuesday night. Scattered minor to moderate river flooding is likely across portions of the Mid-Atlantic.”
Status of Isaias on Aug. 6
At 5 a.m. EDT (0900 UTC) on Aug. 6, the center of Post-Tropical Cyclone Isaias was located near latitude 47.5 degrees north and longitude 71.8 degrees west. That is about 55 miles (90 km) north-northwest of Quebec City, Quebec, Canada. The post-tropical cyclone is moving toward the north-northeast near 28 mph (44 kph), and this general motion is expected with a decrease in forward speed through tonight.
Maximum sustained winds are near 40 mph (65 kph) with higher gusts. Weakening is expected, and the winds are expected to drop below tropical-storm force this morning. Tropical-storm-force winds extend outward up to 140 miles (220 km) to the northeast and east of the center primarily over and near the St. Lawrence River. The estimated minimum central pressure is 1000 millibars.
NHC Forecast for Isaias
The NHC said, “Gale-force winds will continue over and near the St. Lawrence River this morning. Gale-force wind gusts are possible elsewhere over southeastern Quebec today. Rainfall accumulations of 1 to 3 inches are expected along and near the track of Isaias across southern Quebec. The post-tropical cyclone is expected to dissipate over southeastern Canada on Thursday, Aug. 7.”
NASA Researches Tropical Cyclones
Hurricanes/tropical cyclones are the most powerful weather events on Earth. NASA’s expertise in space and scientific exploration contributes to essential services provided to the American people by other federal agencies, such as hurricane weather forecasting.
For more than five decades, NASA has used the vantage point of space to understand and explore our home planet, improve lives and safeguard our future. NASA brings together technology, science, and unique global Earth observations to provide societal benefits and strengthen our nation. Advancing knowledge of our home planet contributes directly to America’s leadership in space and scientific exploration.