Sep. 22, 2020 – NASA Analyzes Tropical Storm Lowell’s Very Cold Cloud Tops
NASA analyzed the cloud top temperatures in Tropical Storm Lowell using infrared light to determine the strength of the storm. Infrared imagery revealed that the strongest storms were around Lowell’s center and in its southern quadrant because of northerly wind shear.
Tropical Storm Lowell developed about 500 miles away from Baja California, Mexico. On Sept. 21, it formed as Tropical Depression 17E. By 5 p.m. EDT, the depression organized and strengthened into a tropical storm and was renamed Lowell.
Lowell is Battling Wind Shear
“Lowell continues to be affected by north-northeasterly shear, and the center is estimated to be located near the north-northeastern edge of the main convective mass,” said Senior Hurricane Specialist Richard Pasch at NOAA’s National Hurricane Center in Miami, Fla.
In general, wind shear is a measure of how the speed and direction of winds change with altitude. Tropical cyclones are like rotating cylinders of winds. Each level needs to be stacked on top each other vertically in order for the storm to maintain strength or intensify. Wind shear occurs when winds at different levels of the atmosphere push against the rotating cylinder of winds, weakening the rotation by pushing it apart at different levels.
An Infrared View of Lowell
One of the ways NASA researches tropical cyclones is using infrared data that provides temperature information. Cloud top temperatures identify where the strongest storms are located. The stronger the storms, the higher they extend into the troposphere, and the colder the cloud top temperatures.
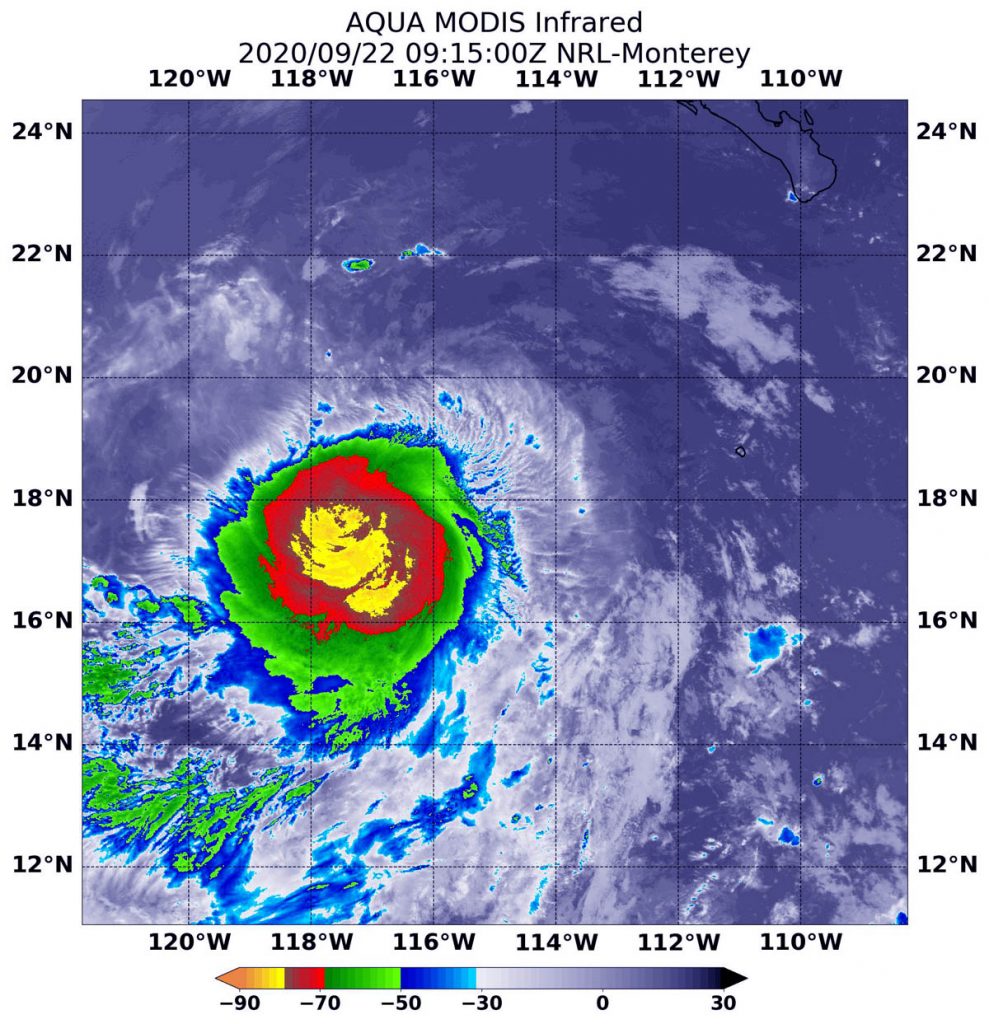
On Sept. 22 at 4:15 a.m. EDT (0915 UTC) NASA’s Aqua satellite analyzed the storm using the Moderate Resolution Imaging Spectroradiometer or MODIS instrument. The MODIS imagery showed the strongest storms were around Lowell’s center of circulation and pushed into its southern quadrant. Temperatures in those areas were as cold as minus 80 degrees Fahrenheit (minus 62.2 Celsius). An area of strong storms with cloud top temperatures as cold as minus 70 degrees Fahrenheit (minus 56.6. degrees Celsius) surrounded the center. NASA research has shown that cloud top temperatures that cold indicate strong storms that have the capability to create heavy rain.
NASA then provides data to tropical cyclone meteorologists so they can incorporate it in their forecasts.
Lowell’s Status on Sept. 22
At 5 a.m. EDT (0900 UTC) on Sept. 22, the center of Tropical Storm Lowell was located near latitude 18.0 degrees north and longitude 115.6 degrees west. That is about 500 miles (805 km) southwest of the southern tip of Baja California, Mexico. Lowell is moving toward the west-northwest near 13 mph (20 kph). Maximum sustained winds are near 45 mph (75 kph) with higher gusts. The estimated minimum central pressure is 1001 millibars.
Lowell’s Forecast
Some strengthening is forecast during the next couple of day as Lowell continues to move away from land areas and in a west-northwest direction followed by a turn toward the west. Lowell is no threat to land areas.
NASA Researches Earth from Space
For more than five decades, NASA has used the vantage point of space to understand and explore our home planet, improve lives and safeguard our future. NASA brings together technology, science, and unique global Earth observations to provide societal benefits and strengthen our nation. Advancing knowledge of our home planet contributes directly to America’s leadership in space and scientific exploration.
For updated forecasts, visit: www.hurricanes.gov