Douglas – Eastern Pacific Ocean

July 30, 2020 – NASA Finds Post-Tropical Low Douglas Crossing a Line   

The strong wind shear that weakened Douglas to a tropical storm early on July 29 has further weakened it to a post-tropical low-pressure area. NASA’s Aqua satellite provided an infrared view of those remnants, headed across the International Date Line in the Pacific Ocean.

Aqua image of Douglas
On July 30 at 0105 UTC (July 29 at 9:05 p.m. EDT), the MODIS instrument that flies aboard NASA’s Aqua satellite gathered infrared data on Douglas that confirmed wind shear was adversely affecting the storm. Persistent southerly vertical wind shear pushed strongest storms (yellow) north of the center where cloud top temperatures are as cold as minus 50 degrees Fahrenheit (minus 45.5 Celsius). Credit: NASA/NRL

NASA’s Aqua Satellite Shows a Post-tropical System 

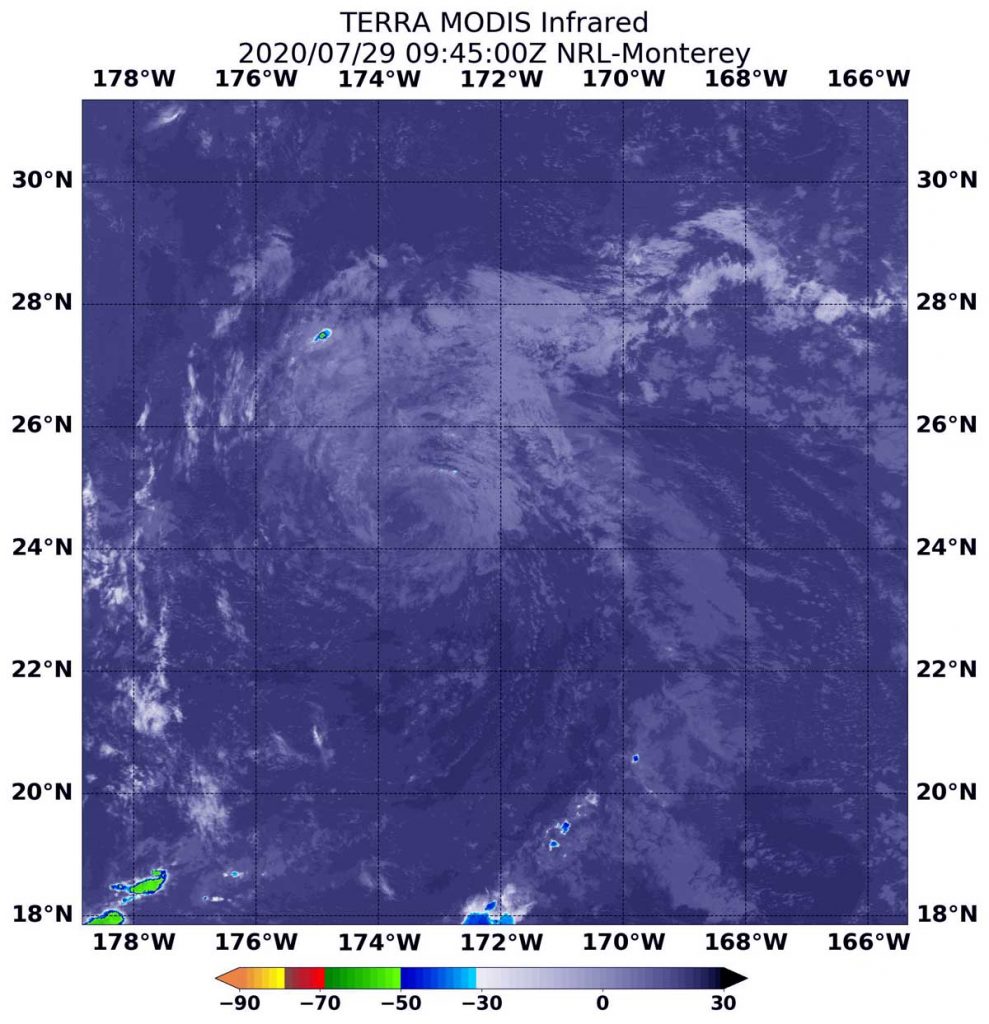
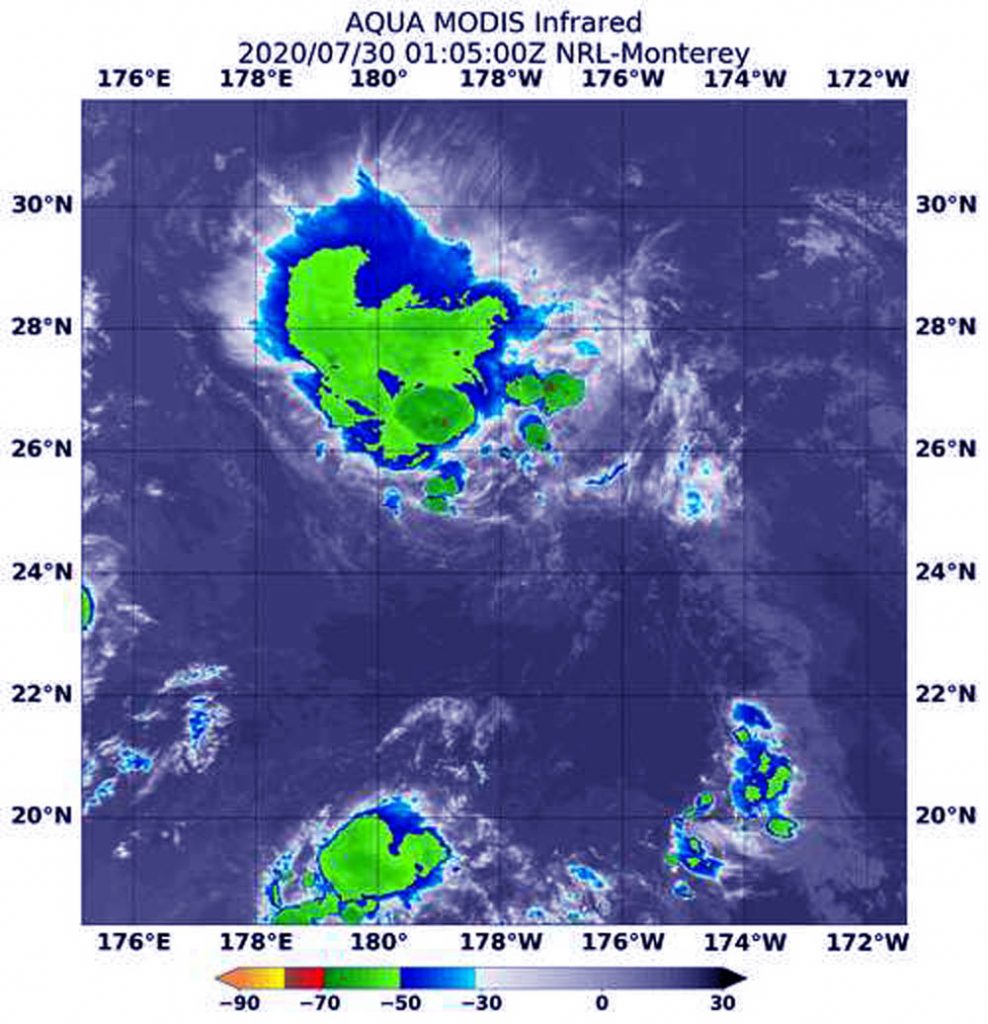
NASA’s Aqua satellite uses infrared light to analyze the strength of storms by providing temperature information about the system’s clouds. The strongest thunderstorms that reach high into the atmosphere have the coldest cloud top temperatures.

On July 30 at  0105 UTC  (July 29 at 9:05 p.m. EDT), the Moderate Resolution Imaging Spectroradiometer or MODIS instrument that flies aboard NASA’s Aqua satellite gathered infrared data on Douglas that confirmed wind shear had reduced the storm to a post-tropical low pressure area. The wind shear pushed the coldest cloud tops northeast of the center. Those storms had cloud top temperatures as cold as minus 50 degrees Fahrenheit (minus 45.5 Celsius).

What is a Post-tropical Cyclone?

NOAA’s National Hurricane Center defines a post-tropical cyclone as a former tropical cyclone. This generic term describes a cyclone that no longer possesses sufficient tropical characteristics to be considered a tropical cyclone. Post-tropical cyclones can continue carrying heavy rains and high winds. Note that former tropical cyclones that have become fully extratropical… as well as remnant lows…are two classes of post-tropical cyclones.

Douglas Ready to Cross a Line

NOAA’s Central Pacific Hurricane Center (CPHC) issued the final advisory on Douglas on July 29 at 11 a.m. EDT (5 a.m. HST/1500 UTC). Douglas had degenerated into a post-tropical low-pressure area about 1,135 miles (1,830 km) west-northwest of Honolulu, Hawaii. It was centered near latitude 24.7 degrees north and longitude 175.4 degrees west. The post-tropical cyclone is moving toward the west near 23 mph (37 kph). Maximum sustained winds are near 35 mph (55 kph) with higher gusts.

Douglas’ remnants were expected to cross the International Date Line early on July 30, and it is expected to dissipate shortly after the crossing.

Established in 1884, the International Date Line passes through the mid-Pacific Ocean and generally follows a 180 degrees longitude north-south line on the Earth. East of the Date Line lies the central Pacific Ocean. West of the dateline is the western Pacific Ocean.

NASA Researches Tropical Cyclones

Hurricanes/tropical cyclones are the most powerful weather events on Earth. NASA’s expertise in space and scientific exploration contributes to essential services provided to the American people by other federal agencies, such as hurricane weather forecasting.

For more than five decades, NASA has used the vantage point of space to understand and explore our home planet, improve lives and safeguard our future. NASA brings together technology, science, and unique global Earth observations to provide societal benefits and strengthen our nation. Advancing knowledge of our home planet contributes directly to America’s leadership in space and scientific exploration.

For updated forecasts. visit: www.nhc.noaa.gov

By Rob Gutro
NASA’s Goddard Space Flight Center

Potential Tropical Cyclone 9 – Atlantic Ocean

July 29, 2020 – NASA Follows Potential Tropical Cyclone 9 into Eastern Caribbean

NASA’s Terra satellite obtained visible imagery of Potential Tropical Cyclone 9 after it moved into the Eastern Caribbean Sea and continued bringing heavy rainfall and gusty winds to the Leeward Islands, the U.S. and British Virgin Islands and Puerto Rico.

Terra image of PTC 9
NASA’s Terra satellite provided a visible image to forecasters of Potential Tropical Cyclone 9 on July 29 at 11:20 a.m. EDT (1520 UTC) after it moved into the eastern Caribbean Sea. Image Courtesy: NASA Worldview, Earth Observing System Data and Information System (EOSDIS)

Warnings and Watches Abound

The National Hurricane Center has issued a number of warnings and watches associated with this potential tropical cyclone. A Tropical Storm Warning is in effect for  Puerto Rico, Vieques, Culebra, the U.S. Virgin Islands, the British Virgin Islands, Montserrat, St. Kitts, Nevis, and Anguilla, St. Martin, and St. Barthelemy, Saba and St. Eustatius, St. Maarten, the Dominican Republic’s entire southern and northern coastlines, the north coast of Haiti from Le Mole St Nicholas eastward to the northern border with the Dominican Republic, the Turks and Caicos Islands and the southeastern Bahamas including the Acklins, Crooked Island, Long Cay, the Inaguas, Mayaguana, and the Ragged Islands.

A Tropical Storm Watch is in effect for the central Bahamas, including Cat Island, the Exumas, Long Island, Rum Cay, and San Salvador.

Circulation Not Yet Well Defined on NASA Imagery

The Moderate Resolution Imaging Spectroradiometer or MODIS instrument that flies aboard NASA’s Terra satellite captured a visible image of Potential Tropical Cyclone 9 on July 29 at 11:20 a.m. EDT (1520 UTC). The image showed strong thunderstorms around the center of circulation and in fragmented bands northeast and southwest of the center. Deep convection has consolidated and there is some evidence of banding over the northern and western portions of the large circulation.

At 11 a.m. EDT, National Hurricane Center (NHC) forecaster Daniel Brown noted, “Surface observations from the Lesser Antilles show that the broader circulation of the disturbance has become slightly better defined but a recent Air Force Reserve reconnaissance aircraft was still unable to find a well-defined circulation.  Therefore, the system has not yet become a tropical cyclone.”

Potential Tropical Cyclone 9’s Current Status at 2 p.m. EDT

At 2 p.m. EDT (1800 UTC), the disturbance was centered near latitude 16.2 degrees north and longitude 64.7 degrees west. The system is moving toward the west-northwest near 23 mph (37 kph), and this general motion with a reduction in forward speed is expected over the next few days. NHC noted the maximum sustained winds are near 45 mph (75 kph) with higher gusts. Some increase in strength is forecast through tonight, with weakening likely on Thursday due to land interaction.  Some re-strengthening is possible by this weekend. The estimated minimum central pressure is 1006 millibars.

Environmental conditions are expected to be conducive to additional development, and a tropical storm is forecast to form later today or tonight. NHC said the formation chance through 48 hours remains high at 90 percent.

The Forecast Track  

The NHC forecast calls for the low pressure area to strengthen into a tropical storm later in the day on July 29, 2020. If it does, it would be renamed Isaias.

On the forecast track, the system will move near or just south of Puerto Rico later today and tonight, near or over Hispaniola on Thursday, and near or over eastern Cuba on Friday. It is then forecast to cross the Dominican Republic and Haiti, and proceed northwest over eastern Cuba, heading toward the Florida Keys.

NASA’s Terra satellite is one in a fleet of NASA satellites that provide data for hurricane research.

Tropical cyclones/hurricanes are the most powerful weather events on Earth. NASA’s expertise in space and scientific exploration contributes to essential services provided to the American people by other federal agencies, such as hurricane weather forecasting.

For updated forecasts, visit: www.nhc.noaa.gov

By Rob Gutro
NASA’s Goddard Space Flight Center

Douglas – Eastern Pacific Ocean

July 29, 2020 – NASA’s Terra Satellite Finds No Strong Storms Left in Tropical Storm Douglas  

Strong wind shear has been the undoing of Tropical Storm Douglas. NASA’s Terra satellite provided infrared data revealed the tropical cyclone was devoid of strong storms, indicating wind shear has weakened it.

Terra image of Douglas
On July 29 at 5:45 a.m. EDT (0945 UTC), the MODIS instrument that flies aboard NASA’s Terra satellite gathered infrared data on Douglas showing that persistent south to southwest vertical wind shear had taken its toll on the storm. There were no strong thunderstorms remaining. Credit: NASA/NRL

One Warning Remains for Douglas

On July 29, a Tropical Storm Warning is in effect for portions of the Papahanaumokuakea Marine National Monument from Maro Reef to Lisianski.

NASA’s Terra Satellite Reveals Effects of Wind Shear 

NASA’s Terra satellite uses infrared light to analyze the strength of storms by providing temperature information about the system’s clouds. The strongest thunderstorms that reach high into the atmosphere have the coldest cloud top temperatures. However, cloud tops in Douglas showed no very cold cloud tops on July 29 at 5:45 a.m. EDT (0945 UTC) when they were imaged by the Moderate Resolution Imaging Spectroradiometer or MODIS instrument that flies aboard NASA’s Terra satellite.

Wind shear had sapped the strength of the storm and prevented strong thunderstorms from forming. Tropical cyclones are made up of hundreds of thunderstorms, and when there are no strong storms present in satellite imagery, it is a sure sign of weakening.

At 5 a.m. EDT (0900 UTC) on July 29/11 p.m. HST on July 28, NOAA’s Central Pacific Hurricane Center (CPHC) in Honolulu, Hawaii noted, “Due to persistent southerly vertical wind shear, Douglas has been devoid of deep convection for nearly 24 hours, and it appears that it will soon be a post-tropical remnant low.”

About Wind Shear  

The shape of a tropical cyclone provides forecasters with an idea of its organization and strength. Wind shear occurs when outside winds batter a storm and change the storm’s shape pusing much of the associated clouds and rain to one side of it.

In general, wind shear is a measure of how the speed and direction of winds change with altitude. Tropical cyclones are like rotating cylinders of winds. Each level needs to be stacked on top each other vertically in order for the storm to maintain strength or intensify. Wind shear occurs when winds at different levels of the atmosphere push against the rotating cylinder of winds, weakening the rotation by pushing it apart at different levels. Southwesterly wind shear was pushing the bulk of Douglas’ clouds to the north-northeast of the center.

Status of Tropical Storm Douglas on July 29, 2020

At 8 a.m. EDT (2 a.m. HST/1200 UTC), the center of Tropical Storm Douglas was located near latitude 24.7 degrees north and longitude 174.3 degrees west. Douglas is about 320 miles (515 km) southeast of Midway Island. Douglas was moving toward the west near 23 mph (37 km/h), and this general motion is expected to continue until Douglas crosses the International Date Line in about 24 hours. Maximum sustained winds were near 40 mph (65 kph) with higher gusts. The estimated minimum central pressure is 1010 millibars.

Forecast for Douglas

NOAA’s CPHC said, “Large seas and swells generated by Douglas will impact portions of the Papahanaumokuakea Marine National Monument west of Maro Reef through Wednesday. These swells may produce large breaking waves that could inundate some of the lower-lying atolls. Rainfall associated with Douglas will impact portions of the Papahanaumokuakea Marine National Monument west of Maro Reef through Wednesday.”

Weakening is forecast during the next two days, and Douglas is expected to dissipate shortly after crossing the Date Line.

NASA Researches Tropical Cyclones

Hurricanes/tropical cyclones are the most powerful weather events on Earth. NASA’s expertise in space and scientific exploration contributes to essential services provided to the American people by other federal agencies, such as hurricane weather forecasting.

For more than five decades, NASA has used the vantage point of space to understand and explore our home planet, improve lives and safeguard our future. NASA brings together technology, science, and unique global Earth observations to provide societal benefits and strengthen our nation. Advancing knowledge of our home planet contributes directly to America’s leadership in space and scientific exploration.

For updated forecasts. visit: www.nhc.noaa.gov

By Rob Gutro
NASA’s Goddard Space Flight Center

Douglas – Eastern Pacific Ocean

July 28, 2020 – NASA’s Terra Satellite Finds Wind Shear Weakening Tropical Storm Douglas  

Former Hurricane Douglas has encountered strong wind shear after passing the Hawaiian Islands and has now weakened to a tropical storm. NASA’s Terra satellite provided infrared data to find that the strongest storms were displaced from the center as the storm weakens.

Terra image of Douglas
On July 28 at 5 a.m. EDT (0900 UTC), the MODIS instrument that flies aboard NASA’s Terra satellite gathered infrared data on Douglas that confirmed wind shear was adversely affecting the storm. Persistent south to southwest vertical wind shear showed strongest storms (yellow) pushed north and northeast of the center where cloud top temperatures are as cold as minus 50 degrees Fahrenheit (minus 45.5 Celsius). Credit: NASA/NRL

Warnings in Effect for Douglas on July 28

On July 28, NOAA’s Central Pacific Hurricane Center (CPHC) continued posting warnings and watches. A Tropical Storm Warning is in effect for portions of the Papahanaumokuakea Marine National Monument from Nihoa to French Frigate Shoals to Maro Reef. A Tropical Storm Watch is in effect for portions of the Papahanaumokuakea National Marine Monument from Maro Reef to Lisianski.

NASA’s Terra Satellite Reveals Effects of Wind Shear 

NASA’s Terra satellite uses infrared light to analyze the strength of storms by providing temperature information about the system’s clouds. The strongest thunderstorms that reach high into the atmosphere have the coldest cloud top temperatures.

On July 28 at 5 a.m. EDT (0900 UTC), the Moderate Resolution Imaging Spectroradiometer or MODIS instrument that flies aboard NASA’s Terra satellite gathered infrared data on Douglas that confirmed wind shear was adversely affecting the storm. Persistent south to southwest vertical wind shear showed strongest storms were pushed north and northeast of the center. Those storms had cloud top temperatures as cold as minus 50 degrees Fahrenheit (minus 45.5 Celsius). Satellite imagery also shows the low-level circulation center became exposed.

The wind shear and displacement of storms has led to a rapid weakening trend over the past 24 hours.

Wind Shear Affecting Douglas

The shape of a tropical cyclone provides forecasters with an idea of its organization and strength. When outside winds batter a storm, it can change the storm’s shape and push much of the associated clouds and rain to one side of it. That is what wind shear does.

In general, wind shear is a measure of how the speed and direction of winds change with altitude. Tropical cyclones are like rotating cylinders of winds. Each level needs to be stacked on top each other vertically in order for the storm to maintain strength or intensify. Wind shear occurs when winds at different levels of the atmosphere push against the rotating cylinder of winds, weakening the rotation by pushing it apart at different levels.

Status of Tropical Storm Douglas on July 28, 2020

At 8 a.m. EDT (2 a.m. HST/1200 UTC), the center of Tropical Storm Douglas was located near latitude 23.8 degrees north and longitude 165.7 degrees west. That is about 40 miles (60 km) east of French Frigate Shoals, and about 525 miles (845 km) west-northwest of Honolulu, Hawaii.

Douglas was moving toward the west-northwest near 18 mph (30 kph), and this general motion is expected to continue the next couple of days. Maximum sustained winds were near 50 mph (85 kph) with higher gusts. The estimated minimum central pressure was 1001 millibars.

Forecast for Douglas

NOAA’s CPHC said weakening is forecast over the next couple of days, and Douglas is expected to dissipate by Thursday, July 29. Interests elsewhere in the Papahanaumokuakea Marine National Monument should monitor the progress of this system.

NASA Researches Tropical Cyclones

Hurricanes/tropical cyclones are the most powerful weather events on Earth. NASA’s expertise in space and scientific exploration contributes to essential services provided to the American people by other federal agencies, such as hurricane weather forecasting.

For more than five decades, NASA has used the vantage point of space to understand and explore our home planet, improve lives and safeguard our future. NASA brings together technology, science, and unique global Earth observations to provide societal benefits and strengthen our nation. Advancing knowledge of our home planet contributes directly to America’s leadership in space and scientific exploration.

For updated forecasts. visit: www.nhc.noaa.gov

By Rob Gutro
NASA’s Goddard Space Flight Center

Douglas – Eastern Pacific Ocean

July 27, 2020 – NASA Sees Hurricane Douglas Brush Hawaii

Imagery from NASA’s Terra satellite was used to create an animation showing Douglas’ movement past the Hawaiian Islands.

Worldview animation of Dougals
Visible imagery from MODIS instrument aboard NASA’s Terra satellite was compiled from July 25 to 26 and made into an animation using NASA’s Worldview application. The imagery showed Douglas’ movement past the Hawaiian Islands. Credit: NASA Worldview, Earth Observing System Data and Information System (EOSDIS)

Although the Hawaiian Islands missed a landfall from Hurricane Douglas, the storm was certainly close enough to bring strong surf, heavy rains and gusty winds to the islands. NASA’s Terra satellite imagery showed the storm’s track as it moved just north of the islands.

Visible imagery of Hurricane Douglas from July 25 to 26, taken from the Moderate Resolution Imaging Spectroradiometer or MODIS instrument aboard NASA’s Terra satellite was compiled and made into an animation using NASA’s Worldview application. The imagery showed Douglas’ center staying just off shore from the Hawaiian Islands.

NASA’s Earth Observing System Data and Information System (EOSDIS) Worldview application provides the capability to interactively browse over 700 global, full-resolution satellite imagery layers and then download the underlying data. Many of the available imagery layers are updated within three hours of observation, essentially showing the entire Earth as it looks “right now.”

Terra image of Douglas
Visible imagery from MODIS instrument aboard NASA’s Terra satellite on July 26 showed Douglas moving past the Hawaiian Islands. Credit: NASA Worldview, Earth Observing System Data and Information System (EOSDIS)

Warnings in Effect on July 27

NOAA’s Central Pacific Hurricane Center (CPHC) posted several updates to the warnings on July 27. A Hurricane Warning is in effect for portions of the Papahanaumokuakea Marine National Monument from Nihoa to French Frigate Shoals. A Tropical Storm Warning is in effect for portions of the Papahanaumokuakea Marine National Monument from French Frigate Shoals to Maro Reef. A Hurricane Watch is in effect for portions of the Papahanaumokuakea Marine National Monument from French Frigate Shoals to Maro Reef, and a Tropical Storm Watch is in effect for portions of the Papahanaumokuakea Marine National Monument from Maro Reef to Lisianski.

Douglas’ Status on July 27, 2020

NOAA’s CPHC noted at 11 a.m. EDT (5 a.m. HST/1500 UTC), the center of Hurricane Douglas was located near latitude 22.9 degrees north and longitude 160.4 degrees west. Douglas is moving toward the west-northwest near 17 mph (28 kph), and this general motion will continue the next couple of days, with a slight turn toward the west. Maximum sustained winds are near 90 mph (150 kph) with higher gusts. The estimated minimum central pressure is 987 millibars.

In Hawaii, rainfall associated with Douglas is expected to affect portions of the main Hawaiian Islands today. Total rain accumulations of 3 to 6 inches with locally higher amounts are possible, with the greatest rainfall in elevated terrain on Kauai. Heavy rainfall will also affect portions of the Papahanaumokuakea Marine National Monument the next couple of days.

Douglas’ Forecast

NOAA’s CPHC noted, “Hurricane force winds are expected over portions of the Papahanaumokuakea Marine National Monument from Nihoa to French Frigate Shoals later today and tonight. Tropical storm conditions are expected from French Frigate Shoals to Maro Reef Tuesday and Tuesday night, with hurricane conditions possible.

Tropical storm conditions are possible from Maro Reef to Lisianski Tuesday night and Wednesday.

Large swells generated by Douglas will affect a large swath of the Papahanaumokuakea Marine National Monument the next couple of days. Weakening is forecast during the next couple of days.

For more than five decades, NASA has used the vantage point of space to understand and explore our home planet, improve lives and safeguard our future. NASA brings together technology, science, and unique global Earth observations to provide societal benefits and strengthen our nation. Advancing knowledge of our home planet contributes directly to America’s leadership in space and scientific exploration.

For updated forecasts, visit: www.nhc.noaa.gov

By Rob Gutro
NASA’s Goddard Space Flight Center

Hanna (was TD08) – Gulf of Mexico

July 27, 2020 (part 2) – NASA Tracks Hanna’s Soaking Path into Mexico

NASA’s Aqua satellite provided infrared data on Tropical Depression Hanna while imagery from NASA-NOAA’s Suomi NPP satellite was used to create an animation showing its movement from Texas to Mexico. Infrared data can reveal the location of powerful storms that generate heavy rainfall and Hanna drenched Texas upon landfall over the weekend of July 25-26.

Aqua image of Hanna
On July 26 at 3:35 p.m. EDT (1935 UTC) NASA’s Aqua satellite analyzed Hanna in infrared light using the AIRS instrument. The strongest storms with the coldest cloud top temperatures were located over extreme south Texas and northeastern Mexico. Coldest cloud top temperatures were as cold as or colder than (purple) minus 63 degrees Fahrenheit (minus 53 degrees Celsius). Credit: NASA JPL/Heidar Thrastarson

Tracking Hanna’s Path to Mexico

Visible imagery of Hurricane Hanna from July 23 to 26, taken from the Visible Infrared Imaging Radiometer Suite (VIIRS) instrument aboard NASA-NOAA’s Suomi NPP satellite was compiled and made into an animation using NASA’s Worldview application. The imagery showed Hanna’s landfall in east central Texas and its track to the southwest into north central Mexico.

NASA’s Earth Observing System Data and Information System (EOSDIS) Worldview application provides the capability to interactively browse over 700 global, full-resolution satellite imagery layers and then download the underlying data. Many of the available imagery layers are updated within three hours of observation, essentially showing the entire Earth as it looks “right now.”

Suomi NPP animation of Hanna
Visible imagery from VIIRS instrument aboard NASA-NOAA’s Suomi NPP satellite was compiled from July 23 to 26 and made into an animation using NASA’s Worldview application. The imagery showed Hanna’s landfall in east central Texas and its track to the southwest into north central Mexico. Credit: NASA Worldview, Earth Observing System Data and Information System (EOSDIS)

Hanna the Rainmaker Breaks Records

Hanna has been a big rainmaker. On July 25, the National Weather Service (NWS) at Corpus Christi, Texas reported 2.57 inches of rainfall from Hanna. Although not a record, it was a lot of rain.

On July 26, the NWS in Brownsville, Texas reported a new record for rainfall of 3.46 inches, breaking the old record of 2.74 inches that was set in 1890. Record rainfall was also recorded at McAllen Miller International Airport where the NWS reported 4.52 inches of rainfall on July 26, breaking the old record of 1.41 inches set in the year 2000.

An Infrared Look at Hanna’s Rainmaking Capability

One of the ways NASA researches tropical cyclones is using infrared data that provides temperature information. The AIRS instrument aboard NASA’s Aqua satellite captured a look at those temperatures in Hanna and gave insight into the size of the storm and its rainfall potential.

Cloud top temperatures provide information to forecasters about where the strongest storms are located within a tropical cyclone. The stronger the storms, the higher they extend into the troposphere, and the colder the cloud top temperatures.

On July 26 at 3:35 p.m. EDT (1935 UTC) NASA’s Aqua satellite analyzed the storm using the Atmospheric Infrared Sounder or AIRS instrument. The strongest storms with the coldest cloud top temperatures were located over extreme south Texas and northeastern Mexico. AIRS found coldest cloud top temperatures as cold as or colder than minus 63 degrees Fahrenheit (minus 53 degrees Celsius). NASA research has shown that cloud top temperatures that cold indicate strong storms that have the capability to create heavy rain.

NASA provides the AIRS infrared data to forecasters at NOAA’s National Hurricane Center or NHC so they can incorporate it into their forecasting. The AIRS instrument is one of six instruments flying on board NASA’s Aqua satellite, launched on May 4, 2002.

More Heavy Rainfall from Hanna

The strong storms seen in infrared imagery continue to generate heavy rain and that rainfall is expected in parts of south Texas and in northern Mexico on July 27.

NHC forecasters said, “Hanna is expected to produce the following rain accumulations and flood threats through Monday: Far south Texas can expect an additional 1 to 2 inches. The northern Mexican states of Coahuila, Nuevo Leon, and Tamaulipas can expect 4 to 8 inches. Flash flooding and mudslides are possible across these Mexican states. In addition, the northern Mexican states of northern Zacatecas, northern San Luis Potosi, and eastern Durango can expect 1 to 2 inches.

Hanna’s Status on July 27, 2020

NOAA’s National Hurricane Center (NHC) reported at 5 a.m. EDT (0900 UTC) on July 26, the center of Tropical Depression Hanna was located near latitude 24.1 north, longitude 102.9 west. Hanna was centered about 65 miles (105 km) north of Fresnillo, Mexico. The estimated minimum central pressure was 1004 millibars. The depression was moving toward the west near 5 mph (7 kph) and this motion is expected to continue today. Maximum sustained winds were near 25 mph (35 kph) with higher gusts.

Hanna’s Forecast

NHC noted, “Ocean swells generated by Hanna will continue to affect much of the Texas and northeastern Mexico coasts early today. These swells may cause rip current conditions. Hanna will weaken into a remnant low today.”

For more than five decades, NASA has used the vantage point of space to understand and explore our home planet, improve lives and safeguard our future. NASA brings together technology, science, and unique global Earth observations to provide societal benefits and strengthen our nation. Advancing knowledge of our home planet contributes directly to America’s leadership in space and scientific exploration.

For updated forecasts, visit: www.nhc.noaa.gov

By Rob Gutro
NASA’s Goddard Space Flight Center

Hanna (was TD08) – Gulf of Mexico

July 27, 2020 (part 1) – Hurricane Hanna Brings Heavy Rains to Parts of South Texas
IMERG data of rainfall from Hanna
Surface rainfall accumulations (mm) estimated from the NASA IMERG satellite precipitation product from 00 UTC 22 to 00 UTC 27 July 2020 in association with the formation and passage of Hurricane Hanna. Image from NASA GSFC using IMERG data archived at https://giovanni.gsfc.nasa.gov/giovanni/. This image was produced with the Giovanni Image: Steve Lang (NASA GSFC)online data system, developed and maintained by the NASA GES DISC.

Hanna formed from a westward propagating tropical easterly wave that entered the southeast corner of the Gulf of Mexico on Tuesday July 21st.  The wave provided a focus for shower and thunderstorm activity, which then led to the formation of an area of low pressure over the central Gulf of Mexico.  The National Hurricane Center (NHC) found that this low had developed a closed circulation by the evening of Wednesday July 22nd, making it Tropical Depression #8.  Over the next 24 hours, the depression slowly organized and intensified over the central Gulf before reaching tropical storm intensity on the evening of the 23rd, becoming Tropical Storm Hanna, the earliest 8th named storm of the Atlantic season on record.  A subtropical ridge to the north kept Hanna moving in a mainly westward direction towards the south Texas coastline.  On Friday the 24th, Hanna continued to show signs of intensifying but remained at tropical storm intensity.  On the morning of Saturday, the 25th, NHC found that Hanna had reached hurricane intensity, the first of the season.  At this point, the storm was centered about 100 miles ESE of Corpus Christi, TX and still moving west.  Hanna was still in the process of strengthening when it made landfall later that day around 5 pm (CDT) over Padre Island as a strong category 1 storm with sustained winds reported at 90 mph by NHC.

IMERG surface rainfall accumulations are shown here for the period 22 to 26 July 2020 for the central and northern Gulf of Mexico and the adjacent coastal regions.  The heaviest rainfall totals, in excess of 225 mm (~9 inches, shown in dark red) are located offshore over the northwestern Gulf of Mexico.   Over land, the highest rainfall amounts occur along the southern coast and southern tip of Texas where between 100 mm (~4 inches, shown in yellow) to as much as 200 mm (~8 inches, shown red) of rain are estimated to have fallen.  In addition to the heavy rain over south Texas, Hanna’s onshore flow brought coastal flooding to many parts of the south Texas coast, while Hanna’s outer rainbands also brought localized areas of heavy rain to portions of the northern Gulf Coast.


This animation shows IMERG rain rates (blue/yellow shading) and accumulations (green shading) observed from July 22-26, 2020 along Hurricane Hanna’s track as it crossed the Gulf of Mexico and reached southern Texas and northeastern Mexico. The National Hurricane Center began tracking the tropical depression that would become Hanna on July 23, shown here as a red line, smoothed in time. Hanna continued to strengthen into a Category 1 hurricane with a clearly visible eye on July 25 when it made landfall in southern Texas at 22:00 UTC. During Hanna’s approach, IMERG observed rain rates in excess of 25 millimeters/hour (~1 inch/hour; yellow shading). Accumulations during Hanna’s passage exceeded 20 centimeters (~8 inches; dark green shading) in parts of southern Texas and northeastern Mexico. Credit: Animation and caption by Jason West (NASA GSFC)


Hanna (was TD08) – Gulf of Mexico

July 26, 2020 – NASA Infrared Data Shows Hanna a Heavy Rainmaker

Infrared imagery of Tropical Storm Hanna obtained from NASA’s Aqua satellite found powerful storms with heavy rainmaking capabilities along the Texas coast.

On July 26, NOAA’s National Hurricane Center (NHC) posted a Tropical Storm Warning from Barra el Mezquital, Mexico to Baffin Bay, Texas.

Aqua image of Hanna
On July 27 at 4:35 a.m. EDT (0835 UTC) the MODIS instrument that flies aboard NASA’s Aqua satellite revealed the most powerful thunderstorms (yellow) were east of Hanna’s center where cloud top temperatures were as cold as minus 80 degrees Fahrenheit (minus 62.2 Celsius). Those storms were over the Gulf of Mexico at the time of the image. Credit: NASA/NRL

NASA’s Infrared Data Reveals Heavy Rainmakers

Tropical cyclones are made of up hundreds of thunderstorms, and infrared data can show where the strongest storms are located. That is because infrared data provides temperature information, and the strongest thunderstorms that reach highest into the atmosphere have the coldest cloud top temperatures.

On July 27 at 4:35 a.m. EDT (0835 UTC), the Moderate Resolution Imaging Spectroradiometer or MODIS instrument that flies aboard NASA’s Aqua satellite used infrared light to analyze the strength of storms within Hanna. MODIS found the most powerful thunderstorms were east of Hanna’s center and over the Gulf of Mexico, where cloud top temperatures were as cold as minus 80 degrees Fahrenheit (minus 62.2 Celsius). NASA research has found that cloud top temperatures that cold indicate strong storms with the potential to generate heavy rainfall.

Strong storms with cloud top temperatures as cold as minus 70 degrees Fahrenheit (minus 56.6. degrees Celsius) were over land, and were dropping large amounts of rain.

NHC Forecast for Heavy Rain and a Key Message

On July 26, NOAA’s National Hurricane Center (NHC) posted a Tropical Storm Warning from Barra el Mezquital, Mexico to Baffin Bay, Texas.

Forecasters at NOAA’s National Hurricane Center (NHC) use NASA’s infrared data in their forecast. One of the Key messages on Hanna is about its rainfall potential. NHC noted that, “Hanna is expected to produce total rain accumulations of 6 to 12 inches, with isolated maximum amounts of 18 inches through Monday in south Texas and into the Mexican states of Coahuila, Nuevo Leon, and northern Tamaulipas.  This rain will produce life-threatening flash flooding, rapid rises on small streams, and isolated minor to moderate river flooding. Hanna is also expected to produce 2 to 4 inches of rain along the upper Texas and Louisiana coasts.”

Other NHC Key Messages

NHC’s other key messages on Hanna include storm surge, winds, and isolated tornadoes. Water levels along the Texas coast will gradually subside through this morning. Tropical storm conditions will continue near the center of Hanna for the next several hours and along the Texas and northeastern Mexican coast in the warning area for a few more hours. Swells generated by Hanna will continue to affect much of the Texas and Louisiana coasts for another day or so. These swells are likely to cause life-threatening surf and rip current conditions.  A few tornadoes are possible today into this evening across parts of south Texas.

Hanna’s Status on July 26, 2020

At 8 a.m. EDT (1200 UTC), the center of Tropical Storm Hanna was located near latitude 26.2 north, longitude 99.1 west. Hanna is moving toward the west-southwest near 9 mph (15 kph) and this motion is expected to continue through Monday. Maximum sustained winds are near 50 mph (85 kph) with higher gusts. The estimated minimum central pressure is 992 millibars.

Tropical-storm-force winds extend outward up to 115 miles (185 km) mainly over water to the east of the center. A wind gust of 49 mph (80 kph) was reported within the past couple of hours at Port Isabel-Cameron County Airport.

Hanna’s Forecast from NHC

Rapid weakening is expected as the center of Hanna moves farther inland, and the cyclone is expected to weaken to a tropical depression later today and dissipate Monday or Monday night. On the forecast track, the center of Hanna should continue to move farther inland over northeastern Mexico through tonight.

Typhoons/hurricanes are the most powerful weather events on Earth. NASA researches these storms to determine how they rapidly intensify, develop and behave. NASA’s expertise in space and scientific exploration contributes to essential services provided to the American people by other federal agencies, such as hurricane weather forecasting.

By Rob Gutro
NASA’s Goddard Space Flight Center


July 26, 2020 – International Space Station View of Hanna
On July 26, 2020, International Space Station astronaut Bob Behnken snapped this photo of Hurricane Hanna as it was moving through the the Gulf of Mexico to a landfall in Texas. Credit: NASA/ISS/Bob Behnken

Hanna (was TD08) – Gulf of Mexico

July 25, 2020 – NASA Sees Hanna Strengthen into First Atlantic Hurricane of 2020

NASA satellite imagery revealed powerful thunderstorms fueled the intensification of Hanna into a hurricane along the Texas coast. Hanna has become the first hurricane of the Atlantic Ocean hurricane season, and has triggered warnings along the Texas coast today, July 25, 2020.

Aqua image of Hanna
On July 25 at 3:50 a.m. EDT (0750 UTC) the MODIS instrument that flies aboard NASA’s Aqua satellite revealed very powerful thunderstorms (yellow) around Hanna’s center where cloud top temperatures were as cold as minus 80 degrees Fahrenheit (minus 62.2 Celsius), indicating the storm had strengthened.
Credits: NASA/NRL

Warnings in Effect

The National Hurricane Center posted warnings on July 25 for areas of the Texas coast as Hanna approaches for landfall. A Storm Surge Warning is in effect from Port Mansfield to Sargent, Texas. A Hurricane Warning is in effect from Port Mansfield to Mesquite Bay, Texas.

A Tropical Storm Warning is in effect from Barra el Mezquita, Mexico to Port Mansfield, Texas and for Mesquite Bay to High Island, Texas.

NASA Infrared Data Shows Hanna Strengthened

On July 25 at 3:50 a.m. EDT (0750 UTC), the Moderate Resolution Imaging Spectroradiometer or MODIS instrument that flies aboard NASA’s Aqua satellite used infrared light to analyze the strength of storms within Hanna. MODIS revealed that cloud tops in very powerful thunderstorms around Hanna’s center had become colder since the previous day. That means the uplift in the storm was stronger and pushed the cloud tops higher into the troposphere. Cloud top temperatures in those areas were as cold as minus 80 degrees Fahrenheit (minus 62.2 Celsius), indicating the storm had strengthened. NASA research has found that cloud top temperatures that cold indicate strong storms with the potential to generate heavy rainfall.

Tropical cyclones are made of up hundreds of thunderstorms, and infrared data can show where the strongest storms are located. That is because infrared data provides temperature information, and the strongest thunderstorms that reach highest into the atmosphere have the coldest cloud top temperatures.  NASA researches these storms to determine how they rapidly intensify, develop and behave.

Heavy Rainfall, Storm Surge, Hurricane-force Winds, Isolated Tornadoes

The National Hurricane Center forecast warns about storm surge up to 5 feet in various areas, hurricane conditions, isolated tornadoes, heavy rainfall, flooding, and dangerous ocean swells from Texas to Louisiana.

Infrared imagery from NASA shows the capability of Hurricane Hanna to generate heavy rainfall, and the National Hurricane Center has included that rainfall potential in their forecast. NHC said, “Hanna is expected to produce 6 to 12 inches of rain with isolated maximum totals of 18 inches through Sunday night in south Texas and into the Mexican states of Coahuila, Nuevo Leon, and northern Tamaulipas.  This rain may result in life-threatening flash flooding, rapid rises on small streams, and isolated minor to moderate river flooding in south Texas.”

Hanna’s Status on Saturday, July 25

At 8 a.m. EDT (1200 UTC), the center of Hurricane Hanna was located by reconnaissance aircraft and NOAA Doppler weather radars near latitude 27.1 degrees north and longitude 96.0 degrees west. Hanna is just 90 miles (150 km) east-northeast of Port Mansfield, Texas. Hanna is moving toward the west near 9 mph (15 km), and this motion should continue through this morning.  A gradual turn toward the west-southwest is expected by tonight and that motion should continue through Sunday.

Data from the reconnaissance aircraft and Doppler weather radars indicate that maximum sustained winds have increased to near 75 mph (120 kph) with higher gusts.  Data from the NOAA Hurricane Hunter aircraft indicate that the minimum central pressure is 982 millibars.

Additional strengthening is forecast before Hanna makes landfall later today. Rapid weakening is expected after Hanna moves inland. On the forecast track, the center of Hanna should make landfall along the Texas coast within the hurricane warning area this afternoon or early this evening.

Typhoons/hurricanes are the most powerful weather events on Earth. NASA’s expertise in space and scientific exploration contributes to essential services provided to the American people by other federal agencies, such as hurricane weather forecasting.

For updated forecasts, visit: www.nhc.noaa.gov

For previous Hanna updates visit: https://blogs.nasa.gov/hurricanes/tag/td08-2020/

Douglas – Eastern Pacific Ocean

July 26, 2020 – NASA-NOAA’s Suomi NPP Provides Night-Time Analysis of Hurricane Douglas

NASA-NOAA’s Suomi NPP satellite provided forecasters with various nighttime views of Hurricane Douglas as it approaches Hawaii. The various imagery provided valuable data on the storm’s structure and strength.

Infrared image of Douglas
On July 25 at 7:36 a.m. EDT (1:36 a.m. HST/1136 UTC), this infrared image of Hurricane Douglas taken from NASA-NOAA’s Suomi NPP satellite showed a closed circulation and a relatively compact storm. Some warmer air was also being pulled into the storm. Satellite data also showed an exposed circulation on the southeast side. Credit: NASA/NOAA/UWM-CIMSS, William Straka III

On July 26, NOAA’s Central Pacific Hurricane Center or CPHC warned that “Dangerous Hurricane Douglas is closing in on the Hawaiian Islands.”

Many Warnings in Place for Hawaii

On Sunday, July 26, 2020 warnings and watches pepper Hawaii as Hurricane Douglas approaches. A Hurricane Warning is in effect for Oahu, Kauai County, including the islands of Kauai and Niihau. A Tropical Storm Warning is in effect for Hawaii County, Maui County, including the islands of Maui, Lanai, Molokai and Kahoolawe. In addition, a Hurricane Watch is in effect for Hawaii County, Maui County, including the islands of Maui, Lanai, Molokai and Kahoolawe. A Tropical Storm Watch is in effect for portions of the Papahanaumokuakea Marine National Monument from Nihoa to French Frigate Shoals.

What NASA-NOAA’s Suomi NPP Satellite Showed

On July 25 at 5 a.m. EDT (0900 UTC) Hurricane Douglas was a strong Category 2 storm with winds near 110 mph. NOAA’s CPHC mentioned that Douglas had a degraded satellite presentation. Two and one half hours later, NASA-NOAA’s Suomi NPP satellite passed over Douglas and provided a nighttime view of the storm as well as an infrared view.

In the nighttime view, the waxing crescent moon (27% illumination) was still low enough with the features in the Suomi NPP Day Night Band were illuminated by airglow. “There continued to be no mesospheric waves, which is not surprising given the gradual degradation of the storm,” said William Straka III, Researcher at the University of Wisconsin – Madison, Space Science and Engineering Center (SSEC), Cooperative Institute for Meteorological Satellite Studies (CIMSS). Straka provided the nighttime and infrared images.

Nighttime view of Douglas
The nighttime view of Hurricane Douglas is seen from NASA-NOAA’s Suomi NPP on July 25 at 7:36 a.m. EDT (1:36 a.m. HST/1136 UTC). There continued to be no mesospheric waves, which is not surprising given the gradual degradation of the storm. Credit: NASA/NOAA/UWM-CIMSS, William Straka III

The high-resolution infrared imagery from Suomi NPPs Visible Infrared Imaging Radiometer Suite (VIIRS) instrument showed a closed circulation and a relatively compact storm. The VIIRS instrument cloud top temperatures around the eye were as cold as 210 Kelvin (minus 81.6 degrees Fahrenheit (minus 63.1 Celsius), indicating powerful storms.

Straka noted, “Satellite imagery also seemed to indicate some warmer air being pulled in to the storm. This was supported by the Advanced Microwave Scanning Radiometer 2 (AMSR2) instrument (that also flies aboard Suomi NPP) data taken roughly 20 minutes earlier, which also seemed to show an exposed circulation on the southeast side.”

Satellite Imagery on July 26, 2020

CPHC Hurricane forecaster Thomas Birchard said in the July 26 discussion, “Worth noting is that the data also indicate that the low-level center is south of the center that is seen in conventional satellite imagery. Recent microwave images confirm that the cyclone is tilted to the north with height, due to southerly vertical wind shear. Despite the vertical wind shear, Douglas is expected to only slowly weaken as it comes dangerously close to the Hawaiian Islands.”

Hurricane Douglas’ Status on Sunday, July 26, 2020

NOAA’s CPHC noted at 8 a.m. EDT (2 a.m. HST/1200 UTC) on July 26, the center of Hurricane Douglas was located by Hurricane Hunter aircraft near latitude 20.5 north, longitude 153.6 west. That puts Douglas’ center about 190 miles (300 km) east of Kahului, Hawaii and 285 miles (460 km) east of Honolulu, Hawaii.

Douglas is moving toward the west-northwest near 16 mph (26 kph), and this general motion is expected to continue for the next couple of days. The estimated minimum central pressure is 983 millibars. Maximum sustained winds are near 90 mph (150 kph) with higher gusts.

 Forecast for Douglas

NOAA’s CPHC forecast calls for “Some slow weakening is forecast during the next 48 hours, but Douglas is expected to remain near hurricane intensity as it passes near, or over, the islands. On the forecast track, Hurricane Douglas will pass dangerously close to the main Hawaiian Islands later today.”

For more than five decades, NASA has used the vantage point of space to understand and explore our home planet, improve lives and safeguard our future. NASA brings together technology, science, and unique global Earth observations to provide societal benefits and strengthen our nation. Advancing knowledge of our home planet contributes directly to America’s leadership in space and scientific exploration.

For updated forecasts, visit: www.nhc.noaa.gov

By Rob Gutro
NASA’s Goddard Space Flight Center