Genevieve – Eastern Pacific Ocean

Aug. 17, 2020 – NASA Infrared Data Shows Genevieve Strengthening into a Hurricane

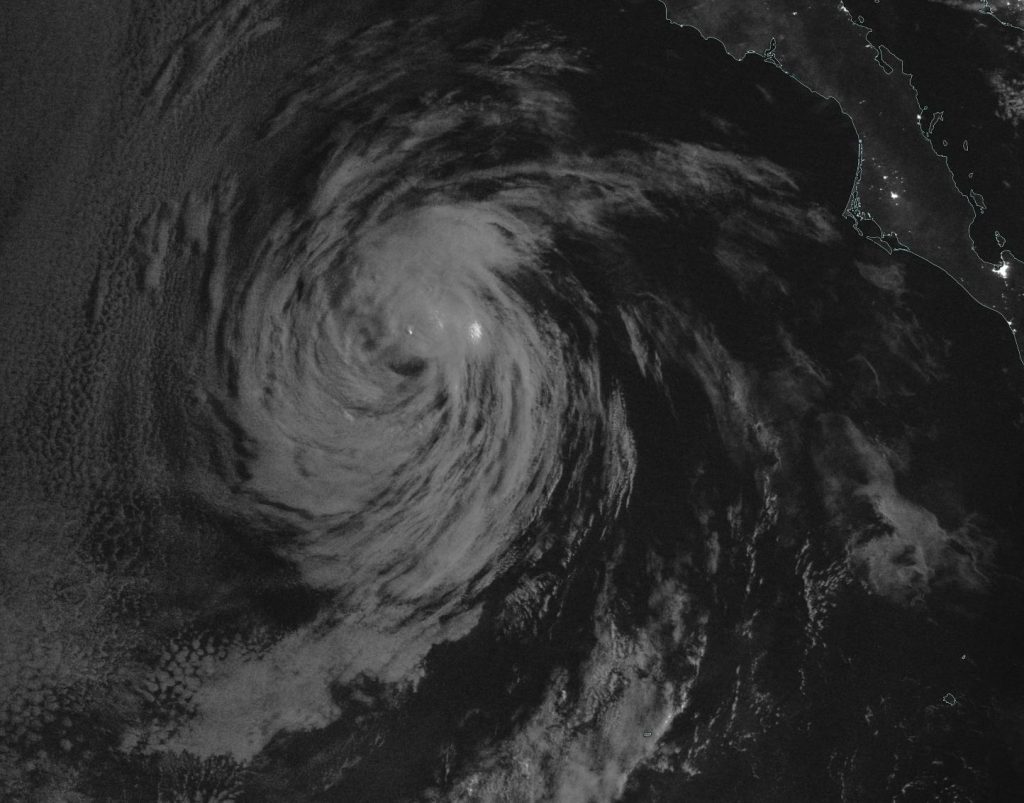
NASA’s Terra satellite used infrared light to identify strongest storms and coldest cloud top temperatures and found them surrounding a developing eyewall around Genevieve as it was strengthening into a hurricane.

Aqua image of Genevieve
On Aug. 17 at 1:15 a.m. EDT (0515 UTC), the MODIS instrument aboard NASA’s Terra satellite gathered temperature information about Genevieve’s cloud tops. MODIS found the most powerful thunderstorms (red) were in the developing eyewall, where temperatures were as cold as or colder than minus 70 degrees Fahrenheit (minus 56.6 Celsius). Credit: NASA/NRL

Genevieve formed on Sunday by 11 a.m. EDT (1500 UTC) as Tropical Depression 12E. Six hours later, by 5 p.m. EDT, it had strengthened into a tropical storm and was renamed Tropical Storm Genevieve. The storm continued to intensify rapidly and by 11 a.m. EDT on Monday, Aug. 17, it strengthened to a hurricane.

Infrared Data Reveals Powerful Storms

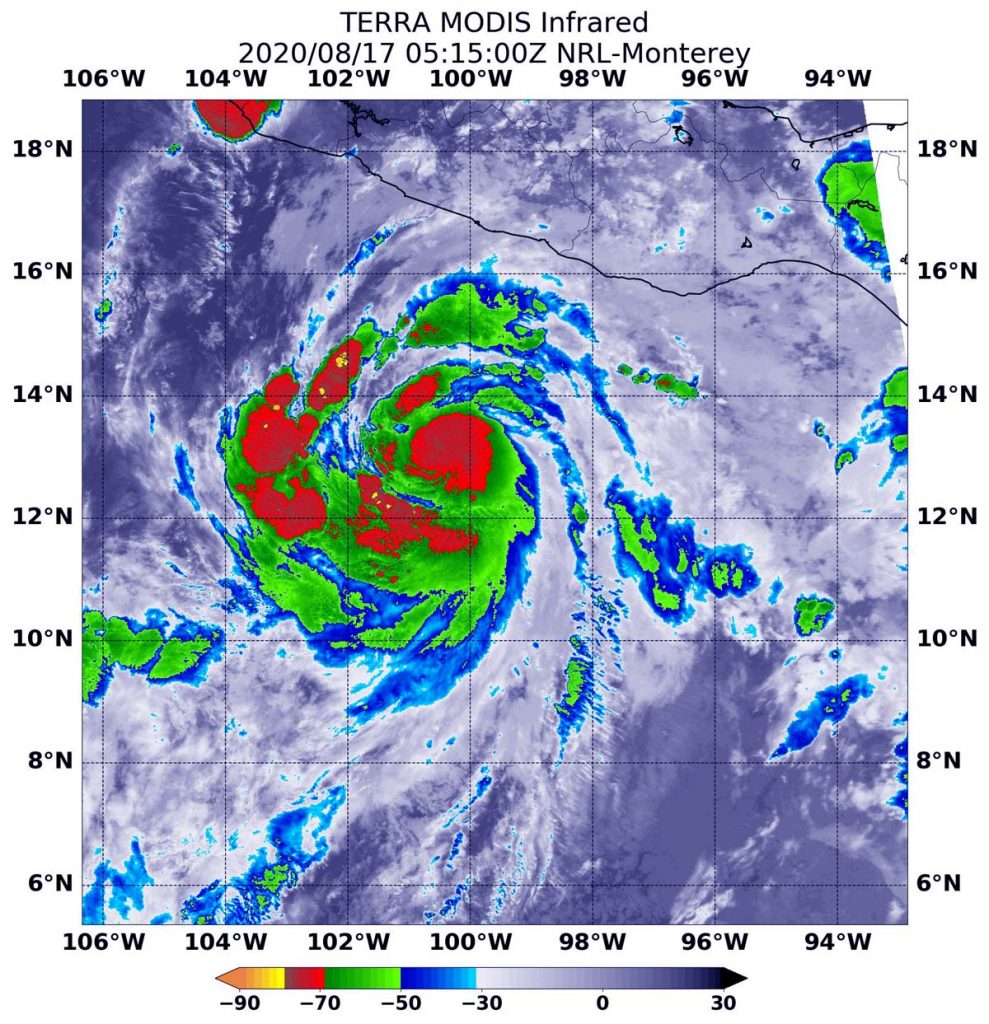
On Aug. 17 at 1:15 a.m. EDT (0515 UTC), the Moderate Resolution Imaging Spectroradiometer or MODIS instrument aboard NASA’s Terra satellite gathered temperature information about Genevieve’s cloud tops. Infrared data provides temperature information, and the strongest thunderstorms that reach high into the atmosphere have the coldest cloud top temperatures.

MODIS found the most powerful thunderstorms were in the eyewall, where temperatures were as cold as or colder than minus 70 degrees Fahrenheit (minus 56.6 Celsius) around the center of circulation and in thick, fragmented bands south and west of the center. Cloud top temperatures that cold indicate strong storms with the potential to generate heavy rainfall.

Genevieve’s Status  

At 11 a.m. EDT (1500 UTC) on Aug. 17, NOAA’s National Hurricane Center reported the center of Hurricane Genevieve was located near latitude 14.3 degrees north and longitude 103.0 degrees west. The storm was about 250 miles (405 km) south-southwest of Zihuatanejo, Mexico.

Genevieve is moving toward the west-northwest near 18 mph (30 kph), and this motion is expected to continue through tonight. Maximum sustained winds are near 75 mph (120 kph) with higher gusts.

Forecast Track

NHC forecasters said, “A turn to the northwest and a decrease in forward speed is forecast to occur on Tuesday and continue through at least early Thursday. Rapid strengthening if forecast to continue over the next day or so, and Genevieve is expected to become a major hurricane on Tuesday. A weakening trend should begin on Wednesday. On the forecast track, the center of Genevieve is expected to move parallel to but well offshore the coast of southwestern Mexico during the next couple of days.”

Genevieve Causing Dangerous Ocean Swells Near Mexico

Large swells produced by Genevieve will begin affecting portions of the southern coast of Mexico today and will spread northward along the southwestern and west-central coast of Mexico to the Baja California peninsula through Wednesday.  These swells are likely to cause life-threatening surf and rip current conditions.

NASA Researches Tropical Cyclones

Tropical cyclones/hurricanes are the most powerful weather events on Earth. NASA’s expertise in space and scientific exploration contributes to essential services provided to the American people by other federal agencies, such as hurricane weather forecasting.

For updated forecasts, visit: www.nhc.noaa.gov

By Rob Gutro
NASA’s Goddard Space Flight Center

Josephine – Atlantic Ocean

Aug. 17, 2020 – NASA Sees Former Tropical Storm Josephine Open into a Trough

Tropical Storm Josephine weakened on Aug. 16 in the North Atlantic Ocean and satellite imagery showed the storm had become elongated and stretched out into a trough of low pressure a couple of hundred miles north of Puerto Rico.

Terra image of Josephine
NASA’s Terra satellite provided a visible image to forecasters of Josephine on Aug. 16 at 1:30 p.m. EDT that showed the storm had weakened to a trough of low pressure. Image Courtesy: NASA Worldview, Earth Observing System Data and Information System (EOSDIS).

Early on Sunday, Aug. 16, the Moderate Resolution Imaging Spectroradiometer or MODIS instrument aboard NASA’s Aqua satellite provided infrared temperatures of the storm’s cloud tops and revealed the storm had become more disorganized over the last day. Coldest cloud top temperatures were near minus 70 degrees Fahrenheit and were displaced from the center. At the time, the National Hurricane Center said, “Josephine’s low-level center has raced out over 100 nautical miles to the west of a remnant area of deep convection, which itself is shrinking and becoming more disorganized.”

Later in the day, at 1:30 p.m. EDT, the MODIS instrument aboard NASA’s Terra satellite provided a visible image of Josephine as it was degenerating into a trough (elongated area) of low pressure about 175 miles (280 km) north of San Juan, Puerto Rico. The MODIS image showed a low-level swirl that became less defined later in the day. Wind data on the afternoon of Aug. 16 indicated Josephine had degenerated into a trough of low pressure.

Josephine’s Final Advisory

The NHC posted its final advisory on Josephine on Sunday, Aug. 16 at 5 p.m. EDT (2100 UTC). At that time, the remnants of Josephine were located near latitude 20.9 degrees north and longitude 65.8 degrees west. The remnants were moving toward the west-northwest near 12 mph (19 kph), and is expected to turn toward the northwest.

Maximum sustained winds are near 35 mph (55 kph) with higher gusts. The maximum winds associated with the remnants are forecast to continue to decrease over the next day or two. The remnants are forecast to recurve toward the north and northeast Tuesday and Tuesday night.

About NASA’s Worldview and Terra Satellite

NASA’s Earth Observing System Data and Information System (EOSDIS) Worldview application provides the capability to interactively browse over 700 global, full-resolution satellite imagery layers and then download the underlying data. Many of the available imagery layers are updated within three hours of observation, essentially showing the entire Earth as it looks “right now.” One of the satellites providing data is NASA’s Terra Satellite. Terra is one in a fleet of NASA satellites that provide data for hurricane research.

Tropical cyclones/hurricanes are the most powerful weather events on Earth. NASA’s expertise in space and scientific exploration contributes to essential services provided to the American people by other federal agencies, such as hurricane weather forecasting.

For updated forecasts, visit: www.nhc.noaa.gov

By Rob Gutro
NASA’s Goddard Space Flight Center

Kyle – Atlantic Ocean

Aug. 17, 2020 – NASA Satellite Catches the End of Post-tropical Storm Kyle

NASA’s Terra satellite provided a visible image of the end of Post-tropical Storm Kyle in the North Atlantic Ocean on Aug. 16.

Terra image of Kyle
NASA’s Terra satellite provided a visible image of an elongated, weakening Post-tropical Storm Kyle as it continued moving away from New England on Sunday, Aug.16, 2020. Image: NASA Worldview

Kyle was a tropical storm for only one day, when it formed a couple of hundred miles off the coast of Rhode Island on Aug. 15. The next day, Aug. 16, Kyle had become a post-tropical storm.

NHC defines a post-tropical cyclone as a former tropical cyclone. This generic term describes a cyclone that no longer possesses sufficient tropical characteristics to be considered a tropical cyclone. Post-tropical cyclones can continue carrying heavy rains and high winds. Two classes of post-tropical cyclones include extratropical and remnant low pressure areas.

On Sunday, Aug. 16, at 5 a.m. EDT (0900 UTC), the National Hurricane Center issued the final advisory on Kyle. The center of Post-Tropical Cyclone Kyle was located near latitude 40.0 degrees north and longitude 58.9 degrees west. The post-tropical cyclone was moving toward the east near 20 mph (31 kph). The estimated minimum central pressure is 1003 millibars. Maximum sustained winds had decreased to near 40 mph (65 kph) with higher gusts.

The Moderate Resolution Imaging Spectroradiometer or MODIS instrument that flies aboard NASA’s Terra satellite captured a visible image of Kyle at 2:30 p.m. EDT on Aug. 16 and the storm’s circulation had become very elongated. The center had become ill defined.

Model analyses and satellite imagery suggested on Aug. 16 that the low-pressure area became attached to a prominent warm/stationary front to its east and a weaker trailing cold front to its southwest. As a result, Kyle had become an extratropical low-pressure area.

By Monday morning, Aug. 17, Kyle had dissipated.

By Rob Gutro
NASA’s Goddard Space Flight Center

Kyle – Atlantic Ocean

Under the Cover of Night NASA Finds Tropical Storm Kyle Develop, Strengthen

NASA satellites keep a watchful eye over the Earth day and night to help scientists and forecasters. NASA-NOAA’s Suomi NPP satellite provided a night-time image of the development of Tropical Storm Kyle off the coast of New England.

Suomi NPP image of Kyle
NASA-NOAA’s Suomi NPP satellite captured the development and strengthening of Tropical Storm Kyle on Aug. 15 at night, southeast of the Rhode Island coast. Courtesy: NASA Worldview, Earth Observing System Data and Information System (EOSDIS).

Kyle is the eleventh tropical storm of the Atlantic Ocean hurricane Season. Kyle formed around 5 p.m. EDT on Aug. 14 about 185 miles (300 km) southeast of Atlantic City, New Jersey. Kyle moved to the north-northeast and strengthened under the cover of night.

NASA Imagery at Night

Infrared instruments enable satellites to gather imagery on storms at night because they read temperature. At NASA’s Goddard Space Flight Center in Greenbelt, Md. an infrared image of Tropical Storm Kyle was captured by the VIIRS instrument aboard NASA-NOAA’s Suomi NPP satellite. The storm formed despite being battered by westerly wind shear, that is winds outside the storm blowing from the west and pushing the bulk of clouds to the east of the center.

NOAA’s National Hurricane Center (NHC) noted, “The low-level center of Kyle continues to be exposed to the west of the deep convection, as strong westerly shear prevails. Although the satellite appearance is not that impressive, the circulation is well intact as indicated by a recent ASCAT overpass that reveals that the initial intensity remains 40 knots (45 mph).”

The image was created using NASA’s Worldview application. NASA’s Earth Observing System Data and Information System (EOSDIS) Worldview application provides the capability to interactively browse over 700 global, full-resolution satellite imagery layers and then download the underlying data. Many of the available imagery layers are updated within three hours of observation, essentially showing the entire Earth as it looks “right now.”

Tropical Storm Kyle on Saturday, August 15, 2020

The National Hurricane Center (NHC) noted at 5 a.m. EDT (0900 UTC), the center of Tropical Storm Kyle was located near latitude 38.7 degrees north and longitude 68.0 degrees west. That’s about 280 miles (450 km) southeast of Providence, Rhode Island.

Kyle is moving toward the east-northeast near 21 mph (33 kph), and this general motion is expected to continue for the next couple of days. A turn to the east along with an increase in forward speed is expected early next week. The estimated minimum central pressure is 1002 millibars.  Maximum sustained winds are near 45 mph (75 kph) with higher gusts. Some additional strengthening is possible during the next day or so.

Kyle is forecast to become post-tropical on Sunday.

NASA Researches Tropical Cyclones

Hurricanes/tropical cyclones are the most powerful weather events on Earth. NASA’s expertise in space and scientific exploration contributes to essential services provided to the American people by other federal agencies, such as hurricane weather forecasting.

For more than five decades, NASA has used the vantage point of space to understand and explore our home planet, improve lives and safeguard our future. NASA brings together technology, science, and unique global Earth observations to provide societal benefits and strengthen our nation. Advancing knowledge of our home planet contributes directly to America’s leadership in space and scientific exploration.

For updated forecasts, visit: www.nhc.noaa.gov

By Rob Gutro
NASA’s Goddard Space Flight Center

Josephine – Atlantic Ocean

Aug. 14, 2020 – NASA Finds Wind Shear Affecting Tropical Storm Josephine

NASA-NOAA’s Suomi NPP satellite provided forecasters with a visible image of Tropical Storm Josephine east of the Lesser Antilles island chain. Suomi NPP revealed that Josephine was being affected by wind shear.

Suomi NPP Image of Josephine
NASA-NOAA’s Suomi NPP satellite provided forecasters with a visible image of Tropical Storm Josephine in the Atlantic Ocean. The imagery shows a slightly elongated storm east of the Lesser Antilles island chain. Credit: NASA Worldview, Earth Observing System Data and Information System (EOSDIS)

The Lesser Antilles is a group of islands that form the boundary of the western Atlantic Ocean and the Caribbean Sea (to the west). They are a long, partly volcanic island arc stretching between the Greater Antilles to the north-west and South America.

On Aug. 13, the Visible Infrared Imaging Radiometer Suite (VIIRS) instrument aboard Suomi NPP revealed southwesterly wind shear was pushing the bulk of clouds and precipitation to the northeast of the center, giving the storm an elongated appearance.

Vertical wind shear, that is, winds outside of a tropical cyclone at different heights in the atmosphere (the troposphere), pushes against a tropical cyclone and tears it apart.

On Aug. 14, National Hurricane Center hurricane forecaster Jack Beven noted that wind shear was continuing. Beven said, “Morning visible satellite imagery indicates that the center of Josephine is located to the south or southwest of the strongest area of convection, likely due to the onset of southwesterly vertical wind shear.”

Tropical Storm Josephine on Aug. 14

At 11 a.m. EDT (1500 UTC) on Aug. 14, the center of Tropical Storm Josephine was located near latitude 16.1 degrees north and longitude 54.7 degrees west. The storm was centered 575 miles (920 km) east-southeast of the southern Leeward Islands.

Josephine is moving toward the west-northwest near 16 mph (26 kph), and this general motion is expected to continue for the next couple of days. The estimated minimum central pressure was 1006 millibars. Maximum sustained winds were near 40 mph (65 km/h) with higher gusts. Some strengthening is possible during the next 24 hours. After that time, Josephine is expected to encounter upper-level winds that will not be conducive for strengthening.

Josephine is expected to turn toward the northwest late this weekend or early next week. On the forecast track, the center of Josephine is expected to pass to the northeast of the Leeward Islands over the weekend.

 NASA Researches Tropical Cyclones

Hurricanes/tropical cyclones are the most powerful weather events on Earth. NASA’s expertise in space and scientific exploration contributes to essential services provided to the American people by other federal agencies, such as hurricane weather forecasting.

For more than five decades, NASA has used the vantage point of space to understand and explore our home planet, improve lives and safeguard our future. NASA brings together technology, science, and unique global Earth observations to provide societal benefits and strengthen our nation. Advancing knowledge of our home planet contributes directly to America’s leadership in space and scientific exploration.

For updated forecasts. visit: www.nhc.noaa.gov

By Rob Gutro 
NASA’s Goddard Space Flight Center

10E – Eastern Pacific Ocean – 2020

Aug. 14, 2020 – NASA Finds Wind Shear Making Tropical Depression 10E Struggle

NASA-NOAA’s Suomi NPP satellite provided forecasters with a visible image of a struggling Tropical Depression 10E in the Eastern Pacific Ocean. Wind shear is preventing the storm from intensifying into a tropical storm.

Suomi NPP image of TD10
NASA-NOAA’s Suomi NPP satellite provided forecasters with a visible image of Tropical Depression 10E in the Eastern Pacific Ocean. The imagery showed northeasterly wind shear had exposed the center of circulation and pushed the bulk of clouds and precipitation to the southwest of the center. Credit: NASA Worldview, Earth Observing System Data and Information System (EOSDIS)

On Aug. 13, the Visible Infrared Imaging Radiometer Suite (VIIRS) instrument aboard Suomi NPP revealed northeasterly wind shear had exposed the center of circulation and pushed the bulk of clouds and precipitation to the southwest of the center. The depression has maintained a small ragged band of convection in its southwest quadrant.

Vertical wind shear, that is, winds outside of a tropical cyclone at different heights in the atmosphere (the troposphere), pushes against a tropical cyclone and tears it apart.

National Hurricane Center forecaster David Zelinsky noted, “Strong northeasterly shear should continue to limit the development potential of the cyclone, but upper-level winds could become less hostile in a few days.”

Tropical Depression 10E on Aug. 14

At 11 a.m. EDT (1500 UTC) on Aug. 14, the center of Tropical Depression 10E was located near latitude 13.6 degrees north and longitude 131.9 degrees west. 10E is centered about 1,575 miles (2,535 km) west-southwest of the southern tip of Baja California, Mexico.

The depression is moving toward the west-southwest near 6 mph (9 kph). A slow drift toward the west-southwest is expected today, followed by a turn toward the northwest over the weekend. The estimated minimum central pressure is 1004 millibars. Maximum sustained winds are near 35 mph (55 kph) with higher gusts. Little change in strength is forecast during the next few days.

NASA Researches Tropical Cyclones

Hurricanes/tropical cyclones are the most powerful weather events on Earth. NASA’s expertise in space and scientific exploration contributes to essential services provided to the American people by other federal agencies, such as hurricane weather forecasting.

For more than five decades, NASA has used the vantage point of space to understand and explore our home planet, improve lives and safeguard our future. NASA brings together technology, science, and unique global Earth observations to provide societal benefits and strengthen our nation. Advancing knowledge of our home planet contributes directly to America’s leadership in space and scientific exploration.

For updated forecasts. visit: www.nhc.noaa.gov

By Rob Gutro 
NASA’s Goddard Space Flight Center

Josephine – Atlantic Ocean

Aug. 13, 2020 – NASA-NOAA Satellite Nighttime Imagery Reveals Development of Tropical Storm Josephine

The tenth named tropical cyclone of the Atlantic Ocean hurricane season was named today, Aug. 13, after NASA-NOAA’s Suomi NPP satellite provided a nighttime image of the storm.

Suomi NPP image of Josephine
NASA-NOAA’s Suomi NPP satellite passed the North Atlantic Ocean during the early morning hours of Aug. 13 and captured a nighttime image of developing Tropical Storm Josephine. Credit: NASA Worldview, Earth Observing System Data and Information System (EOSDIS)

Tropical Storm Josephine developed from Tropical Depression 11. Over the last two days, Tropical Depression 11 has been moving through the Central Atlantic Ocean and was slow to organize. Satellite imagery indicated the depression became more organized and reached tropical storm strength on Aug. 13.

Another Record-Breaker for the Season

Josephine is the earliest tenth tropical storm of record in the Atlantic, with the next earliest tenth storm being Tropical Storm Jose on August 22, 2005.

NASA’s Night-Time View  

The Visible Infrared Imaging Radiometer Suite (VIIRS) instrument aboard Suomi NPP provided a nighttime image of Josephine on Aug. 13 at 2 a.m. EDT (0500 UTC). The imagery showed that Josephine had strong thunderstorms surrounding its center of circulation and fragmented thunderstorms wrapping into the low-level center from the northern quadrant. The image was created using the NASA Worldview application.

The National Hurricane Center (NHC) noted, “Satellite imagery shows that the convective pattern associated with Josephine has become a little better organized since the last advisory (at 5 a.m. EDT), with a ragged central convective feature and a weak band in the northern semicircle.”

Josephine’s Formation Advisory

At 11 a.m. EDT (1500 UTC) on Aug. 13, NHC announced the formation of Tropical Storm Josephine. At that time, the center was located near latitude 13.7 degrees north and longitude 49.2 degrees west. Josephine was located about 975 miles (1,565 km) east-southeast of the Northern Leeward Islands.

Josephine was moving toward the west-northwest near 15 mph (24 kph), and this general motion is expected to continue for the next few days followed by a turn toward the northwest late this weekend or early next week. The estimated minimum central pressure is 1005 millibars.

Recent satellite wind data indicate that maximum sustained winds have increased to near 45 mph (75 kph) with higher gusts.  Some additional strengthening is forecast during the next 48 hours.

NHC cautions that interests in the Leeward Islands should monitor the progress of this system.

About NASA’s EOSDIS Worldview

NASA’s Earth Observing System Data and Information System (EOSDIS) Worldview application provides the capability to interactively browse over 700 global, full-resolution satellite imagery layers and then download the underlying data. Many of the available imagery layers are updated within three hours of observation, essentially showing the entire Earth as it looks “right now.”

NASA Researches Earth from Space

For more than five decades, NASA has used the vantage point of space to understand and explore our home planet, improve lives and safeguard our future. NASA brings together technology, science, and unique global Earth observations to provide societal benefits and strengthen our nation. Advancing knowledge of our home planet contributes directly to America’s leadership in space and scientific exploration.

For updated forecasts, visit: www.nhc.noaa.gov

By Rob Gutro 
NASA’s Goddard Space Flight Center

Elida – Eastern Pacific Ocean

Aug. 13, 2020 – NASA-NOAA Satellite Nighttime Imagery Helps Confirm Elida Now Post-Tropical

NASA-NOAA’s Suomi NPP satellite provided a night-time image of Elida in the Eastern Pacific Ocean that helped confirm the storm had weakened to a post-tropical cyclone.

Suomi nPP image of Elida
NASA-NOAA’s Suomi NPP satellite passed the Eastern Pacific Ocean overnight on Aug. 12 at 10 p.m. PDT (Aug. 13 at 0500 UTC) and captured a night-time image of Post-Tropical Cyclone Elida. Credit: NASA Worldview, Earth Observing System Data and Information System (EOSDIS)

What is a Post-tropical Cyclone?

The National Hurricane Center (NHC) defines a post-tropical cyclone as a former tropical cyclone. This generic term describes a cyclone that no longer possesses sufficient tropical characteristics to be considered a tropical cyclone. Post-tropical cyclones can continue carrying heavy rains and high winds. Note that former tropical cyclones that have become fully extratropical… as well as remnant low pressure areas… are two classes of post-tropical cyclones.

NASA’s Night-Time View of Elida’s Transition

The Visible Infrared Imaging Radiometer Suite (VIIRS) instrument aboard Suomi NPP provided a night-time image of Elida on Aug. 12 at 10 p.m. PDT (Aug. 13 at 0500 UTC). The imagery showed that Elida was still devoid of strong thunderstorms. The image was created using the NASA Worldview application.

Two hours earlier, NOAA’s National Hurricane Center (NHC) noted, “Elida has been devoid of deep convection for more than 12 hours, and since it is over sea surface temperatures of 22 to 23 degrees Celsius (71.6 to 73.4 degrees Fahrenheit), it is unlikely that organized deep convection will return.  As a result, the system has become a post-tropical cyclone, and this will be the last NHC advisory on Elida.”

Tropical cyclones require warm sea surface temperatures of at least 26.6 degrees Celsius (80 degrees Fahrenheit) to maintain strength and continue building the thunderstorms that make up a tropical cyclone.

Elida’s Last Advisory

At 11 p.m. EDT on Aug. 12 (0300 UTC on Aug. 13), the National Hurricane Center (NHC) issued the final advisory on Elida. At that time, it was located near latitude 24.4 degrees north and longitude 120.2 degrees west. That is about 395 miles (635 km) southwest of Punta Eugenia, Mexico.

The post-tropical cyclone is moving toward the northwest near 9 mph (15 kph).  A northwestward or north-northwestward motion at a slower forward speed is expected through Thursday. Maximum sustained winds have decreased to near 40 mph (65 kph) with higher gusts. The estimated minimum central pressure is 1004 millibars.

Additional weakening is expected during the next day or so, and the remnant low is forecast to dissipate early Friday.

About NASA’s EOSDIS Worldview

NASA’s Earth Observing System Data and Information System (EOSDIS) Worldview application provides the capability to interactively browse over 700 global, full-resolution satellite imagery layers and then download the underlying data. Many of the available imagery layers are updated within three hours of observation, essentially showing the entire Earth as it looks “right now.”

NASA Researches Earth from Space

For more than five decades, NASA has used the vantage point of space to understand and explore our home planet, improve lives and safeguard our future. NASA brings together technology, science, and unique global Earth observations to provide societal benefits and strengthen our nation. Advancing knowledge of our home planet contributes directly to America’s leadership in space and scientific exploration.

For updated forecasts, visit: www.nhc.noaa.gov

By Rob Gutro 
NASA’s Goddard Space Flight Center

06W – Northwestern Pacific Ocean

Aug. 12, 2020 – NASA-NOAA’s Suomi NPP Satellite Finds a Stubborn Tropical Depression 06W

Tropical Depression 06W has been around for days, and continues to hold together as it moves in a westerly direction toward Taiwan in the Northwestern Pacific Ocean. NASA-NOAA’s Suomi NPP satellite captured a visible image of the storm.

Suomi NPP image of 06W
NASA-NOAA’s Suomi NPP satellite provided forecasters with a visible image of Tropical Depression 06W moving through the Northwestern Pacific Ocean on Aug. 12. Credit: NASA Worldview, Earth Observing System Data and Information System (EOSDIS)

On Aug. 12, the Visible Infrared Imaging Radiometer Suite (VIIRS) instrument aboard Suomi NPP revealed a partially exposed low-level circulation with building thunderstorms over the western quadrant of Tropical Depression 06W. Satellite imagery also showed a weakly defined, broad center. The image was created by NASA Worldview website at NASA’s Goddard Space Flight Center in Greenbelt, Md.

At 11 a.m. EDT (1500 UTC) on Aug. 12, the Joint Typhoon Warning Center (JTWC) noted Tropical Depression 06W (TD06W) was centered near latitude 5.0 degrees north and longitude 133.4 degrees east, approximately 349 nautical miles east-southeast of Kadena Air Base, Okinawa Island, Japan. 06W was moving to the west-southwest. Maximum sustained winds remained near 25 knots (29 mph/46 kph).

TD06W is expected to maintain intensity for another day and a half, when it will then weaken.

NASA Researches Tropical Cyclones

Hurricanes/tropical cyclones are the most powerful weather events on Earth. NASA’s expertise in space and scientific exploration contributes to essential services provided to the American people by other federal agencies, such as hurricane weather forecasting.

For more than five decades, NASA has used the vantage point of space to understand and explore our home planet, improve lives and safeguard our future. NASA brings together technology, science, and unique global Earth observations to provide societal benefits and strengthen our nation. Advancing knowledge of our home planet contributes directly to America’s leadership in space and scientific exploration.

By Rob Gutro 
NASA’s Goddard Space Flight Center

Elida – Eastern Pacific Ocean

Aug. 12, 2020 – NASA Finds Hurricane Elida’s Eye Covered

NASA’s Aqua satellite obtained visible imagery of Hurricane Elida in the Eastern Pacific as it continued to weaken. Imagery revealed that Elida’s eye had become covered as the storm embarks on a weakening trend over cooler waters.

Aqua image of Elida
NASA’s Aqua satellite provided a visible image to forecasters of Hurricane Elida on Aug. 11 that showed the eye had become covered by high clouds and the storm appeared more elongated. Image Courtesy: NASA Worldview, Earth Observing System Data and Information System (EOSDIS).

The Moderate Resolution Imaging Spectroradiometer or MODIS instrument that flies aboard NASA’s Aqua satellite captured a visible image of Hurricane Elida on Aug. 11 at 4:30 p.m. EDT and the eye had become obscured by high clouds. The image also revealed that the storm looked more elongated, another sign a storm is weakening. Satellite imagery was created using NASA’s Worldview product at NASA’s Goddard Space Flight Center in Greenbelt, Md.

Elida has moved into cooler waters, causing the storm to weaken. The hurricane have moved over waters of 23 to 24 degrees Celsius (73.4 to 75.2 degrees Fahrenheit). A hurricane needs sea surface temperatures of at least 26.6 degrees Celsius (80 degrees Fahrenheit) to maintain intensity.

Elida’s Status on Aug. 12

At 5 a.m. EDT (0900 UTC) on Aug. 12, the center of Hurricane Elida was located near latitude 23.0 degrees north and longitude 117.7 degrees west. That’s about 495 miles (800 km) west of the southern tip of Baja California, Mexico. Elida is moving toward the west-northwest near 13 mph (20 kph). A turn to the northwest along with some decrease in forward speed is expected to occur tonight. Maximum sustained winds are near 75 mph (120 kph) with higher gusts. The estimated minimum central pressure is 988 millibars.

Satellite imagery on Aug. 12 show that Elida’s remaining deep convection, located northeast of the center of circulation, continues to shrink in coverage and wane in intensity.

Elida Still Causing Ocean Swells

The National Hurricane Center (NHC) said, “Swells generated by Elida are expected to affect portions of the coast of west-central Mexico and the southern Baja California peninsula during the next day or two.  These swells are likely to cause life-threatening surf and rip current conditions.”

Elida’s Forecast Calls for Quick Demise

NHC noted that Elida is expected to weaken quickly. “Rapid weakening is expected during the next day or so as Elida moves over colder water, and the cyclone is forecast to weaken to a tropical storm today and degenerate to a remnant low [pressure area] on Thursday.”

About NASA’s Worldview and Aqua Satellite

NASA’s Earth Observing System Data and Information System (EOSDIS) Worldview application provides the capability to interactively browse over 700 global, full-resolution satellite imagery layers and then download the underlying data. Many of the available imagery layers are updated within three hours of observation, essentially showing the entire Earth as it looks “right now.”

NASA’s Aqua satellite is one in a fleet of NASA satellites that provide data for hurricane research.

Tropical cyclones/hurricanes are the most powerful weather events on Earth. NASA’s expertise in space and scientific exploration contributes to essential services provided to the American people by other federal agencies, such as hurricane weather forecasting.

For updated forecasts, visit: www.nhc.noaa.gov

By Rob Gutro
NASA’s Goddard Space Flight Center