Erick – Eastern Pacific Ocean

July 29, 2019 – NASA Tropical Storm Erick Strengthening

Infrared imagery from NASA’s Aqua satellite revealed a stronger Tropical Storm Erick in the Eastern Pacific Ocean. Satellite imagery revealed two areas of very cold cloud tops indicating powerful thunderstorms as the storm is on the cusp of hurricane status.

Aqua image of Erick
On July 29 at 6:35 a.m. EDT (1035 UTC) the MODIS instrument that flies aboard NASA’s Aqua satellite showed strongest storms in Tropical Storm Erick were around the center and in a band of thunderstorms southwest of the center where cloud top temperatures were as cold as minus 70 degrees Fahrenheit (minus 56.6 Celsius). Credit: NASA/NRL

Erick developed as Tropical Depression Six-E on Saturday, July 27, 2019. It formed about 1,215 miles (1,955 km) southwest of the southern tip of Baja California. Mexico. At 5:15 p.m. EDT that day, it strengthened into a tropical storm and was re-named Erick.

NASA’s Aqua satellite used infrared light to analyze the strength of storms and found the bulk of them in the southern quadrant. Infrared data provides temperature information, and the strongest thunderstorms that reach high into the atmosphere have the coldest cloud top temperatures.

On July 29 at 6:35 a.m. EDT (1035 UTC),the Moderate Imaging Spectroradiometer or MODIS instrument that flies aboard NASA’s Aqua satellite gathered infrared data on Tropical Storm Erick were around the center and in a band of thunderstorms southwest of the center where cloud top temperatures were as cold as minus 70 degrees Fahrenheit (minus 56.6 Celsius).

Cloud top temperatures that cold indicate strong storms with the potential to generate heavy rainfall. Those strongest storms were south and southeast of the center of the elongated circulation. Recent microwave data reveal the development of an eye.

The National Hurricane Center or NHC said, “At 5 a.m. HST (Hawaii local time) (1500 UTC) on July 29, 2019, the center of Tropical Storm Erick was located near latitude 12.3 degrees north and longitude 136.9 degrees west. That’s about 1,310 miles (2,110 km) east-southeast of Hilo, Hawaii.

Erick is moving toward the west near 17 mph (28 kph). A turn to the west-northwest and a slower forward speed is expected to start on Tuesday and continue through Wednesday. The estimated minimum central pressure is 991 millibars. Maximum sustained winds are near 70 mph (110 kph) with higher gusts. NHC said that the environment is currently favorable for intensification, and Erick is expected to become a hurricane at any time.

Erick can potentially become a major hurricane on Tuesday, July 30, and weakening trend is forecast to begin by later in the week.

For updated forecasts, visit: https://www.nhc.noaa.gov

By Rob Gutro
NASA’s Goddard Space Flight Center

Nari (was 07W) – Northwestern Pacific Ocean

July 26, 2019 – NASA Finds Two Areas of Strength in Tropical Storm Nari

NASA’s Terra satellite found two small areas of strength in Tropical Storm Nari on July 26 as it began to affect Japan.

Terra image of Nari
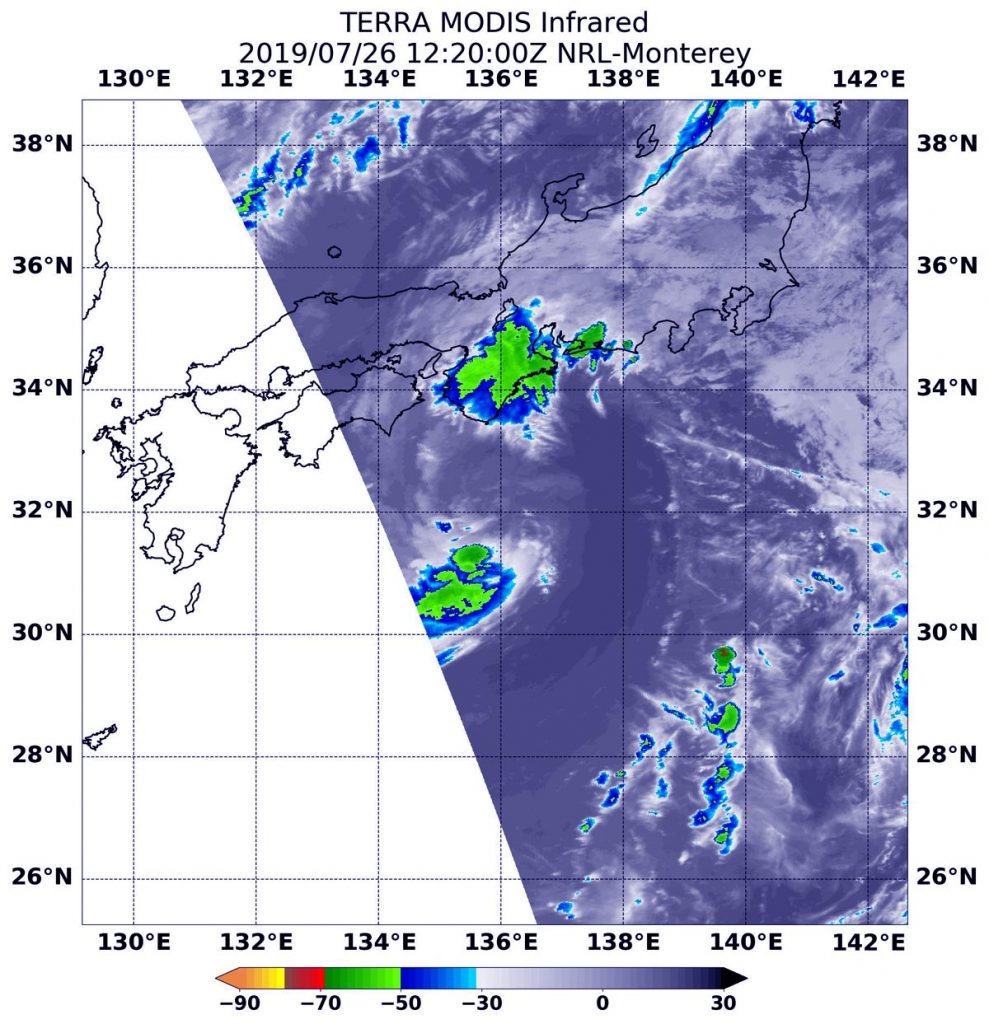
On July 26 at 8:20 a.m. EDT (1220 UTC), the MODIS instrument that flies aboard NASA’s Terra satellite showed two areas of strongest storms (yellow) in Tropical Storm Nari north and south of center. Cloud top temperatures in those areas were as cold as minus 50 degrees Fahrenheit (minus 45.5 Celsius). Credit: NASA/NRL

NASA’s Terra satellite uses infrared light to analyze the strength of storms by providing temperature information about the system’s clouds. The strongest thunderstorms that reach high into the atmosphere have the coldest cloud top temperatures.

On July 26 at 8:20 a.m. EDT (1220 UTC), the Moderate Imaging Spectroradiometer or MODIS instrument that flies aboard NASA’s Terra satellite gathered infrared data on Nari, formerly known as Tropical Storm 07W. There were two areas of strongest storms in Tropical Storm Nari, and they were north and south of the center of circulation. In those areas, thunderstorms had cloud top temperatures as cold as minus 50 degrees Fahrenheit (minus 45.5 Celsius). That northernmost area of strong storms was located over the Kyoto, Osaka and Wakayama Prefectures of Japan.

At 5 a.m. EDT (0900 UTC), the center of Tropical Storm Nari was located near latitude 30.9 degrees north and longitude 136.3 degrees east. That’s about 314 nautical miles southwest of Yokosaka, Japan. The tropical storm is moving toward the north-northwest. Maximum sustained winds were near 40 mph (35 knots/64 kph).

The Joint Typhoon Warning Center (JTWC) forecast for Nari brings the storm northward, with a turn to the east in 12 hours. JTWC said “The system is expected to maintain intensity prior to Landfall in Honshu. The system is expected to dissipate by 48 hours due to passage over land and cooler water to the east of Honshu.”

By Rob Gutro
NASA’s Goddard Space Flight Center

07W – Northwestern Pacific Ocean

July 25, 2019 – NASA’s Terra Satellite Finds Tropical Storm 07W’s Strength on the Side 

Wind shear can push clouds and thunderstorms away from the center of a tropical cyclone and that’s exactly what infrared imagery from NASA’s Terra satellite shows is happening in newly formed Tropical Storm 07W.

Terra image of 07W
On July 25 at 9:15 a.m. EDT (1315 UTC) the MODIS instrument that flies aboard NASA’s Terra satellite showed strongest storms in Tropical Storm 07W were east of the elongated center where cloud top temperatures were as cold as minus 70 degrees Fahrenheit (in red) (minus 56.6 Celsius). Credit: NASA/NRL

NASA’s Terra satellite used infrared light to analyze the strength of storms and found the bulk of them on the eastern side of the storm. Infrared data provides temperature information, and the strongest thunderstorms that reach high into the atmosphere have the coldest cloud top temperatures.

On July 25 at 9:15 a.m. EDT (1315 UTC), the Moderate Imaging Spectroradiometer or MODIS instrument that flies aboard Terra gathered infrared data on 07W and showed the strongest thunderstorms had cloud top temperatures as cold as minus 70 degrees Fahrenheit (minus 56.6 Celsius). Cloud top temperatures that cold indicate strong storms with the potential to generate heavy rainfall.

The storm is being affected my moderate vertical wind shear from the southwest. In general, wind shear is a measure of how the speed and direction of winds change with altitude. Tropical cyclones are like rotating cylinders of winds. Each level needs to be stacked on top each other vertically in order for the storm to maintain strength or intensify. Wind shear occurs when winds at different levels of the atmosphere push against the rotating cylinder of winds, weakening the rotation by pushing it apart at different levels. Wind shear can displace the clouds and showers of the system from around the center.

The Joint Typhoon Warning Center or JTWC noted at 11 a.m. EDT (1500 UTC) on July 25 that Tropical Storm 07W was located near 27.5 degrees north latitude and 137.4 east longitude, about 483 miles south-southwest of Yokosuka, Japan. 07W is moving to the north and has maximum sustained winds near 35 knots (40 mph/62 kph).

The JTWC forecast calls for 07W to move north. Once it reaches Japan, the system is expected to turn to the east-northeast and dissipate.

By Rob Gutro
NASA’s Goddard Space Flight Center

Dalila (was TD5E) – Eastern Pacific Ocean

July 25, 2019 – NASA Finds One Burst of Energy in Weakening Depression Dalila

Infrared imagery from NASA’s Aqua satellite found just a small area of cold clouds in thunderstorms within weakening Tropical Depression Dalila, enough to maintain it as a tropical cyclone.

Aqua image of Dalila
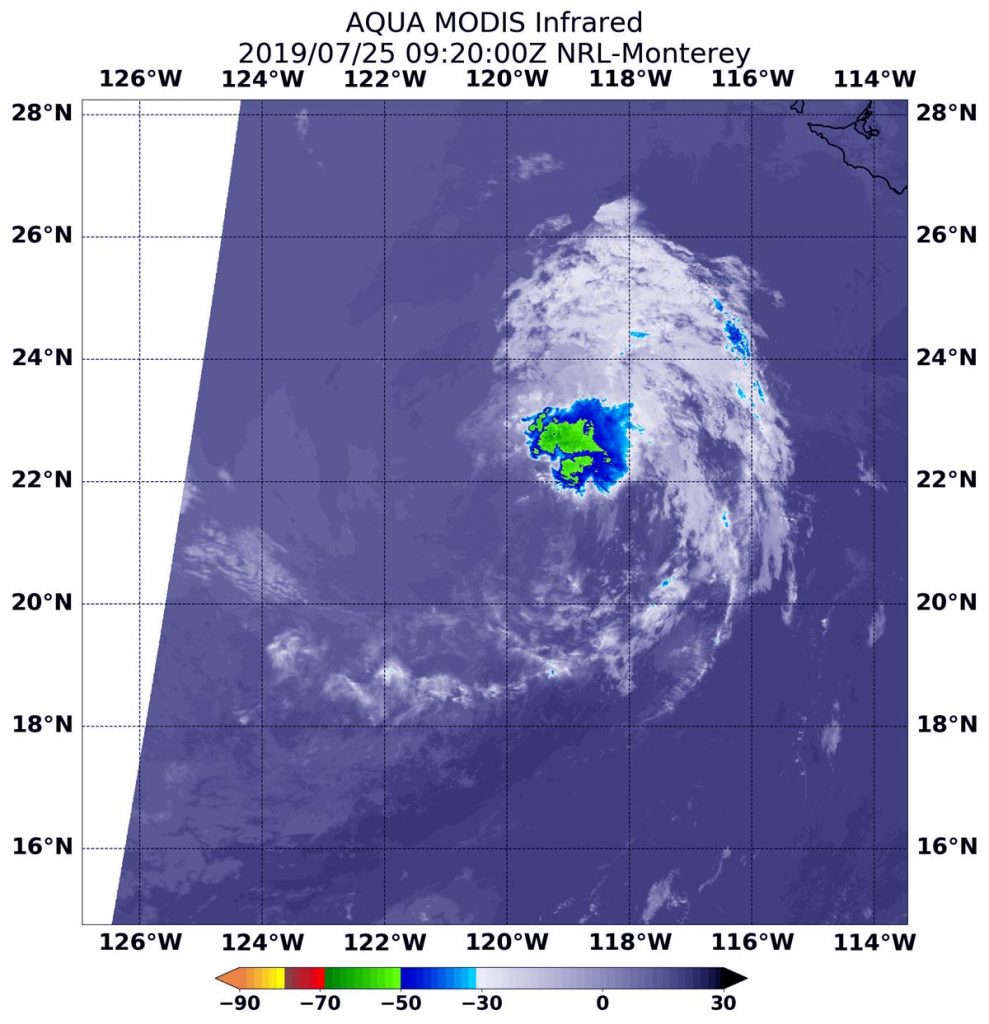
On July 25 at 5:20 a.m. EDT (0920 UTC), the MODIS instrument that flies aboard NASA’s Aqua satellite showed strongest storms in Dalila were in a small area north of the center. There cloud top temperatures were as cold as minus 50 degrees Fahrenheit (minus 45.5 Celsius). Credit: NASA/NRL

NASA’s Aqua satellite uses infrared light to analyze the strength of storms by providing temperature information about the system’s clouds. The strongest thunderstorms that reach high into the atmosphere have the coldest cloud top temperatures.

On July 25 at 5:20 a.m. EDT (0920 UTC), the Moderate Imaging Spectroradiometer or MODIS instrument that flies aboard NASA’s Aqua satellite gathered infrared data on Dalila. There was still a small area of strong thunderstorms with cloud top temperatures as cold as minus 50 degrees Fahrenheit (minus 45.5 Celsius). The National Hurricane Center or NHC noted, “Dalila is still technically a tropical cyclone based on the development of new convection within 70-75 nautical miles northeast of the center.” That thunderstorm development was enough to maintain its classification as a tropical cyclone.

The NHC said, “At 5 a.m. EDT (0900 UTC), the center of Tropical Depression Dalila was located near latitude 21.6 degrees north and longitude 120.4 degrees west. That’s about 675 miles (1,090 km) west of the southern tip of Baja California, Mexico. The depression is moving toward the northwest near 6 mph (9 kph) and this motion is expected to continue this morning. The estimated minimum central pressure is 1009 millibars. Maximum sustained winds remain near 30 mph (45 kph) with higher gusts.

Weakening is forecast during the next couple of days, and Dalila is expected to become a post-tropical remnant low later today.

For updated forecasts, visit: https://www.nhc.noaa.gov
By Rob Gutro
NASA’s Goddard Space Flight Center


Dalila (was TD5E) – Eastern Pacific Ocean

July 24, 2019 – Suomi NPP Satellite Sees Tropical Depression Dalila Fading

NASA-NOAA’s Suomi NPP satellite provided a visible image of weakening Tropical Depression Dalila in the Eastern Pacific Ocean.

Suomi NPP image of Dalila
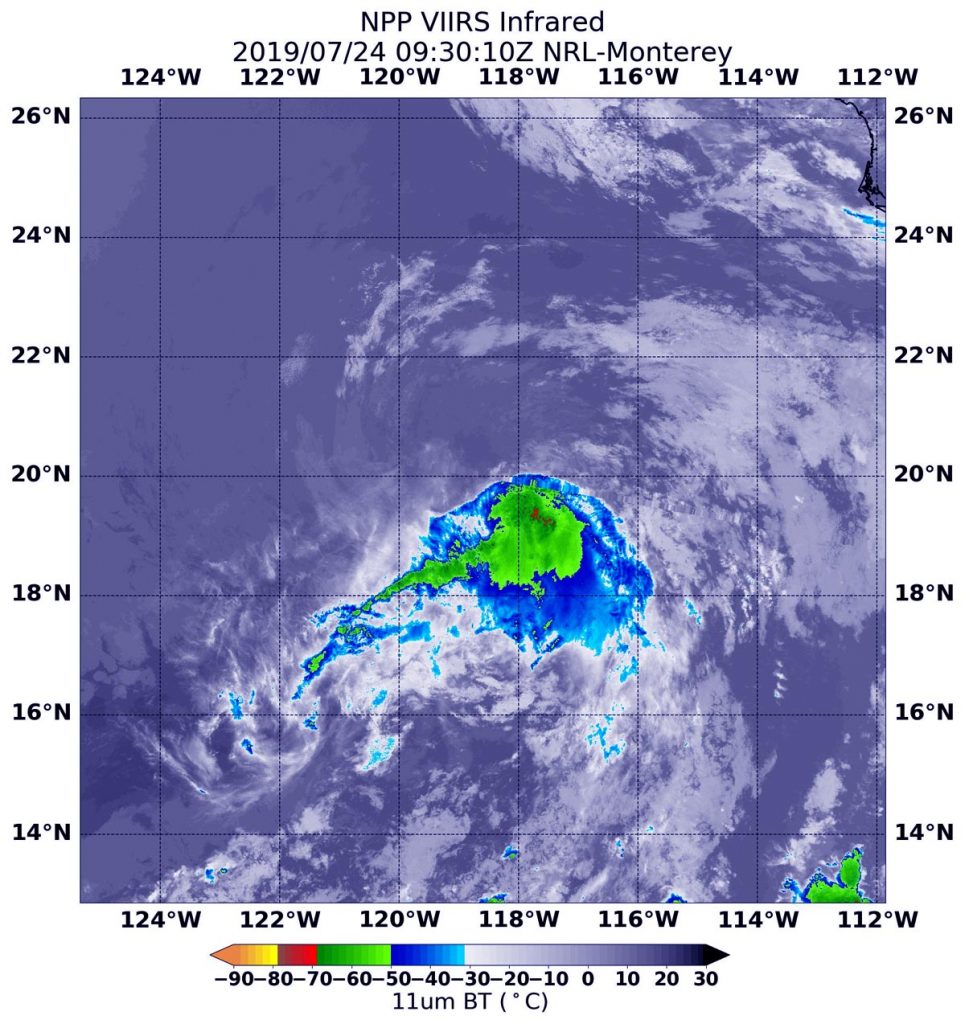
NASA-NOAA’s Suomi NPP satellite passed over the Eastern Pacific Ocean and captured an infrared view of Tropical Depression Dalila. Suomi NPP saw a limited area of strong thunderstorms where cloud top temperatures were as cold as minus 70 degrees Fahrenheit (minus 56.6 Celsius). Credit: NASA/NRL

Suomi NPP passed over Dalila on July 24 and the Visible Infrared Imaging Radiometer Suite (VIIRS) instrument provided a visible image of the storm. The VIIRS image showed that strong convection and developing thunderstorms associated with the cyclone has continued to decrease in coverage this morning. Suomi NPP saw a limited area of strong thunderstorms where cloud top temperatures were as cold as minus 70 degrees Fahrenheit (minus 56.6 Celsius).  The National Hurricane Center said that there is still a broken band of convection over the southeastern portion of the circulation.

At 11 a.m. EDT (1500 UTC) on July 24, the National Hurricane Center or NHC said the center of Tropical Depression Dalila was located near latitude 20.5 degrees north and longitude 119.0 degrees west. That’s about 605 miles (975 km) west-southwest of the southern tip of Baja California, Mexico. The depression is moving toward the northwest near 7 mph (11 kph), and this motion is expected to continue today.  A turn toward the west-northwest is forecast to occur by Thursday, and that general motion should continue until the system dissipates in a few days. Maximum sustained winds are near 35 mph (55 kph) with higher gusts.

The NHC noted that Dalila will be moving into an area where sea surface temperatures are too cold to maintain the tropical cyclone and into a dry and more stable airmass.  NHC said, “This should result in weakening, and the system is expected to degenerate into a remnant low within 24 hours.”

Weakening is forecast during the next couple of days, and Dalila is expected to become a post-tropical remnant low tonight.

By Rob Gutro 
NASA’s Goddard Space Flight Center

TD3 – Atlantic Ocean

July 24, 2019 – NASA’s Terra Sees the End of Atlantic Tropical Depression 3

The third tropical depression of the Atlantic Ocean hurricane season didn’t last long. NASA’s Terra satellite provided an image of the system’s remnant clouds on July 23, 2019.

Terra image of TD3
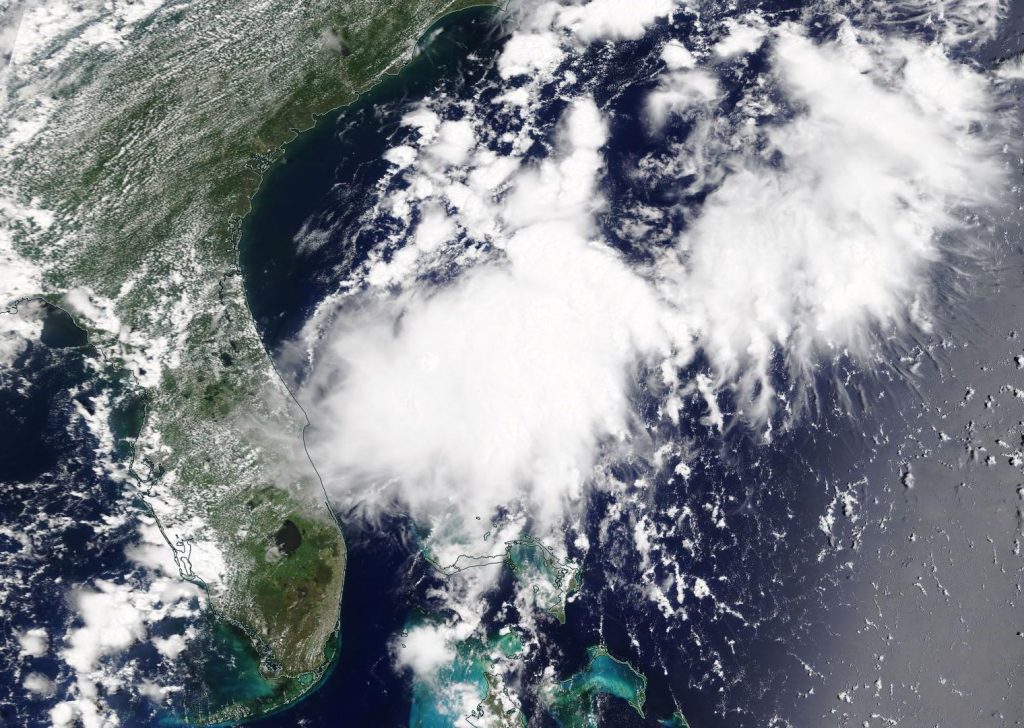
NASA’s Terra satellite captured a visible image of the remnants of Tropical Depression 3 on July 24, 2019 at 1:30 p.m. EDT off the east coast of Florida. Credit: NASA Worldview

Tropical Depression 3 formed on Monday, July 22 and dissipated by 11 a.m. EDT (1500 UTC) on July 24, 2019.  At that time, the National Hurricane Center or NHC issued the final advisory on the remnants of the depression as it dissipated near latitude 29.0 degrees north and longitude 80.0 degrees west. It was centered about 60 miles (100 km) east-southeast of Daytona Beach, Florida and about 100 miles (160 km) southeast of St. Augustine, Florida. The remnants were moving toward the north near 17 mph (28 kph).  Maximum sustained winds were near 35 mph (55 kph) with higher gusts.

Two hours after the final update from the NHC, the MODIS instrument aboard NASA’s Terra satellite captured a visible image of the remnants of Tropical Depression 3. The MODIS image showed the  elongated remnant clouds of Tropical Depression 3 on July 24, 2019 at 1:30 p.m. EDT off the east coast of Florida.

By Rob Gutro
NASA’s Goddard Space Flight Center

TD3 – Atlantic Ocean

July 23, 2019  – NASA Analyzes New Atlantic Depression’s Tropical Rainfall

Tropical Depression 3 has formed about off the eastern coast of central Florida. NASA analyzed the rainfall that the new depression was generating using the Global Precipitation Measurement mission or GPM core satellite.

GPM image of TD3
The Global Precipitation Measurement mission or GPM core satellite passed over Tropical Depression 3 at 5:21 a.m. EDT (0921 UTC) on July 23. GPM found the heaviest rainfall (orange) was northeast of the center of circulation. There, rain was falling at a rate of 25 mm (about 1 inch) per hour. Credit: NASA/JAXA/NRL

The third depression of the Atlantic Ocean hurricane season developed around 5 p.m. EDT on July 22 about 120 miles (195 km) southeast of West Palm Beach, Florida.

The Global Precipitation Measurement mission or GPM core satellite passed over Tropical Depression 3 at 5:21 a.m. EDT (0921 UTC) on July 23. GPM found the heaviest rainfall was northeast of the center of circulation. There, rain was falling at a rate of 25 mm (about 1 inch) per hour. The National Hurricane Center noted in their discussion, “Although deep convection has redeveloped near and to the northeast of the low-level center, the overall convective appearance is somewhat ragged.”

On July 23, the National Hurricane Center or NHC noted at 5 a.m. EDT (0900 UTC), the center of Tropical Depression Three was located near latitude 27.0 degrees North and longitude 79.5 degrees west. That puts the center of Tropical Depression 3 (TD3) about 40 miles (70 km) east-northeast of West Palm Beach, Florida, and about 55 miles (90 km) northwest Freeport, Grand Bahama Island.

Maximum sustained winds had increased to near 35 mph (55 kph) with higher gusts. No significant increase in strength is anticipated and the depression is forecast to dissipate on Wednesday, July 24.

The depression is moving toward the north near 12 mph (19 kph).  A motion toward north-northeast with an increase in forward speed is expected tonight, followed by a turn toward the northeast on Wednesday.

On the NHC forecast track, the center of the depression should remain offshore the coast of the southeastern United States through Wednesday.

GPM is a joint mission between NASA and the Japan Aerospace Exploration Agency, JAXA.

For forecast updates on TD3, visit: www.nhc.noaa.gov.

By Rob Gutro
NASA’s Goddard Space Flight Center

Dalila (was TD5E) – Eastern Pacific

July 23, 2019 – NASA Finds Depression Strengthen into Tropical Storm Dalila

Satellite imagery on July 22 showed that wind shear was preventing the Eastern Pacific Ocean’s Tropical Depression 5 from consolidating and strengthening. Infrared imagery from NASA’s Aqua satellite on July 23 showed that the wind shear eased and the storm was able to strengthen.

Aqua image of Dalila
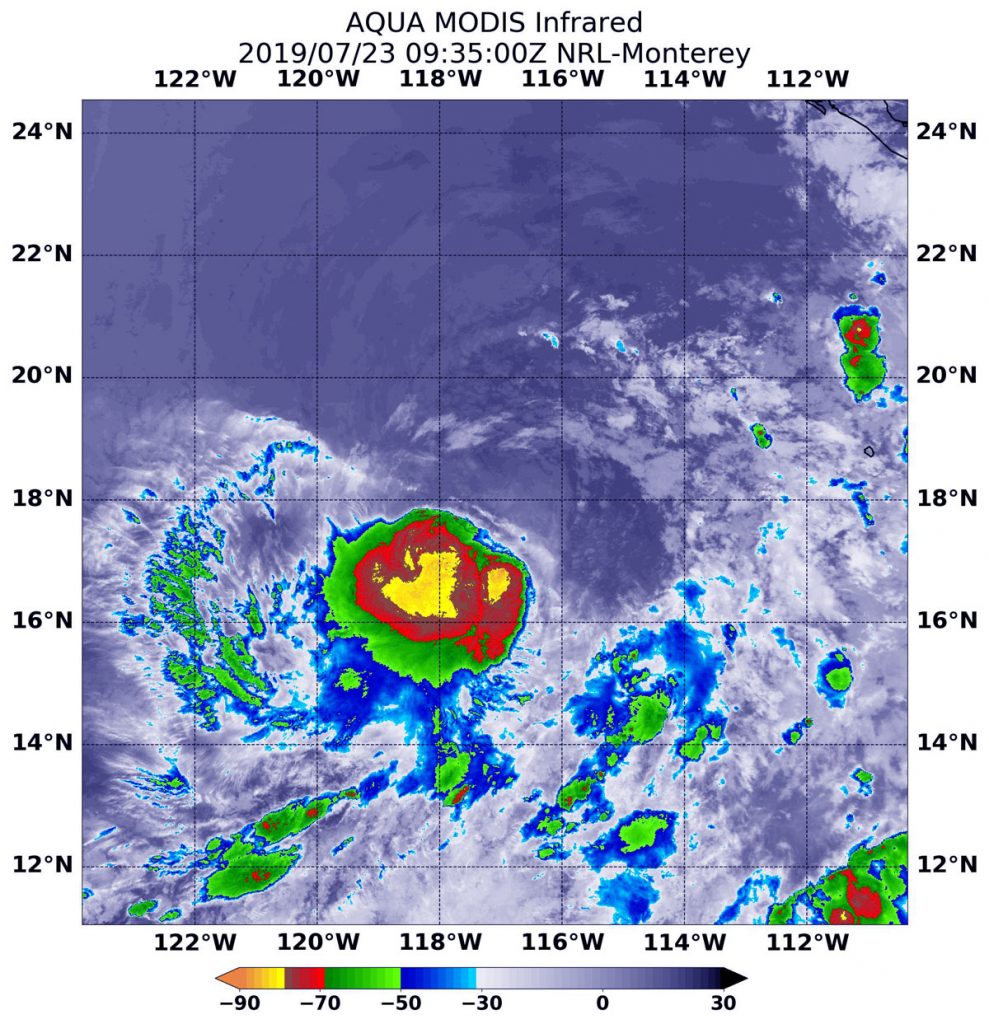
On July 23 at 5:35 a.m. EDT (0935 UTC), the MODIS instrument that flies aboard NASA’s Aqua satellite showed strongest storms (yellow) in Tropical Storm Dalila had cloud top temperatures as cold as minus 80 degrees Fahrenheit (minus 62.2 Celsius). Credit: NASA/NRL

NASA’s Aqua satellite used infrared light to analyze the strength of storms circled the center of circulation, a change from 24 hours before when wind shear pushed them away from the center. Now, the storm appears much more circular.

Infrared data provides temperature information, and the strongest thunderstorms that reach high into the atmosphere have the coldest cloud top temperatures.

On July 23 at 5:35 a.m. EDT (0935 UTC), the Moderate Imaging Spectroradiometer or MODIS instrument that flies aboard NASA’s Aqua satellite gathered infrared data on the strengthened Tropical Storm Dalila. Strongest thunderstorms had cloud top temperatures as cold as minus 80 degrees Fahrenheit (minus 62.2 Celsius). Cloud top temperatures that cold indicate strong storms with the potential to generate heavy rainfall.

At 5 a.m. EDT (0900 UTC) on July 23, the National Hurricane Center (NHC) the center of newly formed Tropical Storm Dalila was located near latitude 18.0 degrees north and longitude 117.3 degrees west. That is about 585 miles (945) km) southwest of the southern tip of Baja California, Mexico. There are no coastal watches or warnings in effect.

Maximum sustained winds have increased to near 40 mph (65 kph) with higher gusts.  The estimated minimum central pressure is 1005 millibars. Dalila is moving toward the north-northwest near 7 mph (11 kph). A turn to the northwest is anticipated on Wednesday, followed by a movement more to the west-northwest on Thursday and Friday.

NHC noted, “Some weakening is forecast to begin on Wednesday, and Dalila could degenerate into a remnant low on Thursday.”

For updated forecasts, visit: https://www.nhc.noaa.gov

By Rob Gutro
NASA’s Goddard Space Flight Center

TD5E (Eastern Pacific)

July 22, 2019 – NASA Sees Outside Winds Affecting New Tropical Eastern Pacific Depression

A new tropical depression formed in the Eastern Pacific Ocean, far enough away from the coast so that no coastal warnings are needed. Infrared imagery from NASA’s Aqua satellite shows that Tropical Depression 5E’s strongest storms were southwest of its center of circulation because of outside winds.

Aqua image of TD5E
On July 22 at 4:50 a.m. EDT (0850 UTC) the MODIS instrument that flies aboard NASA’s Aqua satellite showed strongest storms in Tropical Depression 5# were south of the elongated center where cloud top temperatures were as cold as minus 70 degrees Fahrenheit (red) (minus 56.6 Celsius). Credit: NASA/NRL

NASA’s Aqua satellite used infrared light to analyze the strength of storms and found the bulk of them in the southern quadrant. Infrared data provides temperature information, and the strongest thunderstorms that reach high into the atmosphere have the coldest cloud top temperatures.

On July 22 at 4:50 a.m. EDT (0850 UTC), the Moderate Imaging Spectroradiometer or MODIS instrument that flies aboard NASA’s Aqua satellite gathered infrared data on Tropical Depression 5E. Strongest thunderstorms had cloud top temperatures as cold as minus 70 degrees Fahrenheit (minus 56.6 Celsius). Cloud top temperatures that cold indicate strong storms with the potential to generate heavy rainfall. Those strongest storms were southwest of the center of circulation because of vertical wind shear (winds blowing at different speeds at different levels of the atmosphere).  The National Hurricane Center noted, “It appears that northeasterly shear is keeping much of the convection displaced to the west of the center of circulation.”

At 11 a.m. EDT (1500 UTC) on July 22, the National Hurricane Center (NHC) said the center of Tropical Depression Five-E was located near latitude 15.9 degrees North and longitude 116.3 degrees west. That’s about 640 miles (1.025 km) southwest of the southern tip of Baja California, Mexico.

The depression is moving toward the north near 9 mph (15 kph) and this motion is expected to continue for the next day or so, with a gradual turn to the northwest by midweek. Maximum sustained winds are near 35 mph (55 kph) with higher gusts. The estimated minimum central pressure is 1006 millibars.

NHC noted “Although convection [and thunderstorm development] has increased this morning, ] the [wind[shear is preventing the inner core of the depression from becoming better established.” Some slight strengthening is possible over the next couple of days, and the depression is expected to become a tropical storm later today or tonight.

For updated forecasts, visit: https://www.nhc.noaa.gov
By Rob Gutro
NASA’s Goddard Space Flight Center

Danas (Northwestern Pacific Ocean)

July 19, 2019 – NASA Sees Tropical Storm Danas Track through the East China Sea

NASA’s Aqua satellite provided a visible image of Tropical Storm Danas moving through the East China Sea on July 19, 2019.

Aqua image of Danas
On July 19, 2019, the MODIS instrument aboard NASA’s Aqua satellite provided a visible image of Tropical Storm Danas in the East China Sea. Credit: NASA Worldview, Earth Observing System Data and Information System (EOSDIS)

On July 19, the Moderate Resolution Imaging Spectroradiometer or MODIS instrument aboard NASA’s Aqua satellite captured a visible image of Danas that showed a large storm in the East China Sea. The storm is large and extends northeast into the Yellow Sea, east of the Korean Peninsula. The MODIS image also showed bands of strongest thunderstorms were east of the storm’s center of circulation.

At 11 a.m. EDT (1500 UTC), the center of Danas was located near latitude 32.3 degrees north and longitude 125.1 degrees west. Danas was about 266 nautical miles south-southwest of Kunsan Air Base, South Korea. Danas was moving to the north-northeast and had maximum sustained winds near 45 knots (52 mph/83 kph).

The Joint Typhoon Warning Center expects Danas to approach the southwestern coast of South Korea by 11 p.m. EDT (0300 UTC on July 20); it is forecast to weaken due to frictional effects moving over land. Significant weakening is forecast after landfall.

By Rob Gutro
NASA’s Goddard Space Flight Center