Maha – Northern Indian Ocean

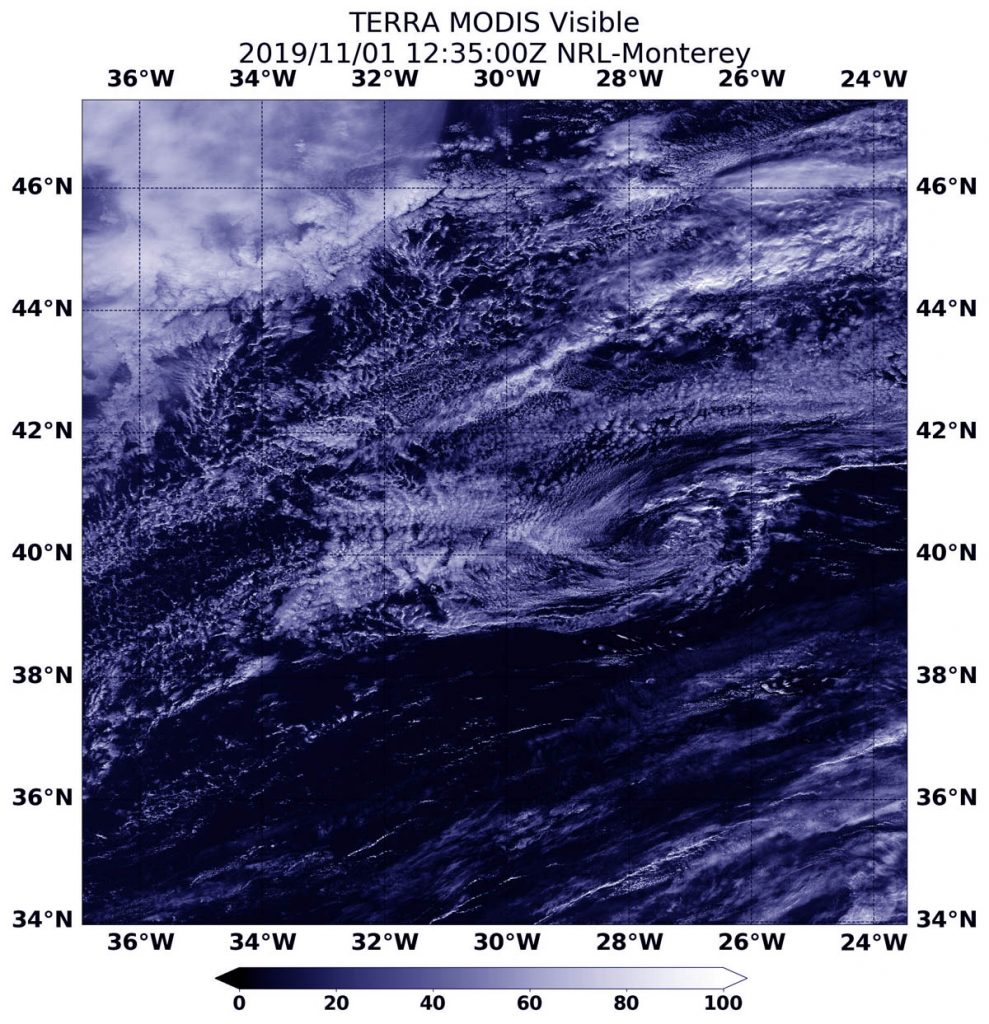
Nov. 01, 2019 – NASA Finds Tropical Storm Maha’s Heavy Rain Potential Over Lakshadweep

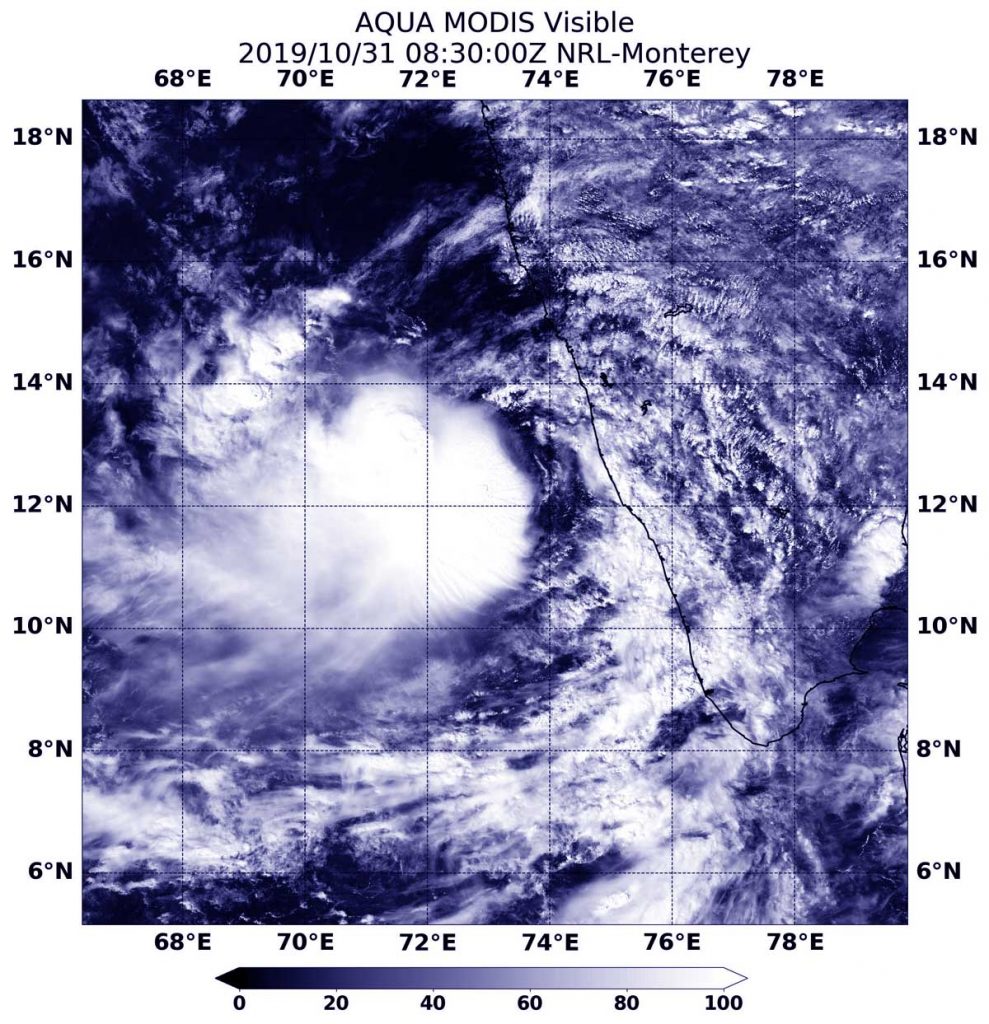
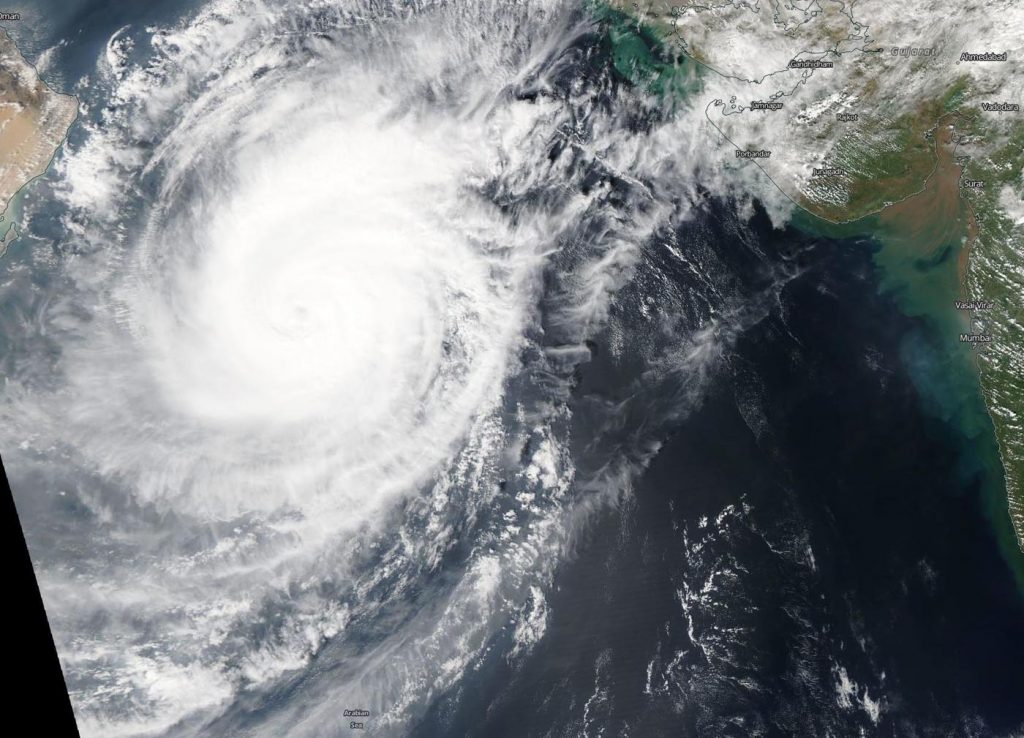
Tropical Cyclone Maha continued to move north along the southwestern coast of India when NASA’s Aqua satellite passed overhead and analyzed the cloud top temperatures. Satellite imagery showed the storms with the greatest rainfall potential were over the Lakshadweep islands.

Aqua image of Maha
On Oct. 31 at 4:29 a.m. EDT (0829 UTC) NASA’s Aqua satellite analyzed Tropical Cyclone Maha using the AIRS instrument. AIRS showed the strongest storms were located over the Lakshadweep Islands where the coldest cloud top temperatures as cold as or colder than 210 Kelvin (purple) minus 81 degrees Fahrenheit (minus 63.1 degrees Celsius) around the center. Credit: NASA JPL/Heidar Thrastarson

One of the ways NASA researches tropical cyclones is using infrared data that provides temperature information. Cloud top temperatures identify where the strongest storms are located. The stronger the storms, the higher they extend into the troposphere, and the colder the cloud temperatures.

Tropical cyclones do not always have uniform strength, and some sides are stronger than others, so knowing where the strongest sides of the storms are located helps forecasters. NASA then provides data to tropical cyclone meteorologists so they can incorporate it in their forecasts. The AIRS imagery appeared to show those strongest storms were on the eastern side of Maha.

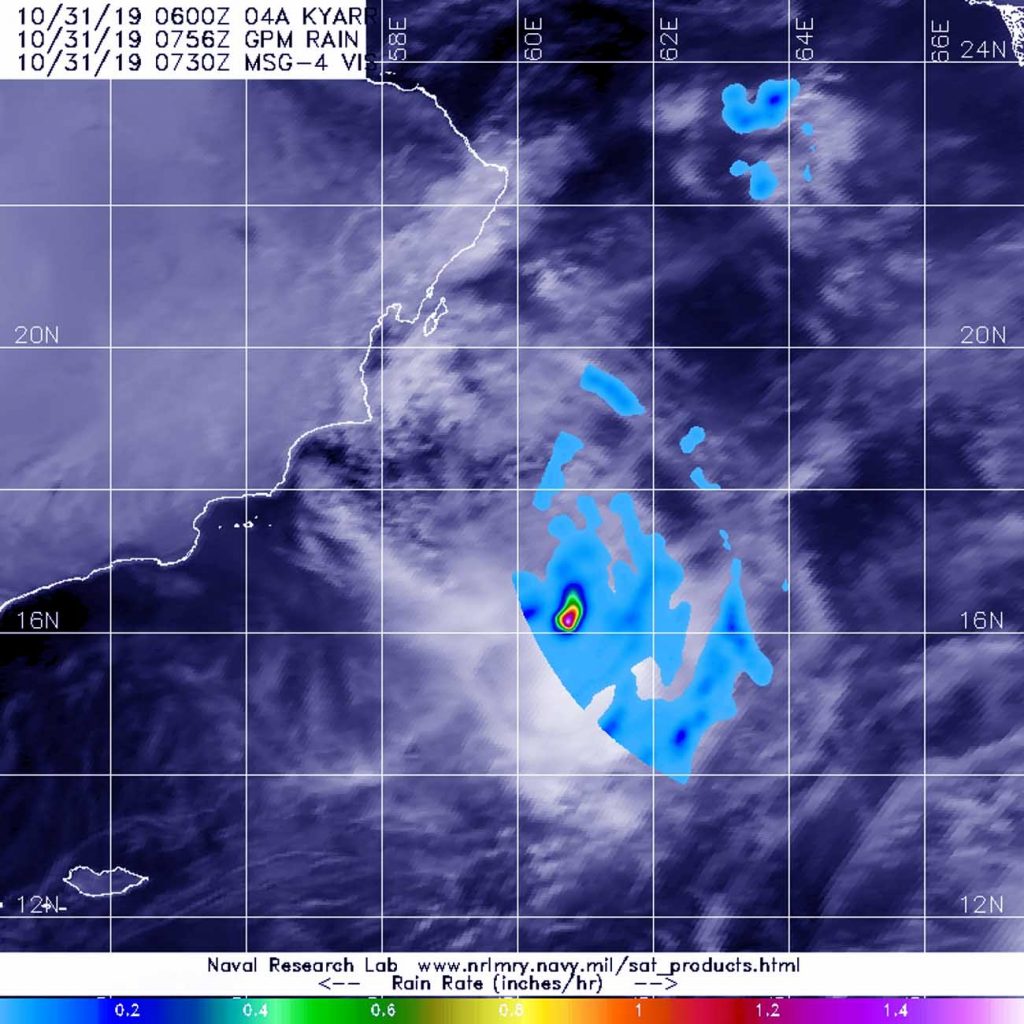
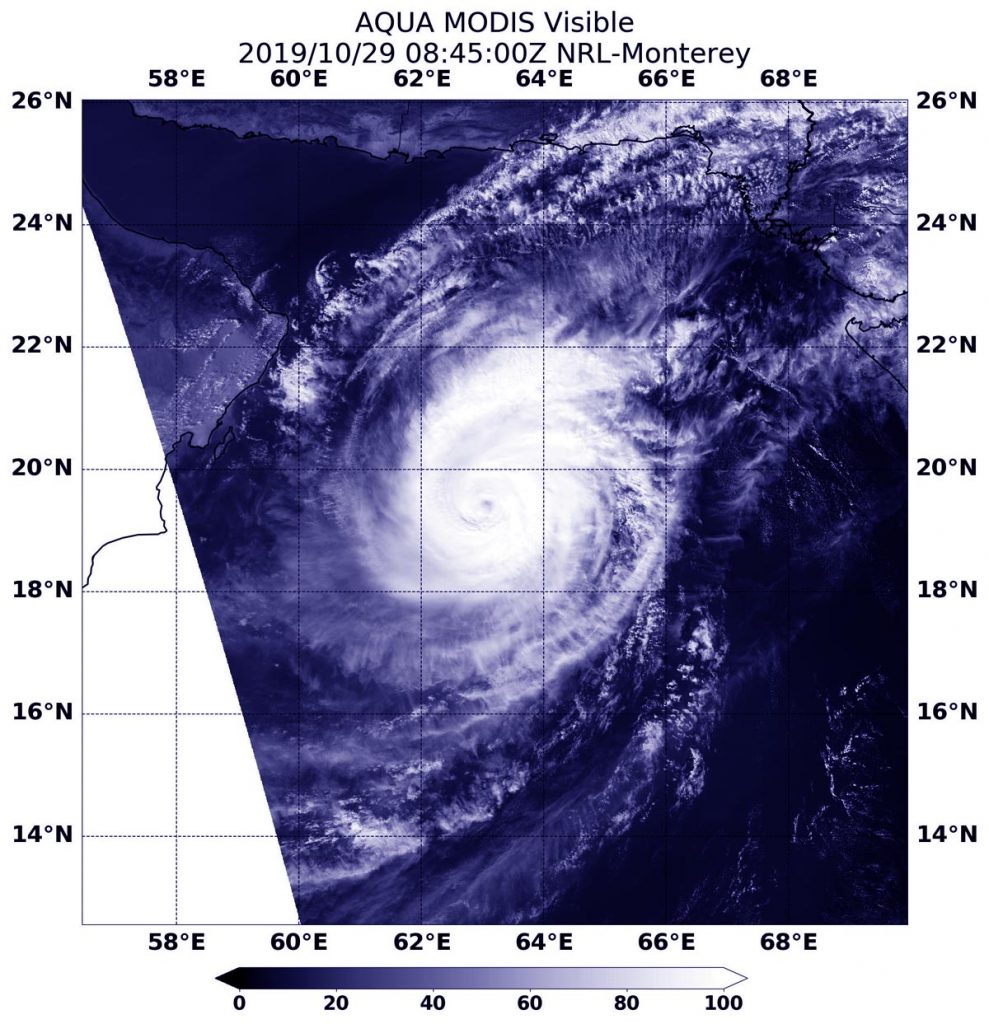
On Oct. 31 at 4:29 a.m. EDT (0829 UTC) NASA’s Aqua satellite analyzed the storm using the Atmospheric Infrared Sounder or AIRS instrument. The AIRS imagery showed the strongest storms were located over the Lakshadweep Islands. Lakshadweep is a group of about three dozen islands scattered over about 30,000 square miles (78,000 square km) in the Arabian Sea off the southwestern coast of India.

AIRS found coldest cloud top temperatures as cold as or colder than 210 Kelvin (minus 81 degrees Fahrenheit  or minus 63.1 degrees Celsius) around the center as well as east of center. NASA research has shown that cloud top temperatures that cold indicate strong storms that have the capability to create heavy rain.

At 11 a.m. EDT (1500 UTC) on Nov. 1, the Joint Typhoon Warning Center or JTWC noted that the center of Maha was located near latitude 16.0 degrees north latitude and longitude 69.0 degrees east longitude. That puts the center about 555 nautical miles south-southeast of Karachi, Pakistan. Maximum sustained winds were near 45 knots (52 mph/83 kph).

Maha is forecast to continue moving northwest and parallel to the west coast of the Indian peninsula. After three days, the storm is forecast to turn west into the central Arabian Sea.

Hurricanes are the most powerful weather event on Earth. NASA’s expertise in space and scientific exploration contributes to essential services provided to the American people by other federal agencies, such as hurricane weather forecasting.

The AIRS instrument is one of six instruments flying on board NASA’s Aqua satellite, launched on May 4, 2002.

By Rob Gutro
NASA’s Goddard Space Flight Center  

Rebekah – North Atlantic Ocean

Nov. 01, 2019 – NASA Satellite Imagery Finds Rebekah Now Post-Tropical

NASA’s Terra Satellite provided a visible image of Post-Tropical Cyclone Rebekah as it continued moving in an easterly direction through the North Atlantic Ocean. Satellite data has confirmed that Rebekah is now a post-tropical cyclone.

Terra image of Rebekah
On Nov. 1 at 08:35 a.m. EDT (12:35 UTC), the MODIS instrument that flies aboard NASA’s Terra provided a visible image of Post-Tropical Cyclone Rebekah moving through the North Atlantic Ocean. Rebekah was devoid of strong thunderstorm development and appeared as a circulation of wispy clouds. Credit: NASA/NRL

At 5 a.m. EDT (0900 UTC) on Nov. 1, the center of Post-Tropical Cyclone Rebekah was located near latitude 40.6 degrees north and longitude 29.0 degrees west. That puts the center about 140 miles (225 km) north of Faial Island in the central Azores islands. The Azores are an archipelago or group of islands that are an autonomous region of Portugal.

The post-tropical cyclone is moving toward the east near 20 mph (31 kph) and this motion is expected to continue through tonight. Maximum sustained winds have decreased to near 35 mph (55 kph) with higher gusts. The estimated minimum central pressure is 1005 millibars. The National Hurricane Center (NHC) issued the final advisory on the system and Rebekah was designated post-tropical.

On Nov. 1 at 08:35 a.m. EDT (12:35 UTC), the Moderate Resolution Imaging Spectroradiometer or MODIS instrument that flies aboard NASA’s Terra satellite provided a visible image of Rebekah just after it was designated a post-tropical cyclone. The image revealed that Rebekah has degenerated to a remnant low-pressure area because the circulation was devoid of deep convection and strong thunderstorms. Rebekah appeared as a circulation of wispy clouds in the Terra satellite image.

A Post-Tropical Storm is a generic term for a former tropical cyclone that no longer possesses sufficient tropical characteristics to be considered a tropical cyclone. Former tropical cyclones can become fully extratropical, subtropical, or remnant lows, which are three classes of post-tropical cyclones. In any case, they no longer possesses sufficient tropical characteristics to be considered a tropical cyclone. However, post-tropical cyclones can continue carrying heavy rains and high winds.

NOAA’s National Hurricane Center discussion noted that Rebekah is starting to merge with a weak frontal system over the northeastern Atlantic. The remnants of Rebekah are expected to weaken to a trough or elongated area of low pressure between 12 and 24 hours.

Hurricanes are the most powerful weather event on Earth. NASA’s expertise in space and scientific exploration contributes to essential services provided to the American people by other federal agencies, such as hurricane weather forecasting.

For updated forecasts, visit: www.nhc.noaa.gov

By Rob Gutro
NASA’s Goddard Space Flight Center

Rebekah – North Atlantic Ocean

Oct. 31, 2019 – NASA Gets Infrared View of Atlantic Halloween Subtropical Storm

The latest addition to the Atlantic Ocean hurricane season developed quickly. NASA’s Aqua satellite passed over the eastern North Atlantic Ocean on Halloween and provided forecasters with an infrared view of Subtropical Storm Rebekah.

Aqua image of Rebekah
On Oct. 31, 2019 at 11:15 a.m. EDT (1515 UTC), NASA’s Aqua satellite revealed that Rebekah’s coldest cloud tops and strongest storms (yellow) were as cold as or colder than minus 50 degrees Fahrenheit (minus 45.5 Celsius) around the center of circulation in a band of thunderstorms wrapping into the center from the northeastern quadrant. Credit: NASA/NRL

Infrared data provides temperature information, and the strongest thunderstorms that reach high into the atmosphere have the coldest cloud top temperatures.

NASA’s Aqua satellite passed over Rebekah on Oct. 31, 2019 at 11:15 a.m. EDT (1515 UTC) and measured the cloud top temperatures. The strongest storms with coldest cloud tops were as cold as or colder than minus 50 degrees Fahrenheit (minus 45.5 Celsius) around the center of circulation in a band of thunderstorms wrapping into the center from the northeastern quadrant.

What is a Subtropical Storm?

Rebekah developed on Halloween eve, Oct. 30, by 5 p.m. EDT as a subtropical storm. NOAA’s National Hurricane Center defines subtropical storms as “A non-frontal low-pressure system that has characteristics of both tropical and extratropical cyclones. Like tropical cyclones, they are non-frontal, synoptic-scale cyclones that originate over tropical or subtropical waters, and have a closed surface wind circulation about a well-defined center. In addition, they have organized moderate to deep convection, but lack a central dense overcast. Unlike tropical cyclones, subtropical cyclones derive a significant proportion of their energy from baroclinic sources, and are generally cold-core in the upper troposphere, often being associated with an upper-level low or trough. In comparison to tropical cyclones, these systems generally have a radius of maximum winds occurring relatively far from the center (usually greater than 60 nautical miles), and generally have a less symmetric wind field and distribution of convection.

Rebekah’s Halloween Status

At 11 a.m. EDT (1500 UTC), the NHC or National Hurricane Center reported that the center of Subtropical Storm Rebekah was located near latitude 40.7 degrees north, longitude 35.3 west. The storm is moving toward the east-northeast near 18 mph (30 kph). An eastward turn with some increase in forward speed is anticipated by early Friday. Maximum sustained winds remain near 45 mph (75 kph) with higher gusts. Winds of 40 mph extend outward up to 70 miles (110 km) from the center. The estimated minimum central pressure is 990 millibars.

The storm should weaken and become a post-tropical cyclone by this evening or early tomorrow, Nov. 1. 

What is a Post-tropical Cyclone?

NHC defines a post-tropical cyclone as a former tropical cyclone. This generic term describes a cyclone that no longer possesses sufficient tropical characteristics to be considered a tropical cyclone. Post-tropical cyclones can continue carrying heavy rains and producing high winds. Note that former tropical cyclones that have become fully extratropical as well as remnant lows are two classes of post-tropical cyclones.

Hurricanes are the most powerful weather event on Earth. NASA’s expertise in space and scientific exploration contributes to essential services provided to the American people by other federal agencies, such as hurricane weather forecasting.

By Rob Gutro
NASA’s Goddard Space Flight Center

Maha – Northern Indian Ocean

Oct. 31, 2019 – NASA Sees Development of Tropical Storm Maha at Southwestern India Coast

Tropical Storm Maha has developed near the coastline of southwestern India and NASA’s Terra satellite provided forecasters with a visible image of the storm.

Aqua image of Maha
On Oct. 31 at 4:30 a.m. EDT (0830 UTC), the MODIS instrument that flies aboard NASA’s Aqua satellite took this image of Tropical Storm Maha just off the coast of southwestern India. Credit: NASA Worldview

On Oct. 31 at 4:30 a.m. EDT (0830 UTC), the Moderate Imaging Spectroradiometer or MODIS instrument that flies aboard NASA’s Aqua satellite provided a visible image of Maha. The image showed Maha was off the coast of southwestern India. The storm also appeared somewhat elongated so it is still in the process of consolidating and strengthening.

The shape of the storm is a clue to forecasters that a storm is either strengthening or weakening. If a storm takes on a more rounded shape it is getting more organized and strengthening. Conversely, if it becomes less rounded or elongated, it is a sign the storm is weakening. Maha has appeared to become more symmetrical in the MODIS imagery on Oct. 31, indicating it had become better organized.

At 5 a.m. EDT (0900 UTC) on Oct. 31, the center of Tropical Storm Maha was located near latitude 11.9 degrees north and longitude 73.1 degrees east. That puts the center about 848 nautical miles south-southeast of Karachi, Pakistan, and just west of the southern tip of India. Maximum sustained winds were near 60 knots (69 mph/111 kph).

The Joint Typhoon Warning Center or JTWC noted that Maha will move northwest, parallel to the west coast of the Indian peninsula over the next couple of days.

Hurricanes are the most powerful weather event on Earth. NASA’s expertise in space and scientific exploration contributes to essential services provided to the American people by other federal agencies, such as hurricane weather forecasting.

For updated forecasts, visit: https://www.nhc.noaa.gov

By Rob Gutro
NASA’s Goddard Space Flight Center

Kyarr – Northern Indian Ocean

Oct. 31, 2019 – NASA Finds Small Area of Heavy Rain Left in Tropical Cyclone Kyarr

Tropical Cyclone Kyarr appears to be winding down as it moves through the Arabian Sea and NASA provided forecasters with an analysis of rainfall rates occurring in the weakening storm.

GPM Image of Kyarr
The GPM core satellite passed over strengthening Tropical Storm Kyarr in the Arabian Sea on Oct. 31, 2019 at 3:56 a.m. EDT (0756 UTC) and found the heaviest rainfall (pink) in a very small area around the center of circulation where rain was falling at 1.6 inches (40 mm) per hour. Most of the rain falling throughout the rest of the system was occurring (blue) at a rate of over 25 mm (about 1 inch) per hour. Credit: NASA/JAXA/NRL

NASA has the unique capability of peering under the clouds in storms and measuring the rate in which rain is falling. Global Precipitation Measurement mission or GPM core passed over Kyarr from its orbit in space and measured rainfall rates throughout the storm.

The GPM’s core satellite passed over Tropical Cyclone Kyarr in the Arabian Sea, Northern Indian Ocean on Oct. 31 at 3:56 a.m. EDT (0756 UTC) and found the heaviest rainfall occurring in a very small area around the center of circulation where rain was falling at 1.6 inches (40 mm) per hour. Most of the rain falling throughout the rest of the system was occurring at a rate of over 25 mm (about 1 inch) per hour Forecasters incorporate the rainfall data into their forecasts.

At 5 a.m. EDT (0900 UTC) on Oct. 31, the Joint Typhoon Warning Center or JTWC noted that Kyarr was located near latitude 17.7 degrees north and longitude 59.9. degrees east, about 174 miles south-southeast of Masirah Island, Oman. Kyarr was moving to the southwest and had maximum sustained winds 35 knots (40 mph/65 kph).

Kyarr is moving southwest and is weakening rapidly. The storm is expected to dissipate before reaching Socotra Island.

Hurricanes are the most powerful weather event on Earth. NASA’s expertise in space and scientific exploration contributes to essential services provided to the American people by other federal agencies, such as hurricane weather forecasting.

Both the Japan Aerospace Exploration Agency, JAXA and NASA manage GPM.

By Rob Gutro
NASA’s Goddard Space Flight Center

Kyarr – Northern Indian Ocean

Oct. 30, 2019 – NASA Find Tropical Cyclone Kyarr With a Cloud-filled Eye

NASA satellite imagery revealed that Tropical Cyclone Kyarr has maintained its eye, although that eye has become cloud-filled.

Aqua image of Kyarr
On Oct. 30, the MODIS instrument that flies aboard NASA’s Terra satellite took this image of Tropical Cyclone Kyarr in the Arabian Sea. The storm maintained an eye, although clouds filled it in. Credit: NASA Worldview

On Oct. 30, the Moderate Imaging Spectroradiometer or MODIS instrument that flies aboard NASA’s Terra satellite provided a visible image on Kyarr as it tracks through the Arabian Sea. The MODIS image showed that the storm maintained an eye, but it had become filled with high clouds. The eye also appeared somewhat oblong, indicating that the storm is weakening. Large feeder bands, that is, bands of powerful thunderstorms that spiral into the low-level center, extended north and south of center.

The shape of the storm is a clue to forecasters that a storm is either strengthening or weakening. If a storm takes on a more rounded shape it is getting more organized and strengthening. Conversely, if it becomes less rounded or elongated, it is a sign the storm is weakening.

After the MODIS image was taken, a microwave satellite image revealed the defined oblong microwave eye feature, but the bulk of the deep convection (strong thunderstorms) were confined to the eastern semicircle.

At 5 a.m. EDT (0900 UTC) on Oct. 30, the center of Tropical Cyclone Kyarr was located near latitude 19.2 degrees north and longitude 61.8 degrees east. That puts the center about 184 nautical miles east-southeast of Masirah Island, Oman. Maximum sustained winds were near 90 knots (104 mph/167 kph).

The Joint Typhoon Warning Center or JTWC noted that Kyarr is moving toward the southwest. JTWC noted, “The system should weaken gradually as environmental conditions degrade with more rapid weakening expected after 24 hours due to increasing easterly upper-level convergent flow [where lines of equal atmospheric pressure are pressed together between a high-pressure area to the north and the tropical cyclone or low-pressure system] and potentially dry air entrainment [dry air moving into the storm and sapping the moisture that helps create the thunderstorms the make up the storm].”

Hurricanes are the most powerful weather event on Earth. NASA’s expertise in space and scientific exploration contributes to essential services provided to the American people by other federal agencies, such as hurricane weather forecasting.

By Rob Gutro
NASA’s Goddard Space Flight Center

Matmo – South China Sea

Oct. 30, 2019 – NASA Finds Tropical Storm Matmo Consolidating off Vietnam Coast

NASA-NOAA’s Suomi NPP satellite captured an image of Tropical Storm Matmo as it developed in the South China Sea, off the coast of Vietnam. The storm is expected to make a landfall in central southeastern Vietnam later on Oct. 30.

Suomi NPP image of Matmo
NASA-NOAA’s Suomi NPP satellite passed over Tropical Storm Matmo in the South China Sea on Oct. 30 as it was nearing the coast of southeastern central Vietnam. Credit: NASA Worldview, Earth Observing System Data and Information System (EOSDIS)

Visible imagery from NASA satellites help forecasters understand if a storm is organizing or weakening. The Visible Infrared Imaging Radiometer Suite (VIIRS) instrument aboard Suomi NPP provided a visible image of Matmo on Oct. 30 and found the storm taking on a much more rounded shape than the previous day.

The shape of the storm is a clue to forecasters that a storm is either strengthening or weakening. If a storm takes on a more rounded shape it is getting more organized and strengthening. Conversely, if it becomes less rounded or elongated, it is a sign the storm is weakening.

At 5 a.m. EDT (0900 UTC) on Oct. 30, the center of Matmo was near latitude 13.2 degrees north and longitude 111.0 degrees east. The post-tropical cyclone was moving toward the west-northwest. Maximum sustained winds associated with this system are near 46 mph (40 knots/74 kph) with higher gusts.

Vietnam’s National Centre for Hydro-Meteorological Forecasting (NCHMF) has posted a tropical storm warning for southeast central Vietnam. Matmo is expected to make landfall near Nha Trang. Nha Trang lies on the coast and is the capital of the Khanh Hoa Province, on the South Central Coast of Vietnam.

The Joint Typhoon Warning Center expects that Matmo will move west-northwest to make landfall in Vietnam later in the day.

Hurricanes are the most powerful weather event on Earth. NASA’s expertise in space and scientific exploration contributes to essential services provided to the American people by other federal agencies, such as hurricane weather forecasting.

For updated forecasts from the National Centre for Hydro-Meteorological Forecasting (NCHMF), visit: http://www.nchmf.gov.vn/

By Rob Gutro 
NASA’s Goddard Space Flight Center

Kyarr – Northern Indian Ocean

Oct. 29, 2019 – NASA Identifies a Strong Arabian Sea Tropical Cyclone Kyarr

NASA’s Aqua satellite captured an image of Tropical Cyclone Kyarr in the Arabian Sea is it headed west toward Oman. The visible image showed a powerful and organized storm with an eye.

Aqua image of Kyarr
On Oct 29 at 4:45 a.m., EDT (0845 UTC) the MODIS instrument that flies aboard NASA’s Aqua satellite provided a visible image of Tropical Cyclone Kyarr in the central Arabian Sea. Credit: NASA Worldview

On Oct 29 at 4:45 a.m. EDT (0845 UTC), the Moderate Imaging Spectroradiometer or MODIS instrument that flies aboard NASA’s Aqua satellite provided a visible image of Kyarr. The MODIS image showed the cyclone continues to produce a large area of deep convection and strong thunderstorms around the visible eye. Satellite imagery showed the ragged eye is about 19 nautical miles in diameter. Bands of thunderstorms were wrapping into the low-level center from the north and east of the center.

At 5 a.m. EDT (0900 UTC), the center of Tropical Cyclone Kyarr was located near latitude 19.4 degrees north and longitude 63.1 degrees east. That is about 257 nautical miles east-southeast of Masirah Island.  The storm has tracked northwestward. However, two large areas of high pressure are expected to turn the storm to the southwest. Maximum sustained winds were near 115 knots (132 mph/213 kph) and the storm is on a weakening trend.

Kyarr is forecast to turn to the southwest and parallel the coast of Oman and Yemen, move through the opening of the Gulf of Aden, pass just west of Socotra Island and make landfall in Somalia.

NASA’s Aqua satellite is one in a fleet of NASA satellites that provide data for hurricane research.

Hurricanes are the most powerful weather event on Earth. NASA’s expertise in space and scientific exploration contributes to essential services provided to the American people by other federal agencies, such as hurricane weather forecasting.

For updated forecasts, visit: https://www.nhc.noaa.gov

By Rob Gutro
NASA’s Goddard Space Flight Center

Kyarr – Northern Indian Ocean

Oct. 28, 2019 – NASA Finds Arabian Sea Tropical Cyclone Kyarr’s Heavy Rainfall

Tropical Cyclone Kyarr is moving through the central Arabian Sea and NASA provided forecasters with an analysis of rainfall rates occurring in the powerful tropical cyclone.

GPM image of Kyarr
The GPM’s core satellite passed over Tropical Cyclone Kyarr in the Arabian Sea, Northern Indian Ocean on Oct. 28 at 4:56 a.m. EDT (0856 UTC). GPM found the heaviest rainfall stretching from the northern to the eastern side of the storm where it was falling at a rate of over 40 mm (about 1.6 inches) per hour. Credit: NASA/JAXA/NRL

NASA has the unique capability of peering under the clouds in storms and measuring the rate in which rain is falling. Global Precipitation Measurement mission or GPM passed over Kyarr from its orbit in space and measured rainfall rates throughout the storm.

GPM passed over Tropical Cyclone Kyarr in the Arabian Sea, Northern Indian Ocean on Oct. 28 at 4:56 a.m. EDT (0856 UTC). GPM found the heaviest rainfall stretching from the northern to the eastern side of the storm where it was falling at a rate of over 40 mm (about 1.6 inches) per hour. Forecasters incorporate the rainfall data into their forecasts.

At 11 a.m. EDT (1500 UTC) on Oct. 28, the Joint Typhoon Warning Center or JTWC noted that Kyarr was located near latitude 18.5 degrees north and longitude 64.4 degrees east, about 337 miles east-southeast of Masirah Island, Oman. Kyarr was moving to the west-northwest and had maximum sustained winds 130 knots (150 mph/241 kph). That means that Kyarr is a major hurricane on the Saffir-Simpson Hurricane Wind scale and is equivalent to a Category 4 hurricane.

AIRS image of Kyarr
On Oct. 27, 2019 at 5:05 p.m. EDT (2105 UTC), the AIRS instrument aboard NASA’s Aqua satellite provided a false-color image of cloud top temperatures using infrared data. Coldest temperatures, as cold as or colder than minus 63 degrees Fahrenheit (minus 53 degrees Celsius) appear in purple. Credit: NASA JPL/Heidar Thrastarson

Kyarr is moving west and is forecast to start weakening within 24 hours. The storm is then forecast to turn to the west-southwest while slowly weakening as it approaches the Gulf of Aden.

The previous day, on Oct. 27, 2019 at 5:05 p.m. EDT (2105 UTC), the AIRS instrument aboard NASA’s Aqua satellite provided cloud top temperatures using infrared data. Coldest temperatures, as cold as or colder than minus 63 degrees Fahrenheit (minus 53 degrees Celsius) appeared around the eye. NASA research has shown that storms with cloud top temperatures that cold can produce heavy rain, and that heavy rain was seen in the GPM image taken on Oct. 28.  The image was created at NASA’s Jet Propulsion Laboratory in Pasadena, California.

Hurricanes are the most powerful weather event on Earth. NASA’s expertise in space and scientific exploration contributes to essential services provided to the American people by other federal agencies, such as hurricane weather forecasting.

Both the Japan Aerospace Exploration Agency, JAXA and NASA manage GPM.

By Rob Gutro
NASA’s Goddard Space Flight Center

Pablo – North Atlantic Ocean

Oct. 28, 2019 – NASA Tracking Eastern Atlantic’s Late Season Tropical Storm Pablo

Pablo is a tropical cyclone that formed late on Oct. 25 and strengthened into a hurricane for a short time before weakening again into a tropical storm. NASA’s Aqua and Terra satellites provided imagery that covered that fast transition. Pablo’s formation was also interesting because it formed within a larger system.

Terra image of Pablo
When NASA’s Terra satellite passed over the eastern Atlantic Ocean on Oct. 28, it found Tropical Storm Pablo to the west of Ireland. Pablo’s center of circulation can be seen within the larger low-pressure area. Credit: NASA Worldview

On Oct. 25, the National Hurricane Center or NHC noted that a tropical cyclone has formed within a larger extratropical cyclone in the northeastern Atlantic. This is not unique and has occurred several times in the past, primarily during the latter part of the hurricane season. Pablo formed as a very small-scale tropical cyclone, but had a well-defined but small circulation with 40 knots winds embedded within the larger low-pressure area.

By 5 p.m. EDT on Oct. 25, Tropical Storm Pablo formed about 325 miles west-southwest of the Azores islands.

On Oct. 27, NASA’s Aqua satellite found Pablo had strengthened into a hurricane. NASA’s Aqua satellite passed over Hurricane Pablo on Sunday, Oct. 27 at 9:55 a.m. EDT (1355 UTC) and captured a visible image of the compact storm that showed the storm had a clear eye. Pablo was a small tropical cyclone with hurricane-force winds extending outward up to 10 miles (20 km) from the center and tropical-storm-force winds extending outward up to 80 miles (130 km).

Aqua image of Pablo
NASA’s Aqua satellite passed over Hurricane Pablo on Sunday, Oct. 27 at 9:55 a.m. EDT (1355 UTC) and captured a visible image of the compact storm that showed the storm had a clear eye. Pablo was a small tropical cyclone, with hurricane-force winds extending outward up to 10 miles (20 km) from the center. Credit: NASA/NRL

At 11 a.m. EDT (1500 UTC) on Oct. 27, the center of Hurricane Pablo was located near latitude 42.8 degrees north and longitude 18.3 degrees west. Maximum sustained winds had increased to near 75 mph (120 kph) with higher gusts. The estimated minimum central pressure is 983 millibars.

On Oct. 28 at 5 a.m. EDT (0900 UTC), the center of Tropical Storm Pablo was located near latitude 46.6 degrees north and longitude 17.5 degrees west. That is about 725 miles (1,165 km) northeast of Lajes Air Base in the Azores. Pablo was moving toward the north near 5 mph (7 kph).  Maximum sustained winds were near 50 mph (85 kph) with higher gusts.

When NASA’s Terra satellite passed over the eastern Atlantic Ocean on Oct. 28, the Moderate Resolution Imaging Spectroradiometer found Tropical Storm Pablo to the west of Ireland. Pablo’s center of circulation was visible as a circular area of clouds within the larger low-pressure area. Satellite imagery revealed that thunderstorm development within the storm decreased significantly in both coverage and vertical depth during the morning of Oct. 28, and the system barely met the criterion to be classified as a tropical cyclone. The remaining thunderstorm development and convection (rising air that forms the thunderstorms that make up a tropical cyclone) that does remain is limited to the southeastern quadrant.

Slow weakening is expected during the next 24 hours, and the NHC forecast notes that Pablo should transition to a post-tropical cyclone later on Oct. 28 and dissipate on Tuesday, Oct. 29.

Hurricanes are the most powerful weather event on Earth. NASA’s expertise in space and scientific exploration contributes to essential services provided to the American people by other federal agencies, such as hurricane weather forecasting.

For updated forecasts. Visit: www.nhc.noaa.gov

By Rob Gutro 
NASA’s Goddard Space Flight Center