Idai (Southern Indian Ocean)

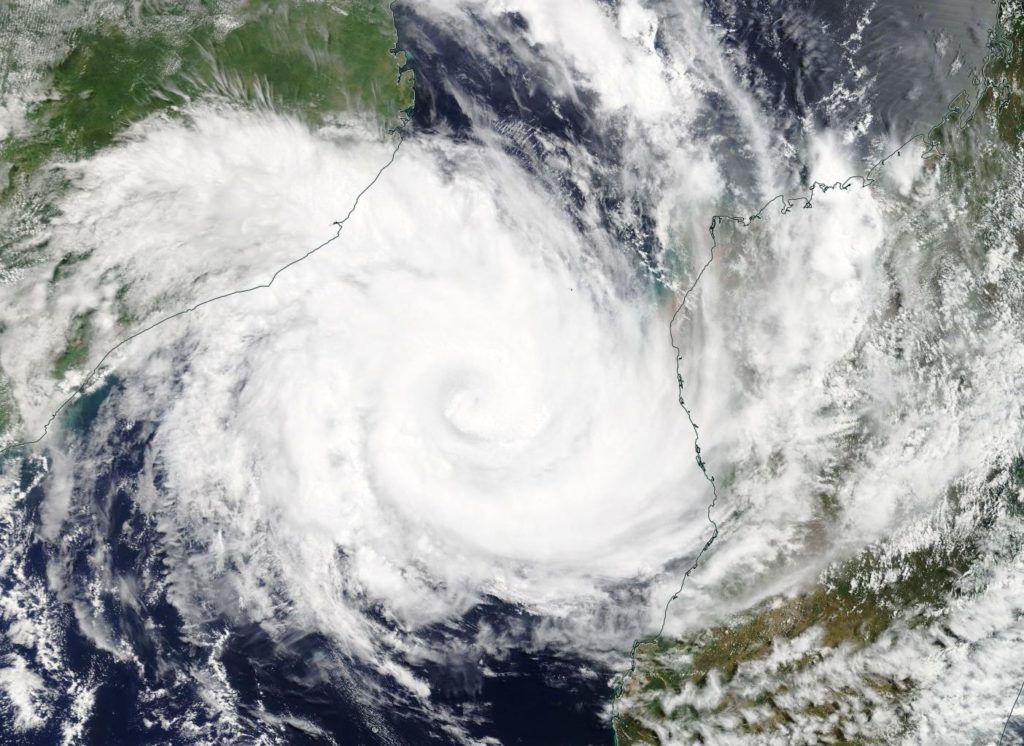
Mar. 13, 2019 – NASA Infrared Imagery Reveals Powerful Tropical Cyclone Idai at Mozambique’s Coast

NASA’s Terra satellite captured an infrared image of Tropical Cyclone Idai approaching the coast of Mozambique. The infrared data provided cloud top temperatures that indicated powerful thunderstorms circled Idai’s center.

Terra image of Idai
At 4 a.m. EDT (0800 UTC) on Oct. 3, the MODIS instrument that flies aboard NASA’s Terra satellite gathered infrared data on Tropical Cyclone Idai. Strongest thunderstorms circled the center where cloud top temperatures were as cold as minus 70 degrees Fahrenheit (minus 56.6 Celsius) and appeared in red. Credit: NASA/NRL

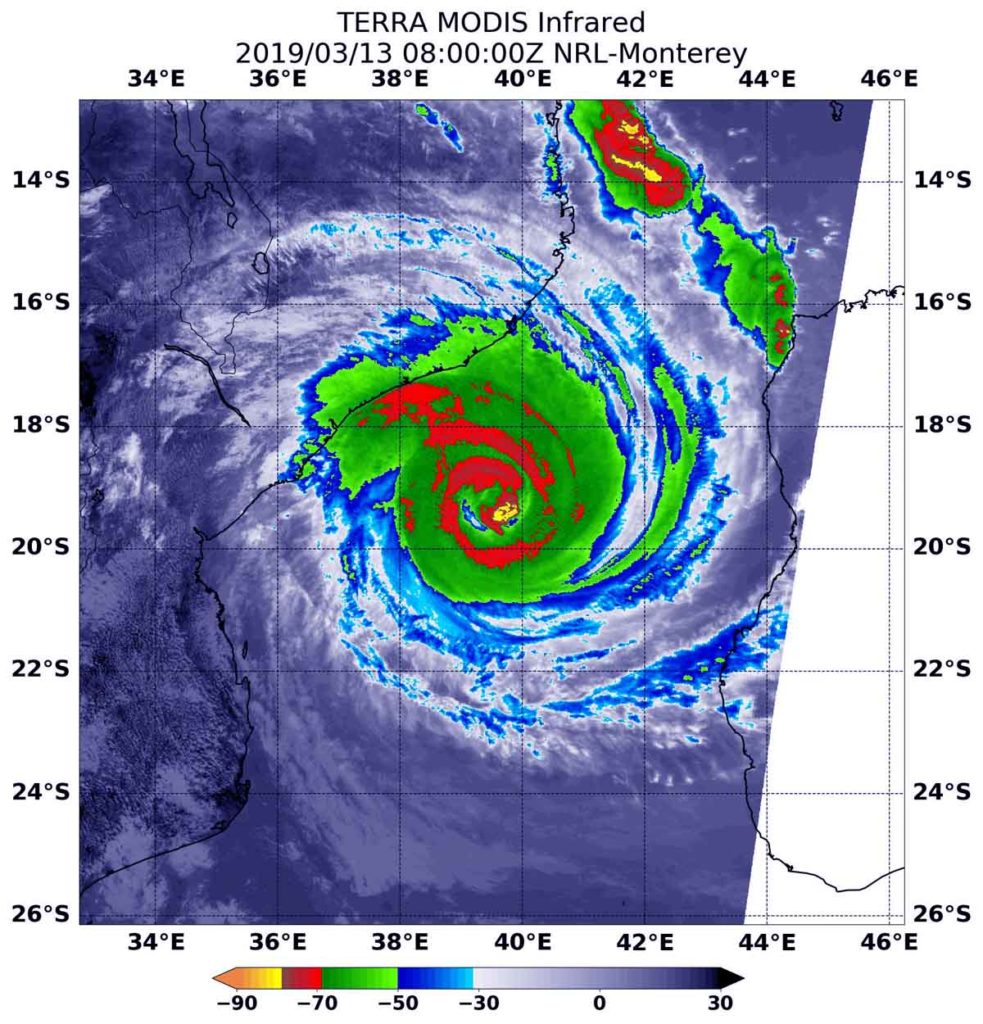
At 4 a.m. EDT (0800 UTC) on March 13 the Moderate Resolution Imaging Spectroradiometer or MODIS instrument that flies aboard NASA’s Terra satellite gathered infrared data on Idai. Infrared data provides temperature information. Strongest thunderstorms circled Idai’s center and contained cloud top temperatures as cold as minus 70 degrees Fahrenheit (minus 56.6 Celsius). NASA research has shown that cloud tops with temperatures that cold were high in the troposphere and have the ability to generate heavy rain.

MODIS infrared imagery also indicated Idai’s eye is about 20 nautical miles wide in diameter, although it was covered by high clouds.

At 11 a.m. EDT (1500 UTC), Idai’s center was located near latitude 19.5 degrees south and longitude 38.7 degrees east. That’s about 175 nautical miles north-northwest of Europa Island. Idai was moving to the west. Maximum sustained winds were near 103.6 mph (90 knots/166.7 kph) with higher gusts.

On March 13, the Mozambique National Meteorology Institute (INAM) noted that Idai is causing very heavy rains of more than 100 millimeters (4 inches) in 24 hours over the Mozambique Channel.

Idai is forecast to make landfall just north of Biera, Mozambique between March 14 at 1200 UTC and March 15 at 0000 UTC (on March 14 between 8 a.m. to 8 p.m. EDT). Beira is the fourth largest city in the country and is located in the Sofala Province, central region of the country. Heavy rains, thunderstorms and hurricane-force winds are expected as Idai comes ashore.

For the latest advisory from the Mozambique National Meteorology Institute (INAM), visit: http://www.inam.gov.mz/index.php/pt/novo-sistema

By Rob Gutro
NASA’s Goddard Space Flight Center

Idai (Southern Indian Ocean)

Mar. 12, 2019 – Tropical Cyclone Idai Seen in Mozambique Channel by NASA’s Terra Satellite

NASA’s Terra satellite passed over the Southern Indian Ocean and caught a visible image of Tropical Cyclone Idai in the Mozambique Channel. The channel is located between the country of Mozambique on the African mainland and the island nation of Madagascar.

Terra image of Idai
On March 12 NASA’s Terra satellite captured a visible image of Tropical Cyclone Idai in the Mozambique Channel of the Southern Indian Ocean. Idai was located between Mozambique (left) and Madagascar (right). Credit: NASA Worldview, Earth Observing System Data and Information System (EOSDIS)

On March 12 the Moderate Resolution Imaging Spectroradiometer or MODIS instrument aboard NASA’s Terra satellite provided a visible image of Tropical Cyclone Idai. Satellite imagery showed Idai maintained a well-defined eye, although still obscured by high clouds. Idai appeared to be almost directly between Mozambique and Madagascar. Both countries have advisories in effect on March 12.

At 5 a.m. EDT (0900 UTC) the center of Idai was located near latitude 17.7 degrees south and longitude 42.5 degrees east. That’s about 253 nautical miles north-northeast of Europa Island. Idai was moving to the southwest. Maximum sustained winds were near 90 knots (103.6 mph/166.7 kph).

The Joint Typhoon Warning Center forecast calls for Idai to re-intensify as it moves southwest, peaking at 100 knots (115 mph/185 kph) before making landfall near Beira, Mozambique after 3 days.

For advisories from the Mozambique National Meteorological Institute (in Portuguese), visit: http://www.inam.gov.mz/index.php/pt/novo-sistema

By Rob Gutro
NASA’s Goddard Space Flight Center

Idai (Southern Indian Ocean)

Mar. 11, 2019 – NASA’s Aqua Satellite Finds Tropical Cyclone Idai in Mozambique Channel

Visible imagery from NASA’s Aqua satellite revealed the center of Tropical Cyclone Idai in the Mozambique Channel.

Aqua image of Idai
On March 11, 2019, the MODIS instrument aboard NASA’s Aqua satellite captured a visible light image of Tropical Cyclone Idai in the Mozambique Channel, Southern Indian Ocean. Mozambique is located (left) on the African mainland and Madagascar (right) is the island nation. Credit: NASA Worldview, Earth Observing System Data and Information System (EOSDIS)

The Mozambique Channel is the body of water in the Southern Indian Ocean that flows between Mozambique on the African mainland and the island nation of Madagascar.

Tropical Cyclone Idai developed on March 9 around 4 a.m. EST (0900 UTC). It developed from the low pressure area designated System 98S. When it strengthened into a depression, it was renamed Tropical Cyclone 18S. After strengthening into a tropical storm on March 10, it was renamed Idai.

On March 11, 2019, the Moderate Resolution Imaging Spectroradiometer or MODIS instrument aboard NASA’s Aqua satellite captured a visible image of Tropical Cyclone Idai. Bands of powerful thunderstorms were wrapping around an eye obscured by high clouds. The eye appears to be about 17 nautical-miles wide. At the time of the image, west-central Mozambique was being affected by the eastern quadrant of this powerful storm.

On Monday, March 11, 2019 at 11 a.m. EDT (1500 UTC), Idai was located near 17.6 degrees south latitude and 42.6 degrees east longitude. That’s about 307 miles north-northeast of Europa Island. Idai was moving to the southwest and had maximum sustained winds 105 knots (121 mph/194.5 kph). It was generating maximum wave heights near 27 feet (8.2 meters).

The Joint Typhoon Warning Center expects Idai to intensify further as it moves west. Idai’s sustained winds are expected to peak at a Category 4 hurricane strength (on the Saffir-Simpson hurricane wind scale) with 125 knots (144 mph/231.5 kph) before making landfall near Beira, Mozambique after March 15.

By Rob Gutro
NASA’s Goddard Space Flight Center

Haleh (Southern Indian Ocean)

Mar. 08, 2019 – NASA Finds Wind Shear Adversely Affecting Haleh

Visible imagery from NASA’s Terra satellite revealed northerly wind shear affecting Tropical Cyclone Haleh and continuing to weaken the storm.

Terra image of Haleh
At 1:05 a.m. EDT (0505 UTC) on Sept. 28, the MODIS instrument aboard NASA’s Terra satellite provided a visible image of Typhoon Haleh that revealed a clear eye and a powerful storm. Credit: NASA Worldview, Earth Observing System Data and Information System (EOSDIS)

On March 9 the Moderate Resolution Imaging Spectroradiometer or MODIS instrument aboard NASA’s Terra satellite provided a visible image of Haleh in the Southern Indian Ocean. The image showed the northeastern quadrant surrounded by wispy clouds, while the bulk of clouds and showers were pushed south and southwest of the center of circulation. Haleh also had a thick band of thunderstorms wrapping into the southern quadrant from the southeast.

On March 9 at 10 a.m. EST (1500 UTC) the Joint Typhoon Warning Center or JTWC noted that Haleh’s maximum sustained winds dropped to near 40 knots (46 mph/74 kph). It was centered near 32.9 degrees south latitude and 65.5 degrees east longitude. That’s 852 nautical miles south-southeast of Port Louis, Mauritius. Haleh was moving north-northwest and is forecast to turn to the north-northeast.

JTWC has forecast Haleh to weaken below the threshold of a tropical cyclone on March 9.

By Rob Gutro
NASA’s Goddard Space Flight Center

Haleh (Southern Indian Ocean)

Mar. 07, 2019 – Tropical Cyclone Haleh Weakening in NASA-NOAA Satellite Imagery

Tropical Cyclone Haleh continues to weaken while being battered by outside winds. NASA-NOAA’s Suomi NPP satellite passed over the Southern Indian Ocean and captured an image the elongated storm.

Suomi NPP image of Haleh
On March 7, 2019, the VIIRS instrument aboard NASA-NOAA’s Suomi NPP satellite captured a visible image of Haleh in the Southern Indian Ocean. Credit: NASA Worldview, Earth Observing System Data and Information System (EOSDIS)

Wind shear and cooler waters continue to weaken Haleh is it moves on a southerly course. The storm has fallen below the hurricane threshold and is now a tropical storm. On March 7, the Visible Infrared Imaging Radiometer Suite (VIIRS) instrument aboard the Suomi NPP satellite showed Haleh appeared elongated from the outside winds.

In general, wind shear is a measure of how the speed and direction of winds change with altitude. In order to understand how it affects a tropical cyclone or hurricane, think of a tropical cyclone as a vertical rotating cylinder. The different levels of rotating winds in the center of tropical cyclones need to be stacked on top each other for the storm to strengthen. If there are outside winds pushing against the cylinder near the top, it affects the balance of the entire cylinder and that’s what happens when vertical wind shear pushes against a storm. It pushes the center and weakens (or wobbles) the rotation of the entire cylinder (storm) and stretches the storm out.

The Joint Typhoon Warning Center or JTWC reported “animated multispectral satellite imagery depicts a 130 nautical-mile cirrus cloud [high clouds] shield [layer] with isolated deep convection [strong storms] that is obscuring the low level circulation center. Low level rain bands are visible beyond the cirrus shield in all quadrants.”

At 10 a.m. EDT (1500 UTC) on March 7, JTWC noted that the center of Tropical Cyclone Haleh was located near latitude 27.7 degrees north and longitude 67.0 degrees east. That’s about 691 miles northeast of Port Louis, Mauritius. Maximum sustained winds have decreased to 69 mph (60 knots/111 kph).

The storm is forecast to become extra-tropical by March 8. When a storm becomes extra-tropical, it means that a tropical cyclone has lost its “tropical” characteristics. NOAA’s National Hurricane Center defines “extra-tropical” as a transition that implies both poleward displacement (meaning it moves toward the north or south pole) of the cyclone and the conversion of the cyclone’s primary energy source from the release of latent heat of condensation to baroclinic (the temperature contrast between warm and cold air masses) processes. It is important to note that cyclones can become extratropical and still retain winds of hurricane or tropical storm force.

By Rob Gutro
NASA’s Goddard Space Flight Center

Haleh (Southern Indian Ocean)

Mar. 06, 2019 – NASA Sees Tropical Cyclone Haleh Weakening

Tropical Cyclone Haleh continued to move in a southerly direction in the Southern Indian Ocean when NASA-NOAA’s Suomi NPP satellite passed overhead.

Suomi NPP image of Haleh
NASA-NOAA’s Suomi NPP satellite passed over the Southern Indian Ocean and captured a visible image of Tropical Cyclone Haleh on March 6. Credit: NASA Worldview, Earth Observing System Data and Information System (EOSDIS).

Suomi NPP passed over Haleh on March 6 and the Visible Infrared Imaging Radiometer Suite (VIIRS) instrument provided a visible image of the storm. The VIIRS image showed a large area of thunderstorms wrapping into the center and the storm appeared to be elongating toward the southeast. The elongation of the storm is a result of outside winds, or moderate to strong vertical wind shear, and is indicative of weakening.

On March 6 at 10 a.m. EDT (1500 UTC) Haleh was located at 23.9 degrees south and 68.7 degrees east.  That’s about 690 nautical miles east-southeast of Port Louis, Mauritius, has tracked southwestward. Maximum sustained winds had decreased to 75 knots (86 mph/139 kph).

Haleh is forecast to transition into an extra-tropical storm in two days and continue weakening.

By Rob Gutro 
NASA’s Goddard Space Flight Center

Haleh (Southern Indian Ocean)

Mar. 05, 2019 – NASA’s Infrared Vision Reveals Tropical Cyclone Haleh’s Power

Tropical Cyclone Haleh maintained an eye as NASA’s Aqua satellite passed overhead and collected temperature information on the storm and the ocean waters it was moving through.

Aqua image of Haleh
NASA’s Aqua satellite provided an infrared picture of Tropical Cyclone Haleh’s cloud top temperatures on March 4 at 4:11 a.m. EDT (0911 UTC). Coldest cloud top temperatures indicated strongest storms (purple) that had potential for heavy rainfall. Haleh was moving through warm sea surface temperatures (orange) near 300 Kelvin (80 degrees Fahrenheit//26.8 degrees Celsius) Credit: NASA JPL, Heidar Thrastarson

Haleh developed as a tropical storm in the Southern Indian Ocean on March 2, about 337 nautical miles south-southeast of Diego Garcia. Haleh continued to intensify as it moved in a southerly direction and reached hurricane-force on March 3.

The Atmospheric Infrared Sounder or AIRS instrument aboard NASA’s Aqua satellite passed over Tropical Storm Cyclone Haleh on March 4 at 4:11 a.m. EDT (0911 UTC) and analyzed the storm in infrared light. Infrared light provides temperature data and that’s important when trying to understand how strong storms can be. The higher the cloud tops, the colder and the stronger they are.

When Aqua passed over Haleh, the AIRS instrument found coldest cloud top temperatures in thunderstorms around the eye of the storm, where temperatures were as cold as minus 63 degrees Fahrenheit (minus 53 degrees Celsius). Storms with cloud top temperatures that cold have the capability to produce heavy rainfall.

At 11 a.m. EDT (1500 UTC) on March, 5, 2019, the Joint Typhoon Warning Center or JTWC noted the center of Tropical Cyclone Haleh was located near 21.1 degrees south latitude and 71.7 degrees east longitude. That’s 920 miles east of St Denis, La Reunion Island. Haleh was moving toward the southwest. Maximum sustained winds are near 109 mph (95 knots/176 kph) with higher gusts. Some weakening is forecast to continue and the storm is expected to become extra-tropical in 5 days.

By Rob Gutro
NASA’s Goddard Space Flight Center

Pola (Southern Pacific Ocean)

Feb. 28, 2019 – NASA Finds a Hint of an Eye in Tropical Cyclone Pola

Visible imagery from NASA’s Aqua satellite revealed the hint of an eye developing in the center of Tropical Cyclone Pola. Warnings in the Southern Pacific Ocean have been posted for Tonga.

Aqua image of Pola
On Feb. 28, 2019 at 0125 UTC (Feb. 27 at 8:25 p.m. EDT) the MODIS instrument aboard NASA’s Aqua satellite captured a visible light image of Tropical Cyclone Pola in the South Pacific. The image showed the hint of an eye. Credit: NASA/NRL

he Polynesian kingdom of Tonga consists of more than 170 South Pacific islands, many uninhabited. Forecasts are managed by the Tonga Meteorological Service or TMS.

On February 28, the TMS noted that a tropical cyclone warning is in force for Tonga, with a hurricane force winds warning for Tele-Ki-Tonga and Tele-Ki-Tokelau coastal waters. A strong wind warning remains inforce for Tongatapu and ‘eua land areas and coastal waters. A heavy damaging swell remains inforce for Ha’apai, Tongatapu, ‘eua, Tele-ki-tonga and Tele-ki-tokelau coastal waters.

On Feb. 28, 2019 at 0125 UTC (Feb. 27 at 8:25 p.m. EDT) the Moderate Resolution Imaging Spectroradiometer or MODIS instrument aboard NASA’s Aqua satellite captured a visible image of Tropical Cyclone Pola. The visible imagery provided a hint that an eye was developing. Animated enhanced infrared satellite imagery confirmed that the compact system has developed a 5 nautical-mile wide eye. In addition, microwave imagery indicated tightly-curved banding of thunderstorms were wrapping into the eye.

At 10 a.m. EDT (1500 UTC) on Feb. 28, Pola’s maximum sustained winds had peaked near 90 knots (103 mph/166 kph). The Joint Typhoon Warning Center or JTWC expects the storm will start weakening. Pola was centered near 24.9 degrees south latitude and 178.2 degrees west longitude. Tropical cyclone Pola is located approximately 423 nautical miles south-southeast of Suva, Fiji, and has tracked southward.

The Joint Typhoon Warning Center expects Pola to continue to move south and later transitioning into an extra-tropical storm.

For updated forecasts from the Tonga Meteorological Service, visit: http://www.met.gov.to/

By Rob Gutro
NASA’s Goddard Space Flight Center

Wutip (Northwestern Pacific Ocean)

Feb. 28, 2019 – Wutip Now a Depression, Spotted on NASA-NOAA Satellite Imagery

Once a super typhoon, Tropical Cyclone Wutip weakened to a depression on February 28. NASA-NOAA’s Suomi NPP satellite passed over the Northwestern Pacific Ocean and captured an image the wispy looking-storm being battered by vertical wind shear.

Suomi NPP image of Wutip
On Feb. 28, 2019, the VIIRS instrument aboard NASA-NOAA’s Suomi NPP satellite captured a visible image of Wutip, now a depression in the Northwestern Pacific Ocean. Credit: NASA Worldview, Earth Observing System Data and Information System (EOSDIS)

In general, wind shear is a measure of how the speed and direction of winds change with altitude. Wind shear can tear a tropical cyclone apart or weaken it.

Wind shear and cooler waters knocked the wind out of Wutip and weakened the storm rapidly. On Feb 28, the Visible Infrared Imaging Radiometer Suite (VIIRS) instrument aboard the Suomi NPP satellite showed that Wutip still had a defined center, although elongated from the outside winds. Bands of clouds wrapping around the center appeared to be wispy and devoid of heavy rain.

At 10 a.m. EDT (1500 UTC) on Feb. 28 (1 a.m. CHST local time, March 1) the National Weather Service in Tiyan, Guam noted that the center of Tropical Depression Wutip was located near Latitude 18.3 degrees North and Longitude 134.6 degrees East. That’s about 755 miles west-northwest of Guam and about 765 miles west-northwest of Saipan.

Wutip was moving northwest at 10 mph. It is expected to make a turn toward the west with a decrease in forward speed over the next 24 hours. Maximum sustained winds have decreased to 30 mph and is forecast to dissipate sometime on Saturday, March 1, EDT.

For updated and local forecasts, visit: https://www.prh.noaa.gov/guam/

By Rob Gutro
NASA’s Goddard Space Flight Center

Pola (Southern Pacific Ocean)

Feb. 27, 2019 – NASA Catches Tropical Cyclone Pola Near Fiji

Tropical Cyclone Pola was passing near the Southern Pacific country of Fiji when NASA’s Aqua satellite analyzed the storm in infrared light and found it strengthening.

Aqua image of Pola
On Feb. 27 at 8:11 p.m. EDT (1311 UTC) the AIRS instrument aboard NASA’s Aqua satellite analyzed cloud top temperatures of Tropical Cyclone Pola in infrared light. AIRS found cloud top temperatures of strongest thunderstorms were as cold as or colder than minus 63 degrees Fahrenheit (minus 53 degrees Celsius). Credit: NASA JPL/Heidar Thrastarson

On Feb. 27 at 8:11 p.m. EDT (1311 UTC) the Atmospheric Infrared Sounder or AIRS instrument aboard NASA’s Aqua satellite analyzed cloud top temperatures of Tropical Cyclone Pola in infrared light. AIRS found cloud top temperatures were getting colder. Colder cloud tops mean the uplift of air in the storm is strengthening and pushing the cloud tops higher. It’s an indication of a strengthening storm.

Strongest thunderstorms as cold as or colder than minus 63 degrees Fahrenheit (minus 53 degrees Celsius) circling the center. Enhanced infrared satellite imagery shows deep and persistent convection continues to wrap around the low level circulation center. Cloud top temperatures that cold indicate strong storms that have the capability to create heavy rain. Microwave imagery revealed a partial eye developing.

On Feb. 21 at 10 a.m. EST (1500 UTC), the center of Tropical Cyclone Pola was located near latitude 21.0 degrees south and longitude 178.0 degrees west. That puts the center of Pola between Fiji and Tonga and about 258 nautical miles southeast of Suva, Fiji. Pola was moving to the south-southwest. Maximum sustained winds were near 75 knots (86 mph/139 kph).  The Joint Typhoon Warning Center expects Pola to strengthen in the next day before slow weakening begins.

By Rob Gutro
NASA’s Goddard Space Flight Center