May 17, 2020 – NASA Finds Vongfong a Depression, Last Advisory Issued
NASA-NOAA’s Suomi NPP satellite provided a look at the cloud top temperatures of Vongfong, once a typhoon, now weakened to a tropical depression and expected to dissipate by May 17.
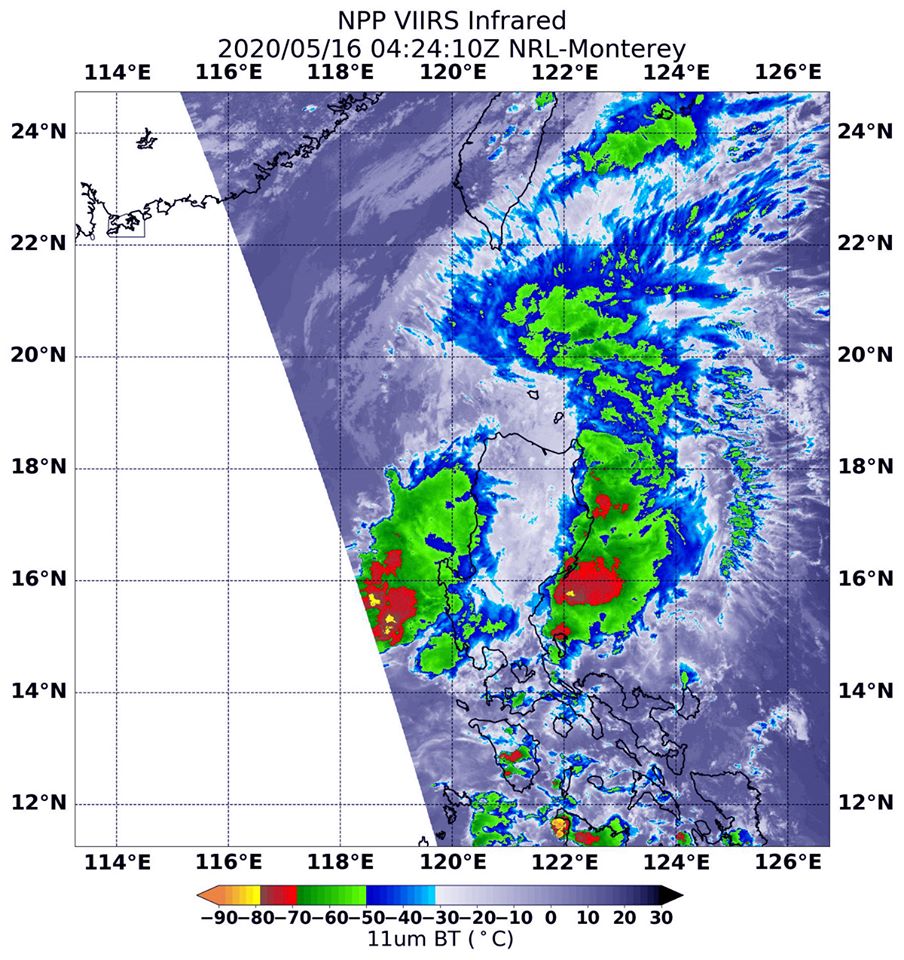
At 5 a.m. EDT (0900 UTC) on Saturday, May 16, the Joint Typhoon Warning Center or JTWC issued the final advisory on Tropical Depression Vongfong. At that time, Tropical Depression Vongfong (Philippines designation Ambo) was located near latitude 19.3 degrees north and longitude 120.5 degrees east, about 101 miles north of Vigan, Philippines. Vongfong was moving northeast. Maximum sustained winds dropped to 25 knots (28.7 mph)
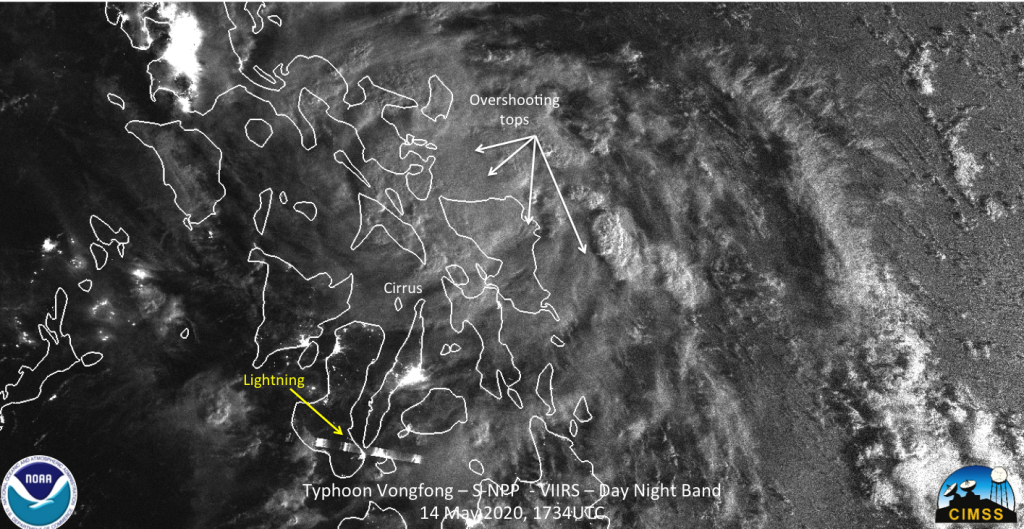
The Visible Infrared Imaging Radiometer Suite (VIIRS) instrument aboard NASA-NOAA’s Suomi NPP satellite provided an infrared image that showed the strongest storms associated with the depression were located offshore, northeast and northwest of Luzon. In those strongest storms, cloud top temperatures were as cold as minus 70 degrees Fahrenheit. Those storms were generating heavy rain.
On May 16, Philippines warnings were still in effect. They included Tropical cyclone wind signal number 2 for Luzon: Ilocos Norte. In addition, Tropical cyclone wind signal number 1 was in effect for these areas in Luzon: Apayao, Abra, Ilocos Sur, La Union, Batanes, Babuyan Islands, and the northwestern portion of Cagayan.
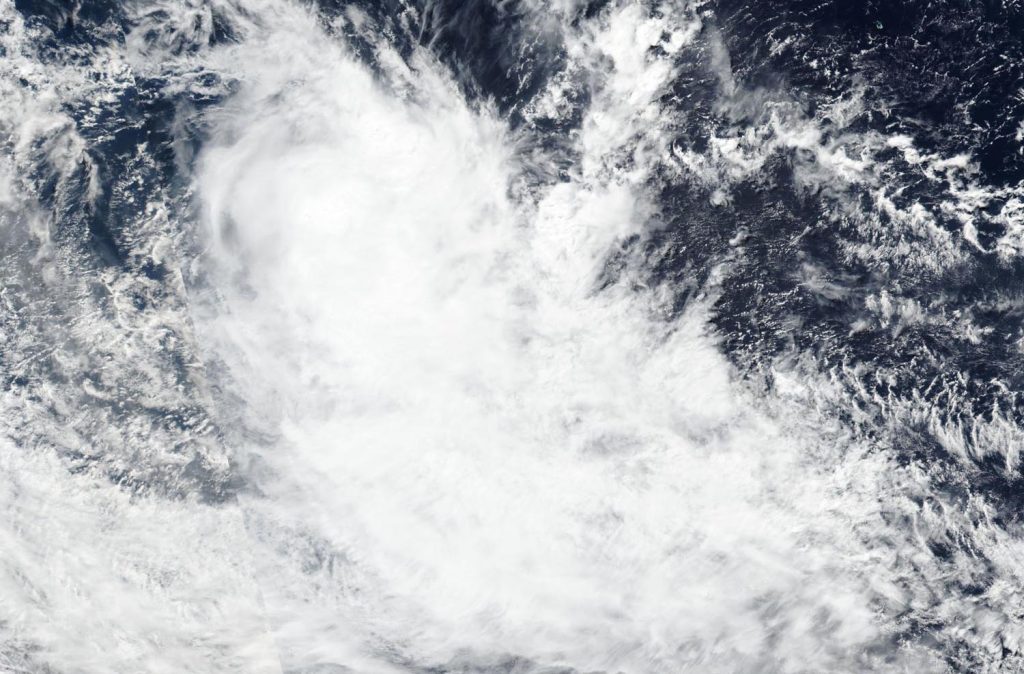
Vongfong’s center had emerged over water west of Luzon and was dissipating.
By Rob Gutro
NASA’s Goddard Space Flight Center
May 16, 2020 – NASA’s IMERG Measures Typhoon Vongfong’s Rainfall
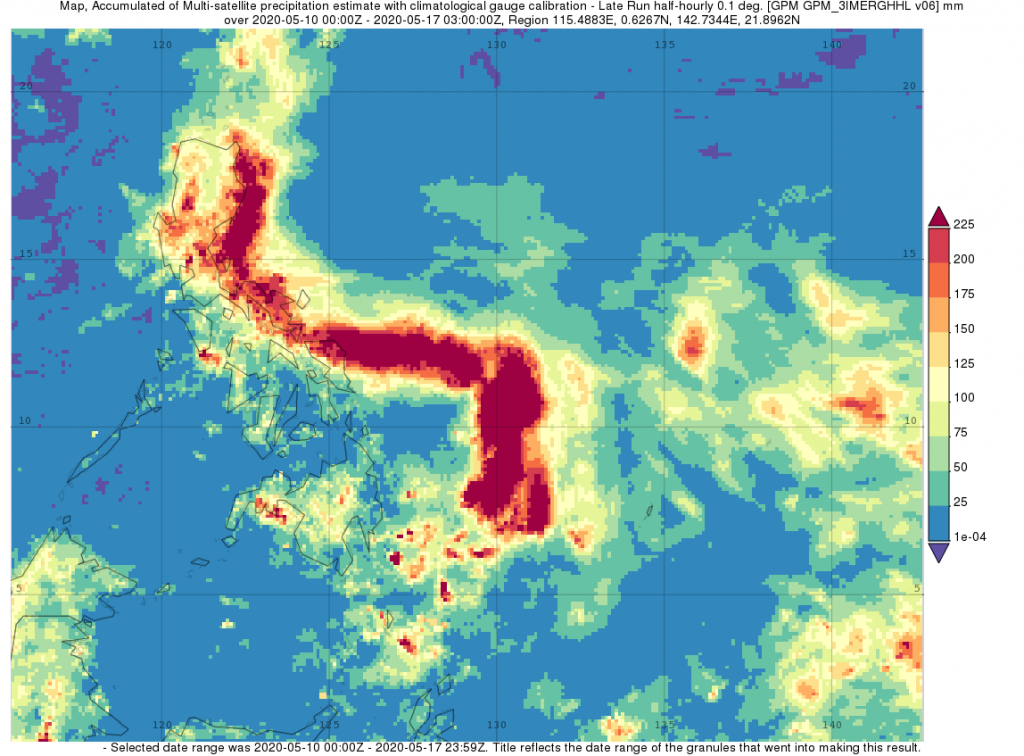
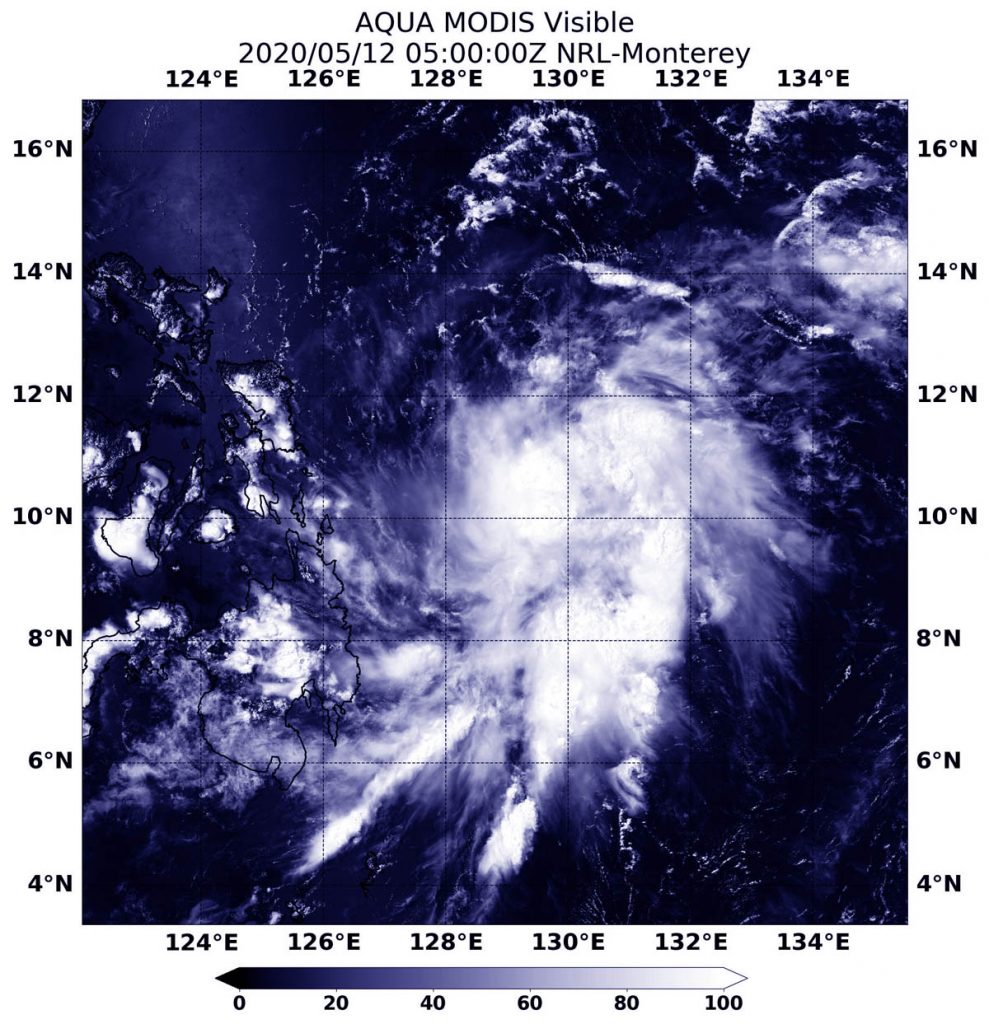
The first typhoon of the season, Vongfong, struck the central Philippines this past week (where it is known as Ambo) as a strong category 2 storm, bringing strong winds and locally heavy rainfall. NASA’s IMERG calculated locally heavy rainfall on the order of 200 mm (~8 inches) or more to the northern half of Samar where it made landfall as well as to southern, far eastern and isolated parts of central Luzon. For the full story: https://gpm.nasa.gov/articles/typhoon-vongfong-hits-philippines
By Steve Lang
NASA Goddard Space Flight Center
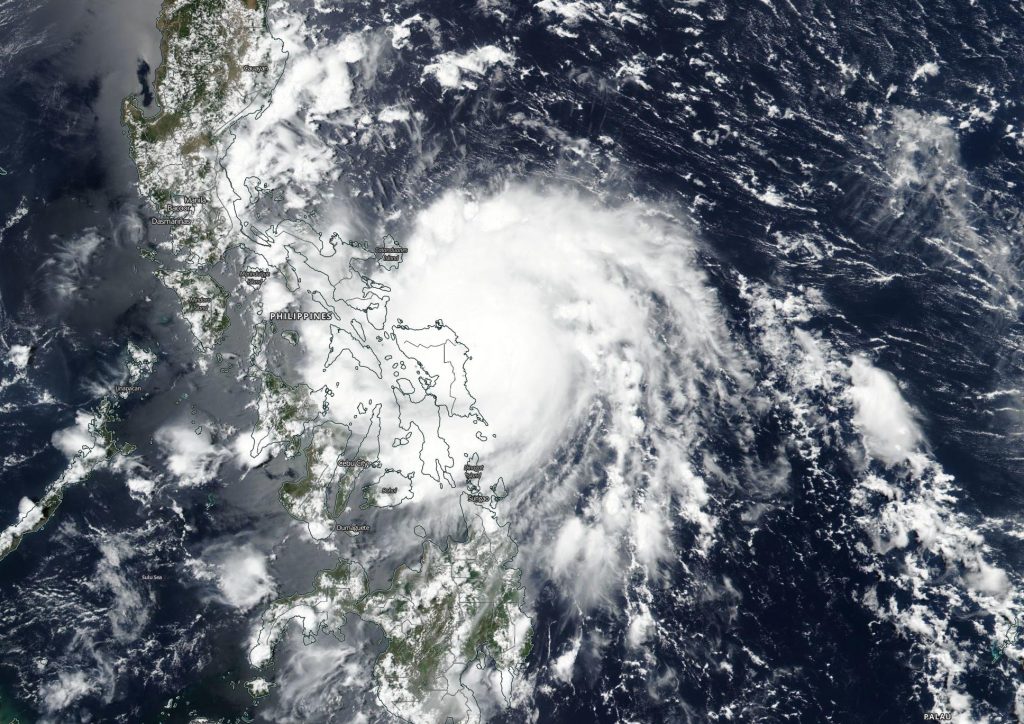
May 15, 2020 – Look Back: Vongfong Makes Landfall in the Philippines
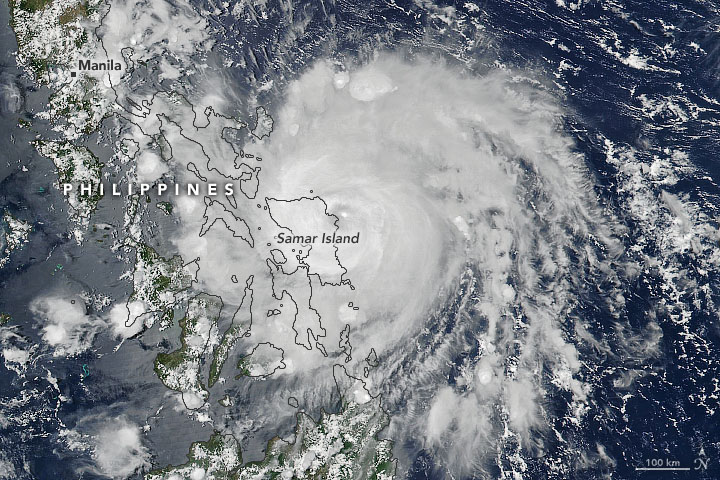
The first tropical storm in the Western Pacific Ocean in 2020 did not form until May 12. By May 14, it was making landfall in the Philippines with fierce winds and heavy rainfall. Civil authorities worked to evacuate tens to hundreds of thousands of people from coastal and mountainous areas prone to flooding and landslides. For the entire story: https://earthobservatory.nasa.gov/images/146719/vongfong-makes-landfall-in-the-philippines/?src=eoa-iotd
By NASA Earth Observatory–image by Joshua Stevens, using VIIRS data from NASA EOSDIS/LANCE and GIBS/Worldview and the Suomi National Polar-orbiting Partnership. Story by Michael Carlowicz.