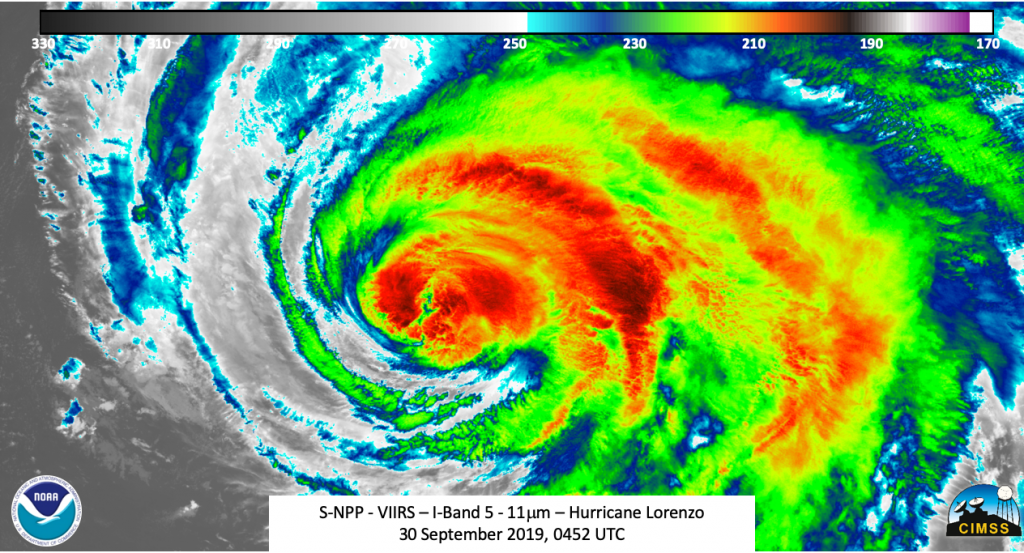
Oct. 02, 2019 – NASA Examines Extra-tropical Large Lorenzo’s Rainfall
Lorenzo is still at hurricane force in the eastern North Atlantic has now transitioned to an extra-tropical cyclone and has grown in size. The Global Precipitation Measurement mission or GPM core satellite provided a look at the rainfall occurring within this strong system. The Portuguese Institute for the Sea and the Atmosphere has discontinued all warnings for the Azores, and now Ireland and the United Kingdom are on watch for Lorenzo’s approach.
NASA Looks at Lorenzo’s Rainfall, Extra-Tropical Transition

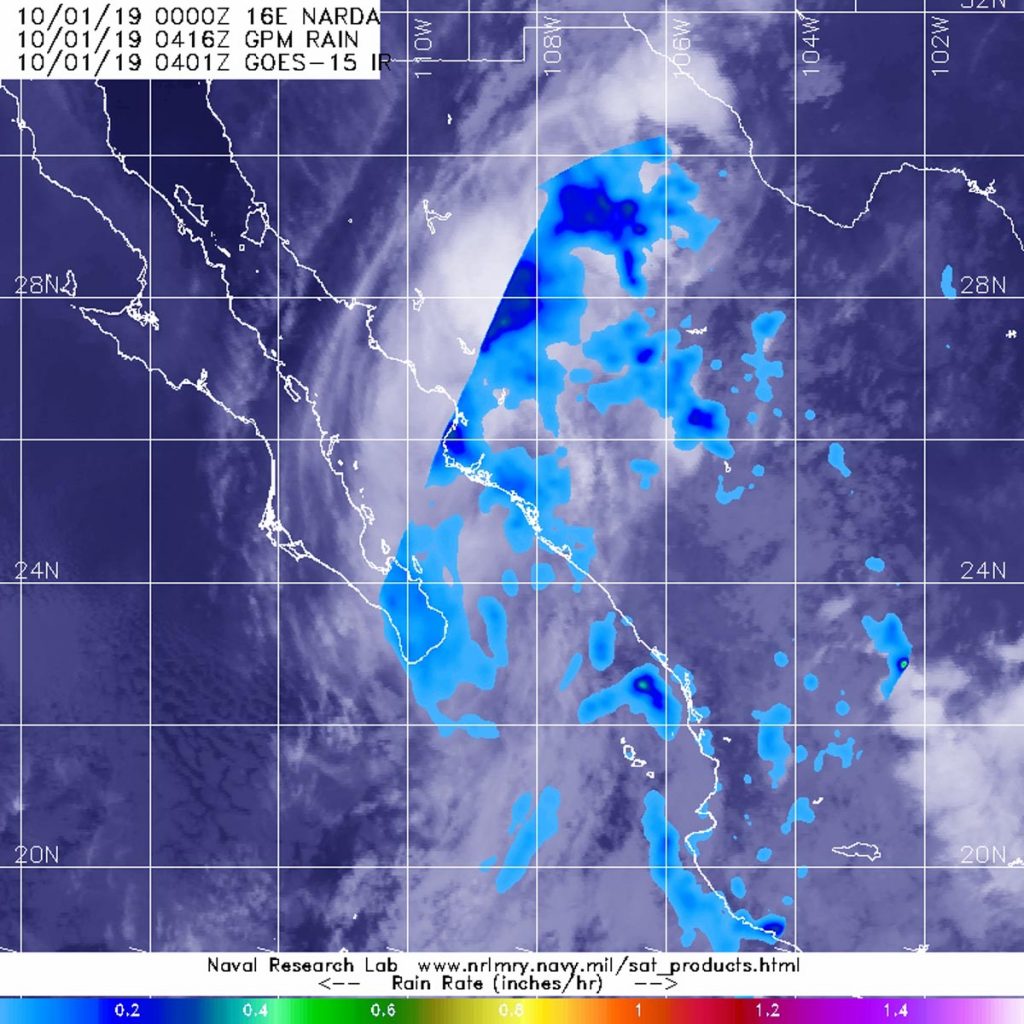
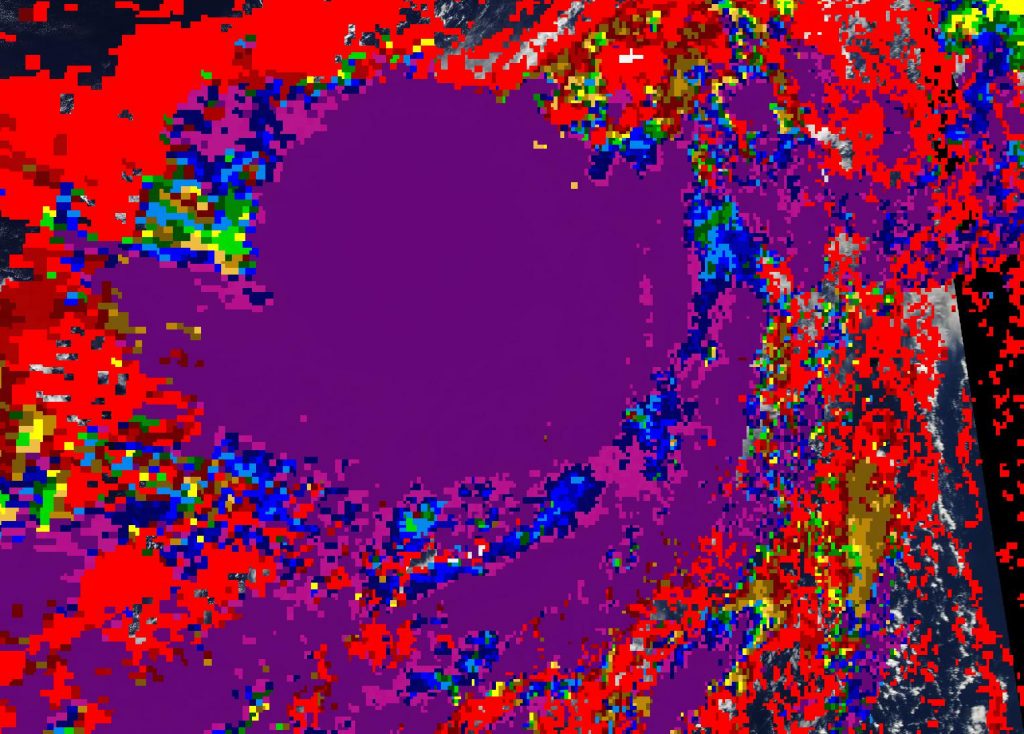
The GPM’s core satellite passed over Lorenzo on Oct. 2 at 4:31 a.m. EDT (0831 UTC). GPM found the heaviest rainfall occurring north of the center, where it was falling at a rate of more than 1 inch (25 mm) per hour. Scattered light rain falling at less than 0.2 inches (less than 5 millimeters) per hour circled the rest of the storm. Forecasters at NOAA’s National Hurricane Center or NHC incorporate the NASA rainfall data into their forecasts.
Satellite data showed that Lorenzo had become extra-tropical. That means that a tropical cyclone has lost its “tropical” characteristics. NHC defines “extra-tropical” as a transition that implies both poleward displacement (meaning it moves toward the north or south pole) of the cyclone and the conversion of the cyclone’s primary energy source from the release of latent heat of condensation to baroclinic (the temperature contrast between warm and cold air masses) processes. It is important to note that cyclones that become extratropical can still retain winds of hurricane or tropical storm force.
Status of Lorenzo on Oct. 2
At 11 a.m. EDT (1500 UTC) on Oct. 2, NHC issued its last public advisory on this system. The center of Post-Tropical Cyclone Lorenzo was located near latitude 44.4 degrees north and longitude 25.8 degrees west. That is about 945 miles (1,525 km) west-southwest of Cork, Ireland, and about 970 miles (1,565 km) west-southwest of Galway, Ireland. The post-tropical cyclone is moving toward the northeast near 43 mph (69 kph). A continued fast motion toward the northeast is expected through Thursday morning.
Maximum sustained winds are near 80 mph (130 kph) with higher gusts. Only slow weakening is forecast during the next day or so, and the system is expected to be a strong extratropical cyclone when it approaches Ireland Thursday afternoon and evening. A faster rate of weakening is expected when the cyclone moves over Ireland and England.
Lorenzo is a very large cyclone. Hurricane-force winds extend outward up to 150 miles (240 km) from the center and tropical storm-force winds extend outward up to 390 miles (630 km). The estimated minimum central pressure is 962 millibars.
Lorenzo’s Forecast Path
Lorenzo is expected to bring strong winds and rainfall to Ireland and portions of the United Kingdom.
The cyclone is forecast to slow down and turn eastward and then southeastward Thursday night and Friday. On the forecast track, the center of post-tropical Lorenzo will move near western Ireland on Thursday, then pass over Ireland and England on Thursday night and Friday.
Ireland Braces for Lorenzo
On Oct. 2, Met Eireann, the Irish Meteorological Service issued this forecast about Lorenzo’s approach and effects: “Turning wet and windy on Thursday as the outer rainbands associated with Storm Lorenzo track across Ireland. Southeast winds will be strong and gusty with some damaging gusts. Very high seas are expected along the Atlantic coast. Feeling increasingly humid with temperatures of 13 to 17 degrees Celsius [55.4 to 62.6 degrees Fahrenheit]. During Thursday evening [Oct. 3] the centre of Storm Lorenzo will move closer to the northwest coast. Southerly winds will veer west to southwest, with gales and severe damaging gusts, especially along Atlantic coasts. Intense falls of thundery rain will move into the west, too.”
Interests in Ireland should monitor products issued by Met Eireann, and interests in the United Kingdom should monitor products issued by the U.K. Met Office.
Lorenzo’s Ocean Effects Over Large Area
NHC forecasters noted that swells generated by Lorenzo have spread across much of the North Atlantic basin, and are affecting the east coast of the United States, Atlantic Canada, the Bahamas, portions of the Greater and Lesser Antilles, the Azores, and portions of the coast of Europe. These swells are likely to cause life-threatening surf and rip current conditions.
Hurricanes are the most powerful weather event on Earth. NASA’s expertise in space and scientific exploration contributes to essential services provided to the American people by other federal agencies, such as hurricane weather forecasting.
GPM is a joint mission between NASA and the Japan Aerospace Exploration Agency, JAXA.
Local forecasts and warnings for Ireland can be found on the website of Met Eireann, the Irish Meteorological Service, at http://www.met.ie
Additional information on this system can be found at: https://www.metoffice.gov.uk/weather/specialist-forecasts/coast-and-sea/high-seas-forecast