NASA’s Terra satellite’s visible image of Typhoon Haishen revealed a small “pinhole” eye surrounded by several hundred miles of thunderstorms spiraling around it as it continued moving north though the Northwestern Pacific Ocean.
NASA’s Terra satellite captured a visible image of Tropical Storm Haishen on Sept. 3 at 0145 UTC (Sept. 2 at 9:45 p.m. EDT). Satellite imagery shows deep convection and spiral banding of thunderstorms wrapping tightly around the eye and into a low-level circulation center. Image Courtesy: NASA Worldview, Earth Observing System Data and Information System (EOSDIS).
NASA Satellite View: Haishen’s Organization
The Moderate Resolution Imaging Spectroradiometer or MODIS instrument that flies aboard NASA’s Terra satellite captured a visible image of Typhoon Haishen on Sept. 3 at 0145 UTC (Sept. 2 at 9:45 p.m. EDT). Satellite imagery shows deep convection and spiral banding of thunderstorms wrapping tightly around the 10 nautical-mile wide eye and into a low-level circulation center.
Satellite imagery was created using NASA’s Worldview product at NASA’s Goddard Space Flight Center in Greenbelt, Md.
Haishen on Sept. 1
At 5 a.m. EDT (0900 UTC) on Sept. 3, the Joint Typhoon Warning Center (JTWC) in Honolulu, Hawaii noted that Typhoon Haishen was located about 646 nautical miles east-southeast of Kadena Air Base, Okinawa Island, Japan. It was centered near latitude 20.7 degrees north and longitude 137.7 degrees east. Haishen was moving to the northwest with maximum sustained winds of 95 knots (109 mph/176 kph).
Haishen is forecast to turn northwest while intensifying to 130 knots (150 mph/241 kph) within the next two days. The storm will pass west of Kyushu, Japan to make landfall in South Korea after 4 days.
About NASA’s Worldview and Terra Satellite
NASA’s Earth Observing System Data and Information System (EOSDIS) Worldview application provides the capability to interactively browse over 700 global, full-resolution satellite imagery layers and then download the underlying data. Many of the available imagery layers are updated within three hours of observation, essentially showing the entire Earth as it looks “right now.”
NASA’s Terra satellite is one in a fleet of NASA satellites that provide data for hurricane research.
Tropical cyclones/hurricanes are the most powerful weather events on Earth. NASA’s expertise in space and scientific exploration contributes to essential services provided to the American people by other federal agencies, such as hurricane weather forecasting.
Sep. 03, 2020 – NASA-NOAA Satellite Catches Hurricane Nana Making Landfall Under Cover of Night
NASA-NOAA’s Suomi NPP satellite provided a nighttime look at Hurricane Nana just after it began making landfall in Belize.
NASA-NOAA’s Suomi NPP satellite passed over the Caribbean Sea overnight on Sept. 3 at 3:25 a.m. EDT (0725 UTC) and captured a nighttime image of Hurricane Nana just after it made landfall in southern Belize. Credit: NASA Worldview, Earth Observing System Data and Information System (EOSDIS)
At 11 p.m. EDT on Sept. 2, Nana strengthened to a Category 1 hurricane on the Saffir-Simpson hurricane wind scale. It had maximum sustained winds near 75 mph (120 kph). At the time, it was just 60 miles (95 km) southeast of Belize City, Belize. At 2 a.m. EDT on Sept. 3, Hurricane Nana made landfall on the coast of Belize between Dangriga and Placencia with maximum sustained winds near 75 mph (120 kph). By 5 a.m. EDT, the storm had weakened to a tropical storm as it continued to move inland.
NASA’s Night-Time View of Nana’s Landfall
The Visible Infrared Imaging Radiometer Suite (VIIRS) instrument aboard NASA-NOAA’s Suomi NPP satellite passed the Caribbean Sea overnight on Sept. 3 at 3:25 a.m. EDT (0725 UTC) and captured a nighttime image of Hurricane Nana just after making landfall in southern Belize. Bands of thunderstorms wrapped around the storm’s center and extended into the Caribbean Sea. At NASA’s Goddard Space Flight Center in Greenbelt, Md., the imagery was created using the NASA Worldview application.
Warnings and Watches on Sept. 3
NOAA’s National Hurricane Center (NHC) noted on Sept. 3 that a Tropical Storm Warning is in effect for the Caribbean Sea coast of Guatemala, Isla Roatan and the Bay Islands of Honduras. A Tropical Storm Watch is in effect for the northern coast of Honduras from Punta Patuca westward to the Guatemala border.
Tropical Storm Nana’s Status on Sept. 3
At 8 a.m. EDT (1200 UTC) on Sept. 3, the center of Tropical Storm Nana was located near latitude 16.6 north, longitude 89.7 west. Nana is moving toward the west-southwest near 15 mph (24 kph), and this general motion is expected to continue through today with some decrease in forward speed. Maximum sustained winds have decreased to near 60 mph (95 kph) with higher gusts. The estimated minimum central pressure is 1000 millibars.
Nana’s Fated Forecast
On the forecast track, Nana will continue to move inland over Guatemala and extreme southeastern Mexico today and tonight. Rapid weakening is forecast today and tonight, and Nana will likely become a remnant low-pressure area on Friday, Sept. 4.
About NASA’s EOSDIS Worldview
NASA’s Earth Observing System Data and Information System (EOSDIS) Worldview application provides the capability to interactively browse over 700 global, full-resolution satellite imagery layers and then download the underlying data. Many of the available imagery layers are updated within three hours of observation, essentially showing the entire Earth as it looks “right now.”
NASA Researches Earth from Space
For more than five decades, NASA has used the vantage point of space to understand and explore our home planet, improve lives and safeguard our future. NASA brings together technology, science, and unique global Earth observations to provide societal benefits and strengthen our nation. Advancing knowledge of our home planet contributes directly to America’s leadership in space and scientific exploration.
Sep. 03, 2020 – NASA’s Terra Satellite Provides Clear Picture of Wind Shear Battering Omar
NASA’s Terra satellite provided a visible image that showed Tropical Storm Omar had weakened to a depression as it continued to be battered by strong upper level winds.
NASA’s Terra satellite provided a visible image to forecasters of Omar struggling against wind shear on Sept. 2 in the North Atlantic Ocean. Image Courtesy: NASA Worldview, Earth Observing System Data and Information System (EOSDIS).
NASA Satellite View
The Moderate Resolution Imaging Spectroradiometer or MODIS instrument that flies aboard NASA’s Terra satellite captured a visible image of Tropical Storm Omar on Sept. 2 at 1:30 p.m. EDT that showed outside winds pushing the bulk of clouds and storms east of the center. Using visible imagery, like this image from Terra, in addition to microwave and infrared satellite imagery, forecasters downgraded Omar from a tropical storm to a depression.
Satellite imagery was created using NASA’s Worldview product at NASA’s Goddard Space Flight Center in Greenbelt, Md.
In the next National Hurricane Center (NHC) advisory at 5 p.m. EDT, Omar was downgraded to a depression. This image and other imagery “showed the system remains sheared with a bursting pattern on satellite, occasionally exposing the center, and a large area of curved bands in the southeastern quadrant of the circulation,” said Eric Blake, Senior Hurricane Specialist at NOAA’s National Hurricane Center in Miami, Fla.
About Wind Shear
In general, wind shear is a measure of how the speed and direction of winds change with altitude. Tropical cyclones are like rotating cylinders of winds. Each level needs to be stacked on top each other vertically in order for the storm to maintain strength or intensify. Wind shear occurs when winds at different levels of the atmosphere push against the rotating cylinder of winds, weakening the rotation by pushing it apart at different levels. In the case of Omar, strong outside winds from the north-northwest were pushing clouds to the south-southeast of the center of circulation.
Omar on Sept. 3
Despite the strong wind shear, Omar continued to hold onto depression status on Sept. 3. At 5 a.m. EDT (0900 UTC), the center of Tropical Depression Omar was located near latitude 36.3 degrees north and longitude 62.4 degrees west. That is about 310 miles (495 km) north-northeast of Bermuda.
Omar is moving toward the east near 14 mph (22 kph), and this general motion is expected to continue through tonight, accompanied by a decrease in forward speed. A turn toward the east-northeast and northeast is expected Friday and Friday night. Maximum sustained winds are near 35 mph (55 kph) with higher gusts. The estimated minimum central pressure is 1005 millibars.
NHC Hurricane Specialist Robbie Berg noted, “Amazingly, 50 knots of north-northwesterly shear has not been enough to prevent deep convection from developing, likely because Omar remains in an unstable thermodynamic environment and over [warm] sea surface temperatures of 27-28 degrees Celsius [80.6 to 82.4 degrees Fahrenheit].” Tropical cyclones require sea surface temperatures as warm as 26.6C (80F) to maintain strength. Warmer sea surface temperatures can help intensify a storm.
NHC forecasters expect dissipation by Sunday, Sept. 6 since all global computer forecast models indicate that the remnant low’s circulation should open up into a trough [elongated area of low pressure] by then.
About NASA’s Worldview and Terra Satellite
NASA’s Earth Observing System Data and Information System (EOSDIS) Worldview application provides the capability to interactively browse over 700 global, full-resolution satellite imagery layers and then download the underlying data. Many of the available imagery layers are updated within three hours of observation, essentially showing the entire Earth as it looks “right now.”
NASA’s Terra satellite is one in a fleet of NASA satellites that provide data for hurricane research.
Tropical cyclones/hurricanes are the most powerful weather events on Earth. NASA’s expertise in space and scientific exploration contributes to essential services provided to the American people by other federal agencies, such as hurricane weather forecasting.
Sep. 02, 2020 – NASA Analyzes Typhoon Haishen’s Water Vapor Concentration
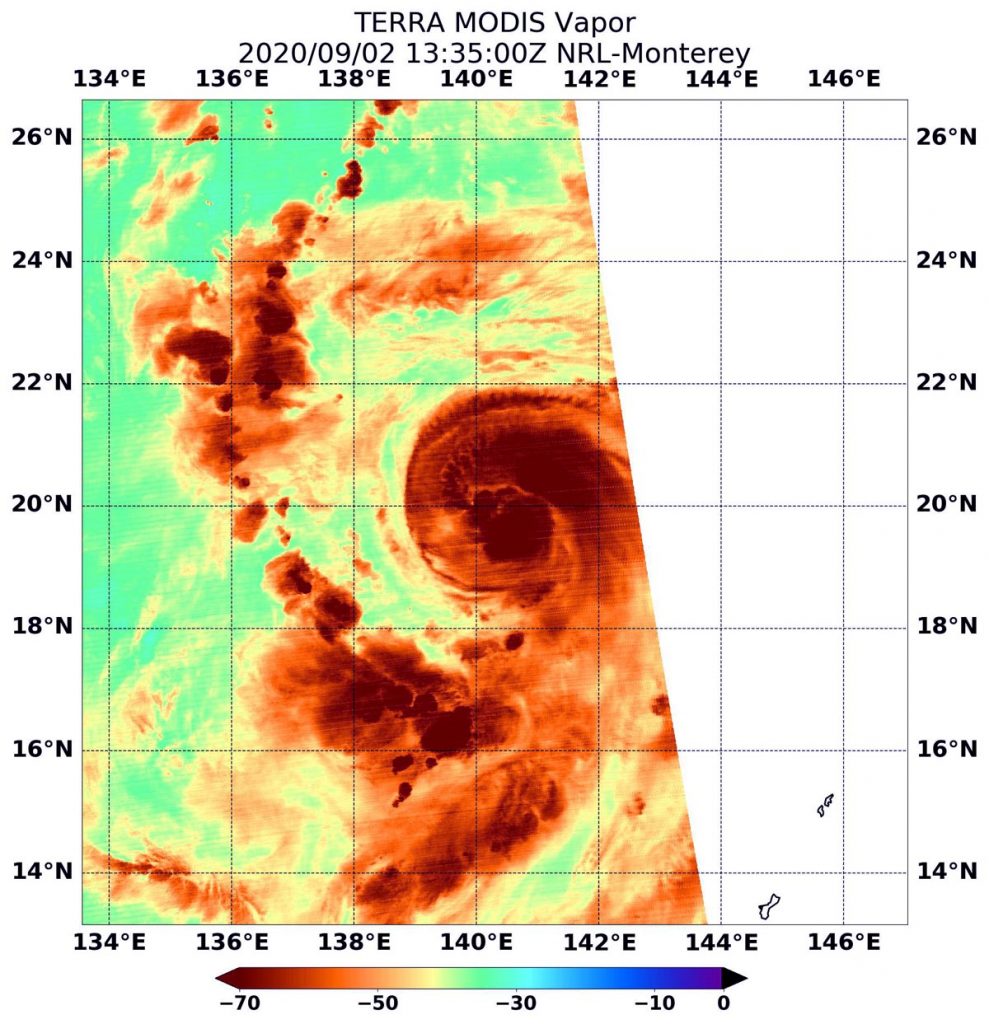
When NASA’s Terra satellite passed over the Northwestern Pacific Ocean, it gathered water vapor data on recently developed Typhoon Haishen and found powerful storms in two locations.
On Sept. 2 at 9:35 a.m. EDT (1335 UTC), NASA’s Terra satellite passed over Typhoon Haishen in the Northwestern Pacific Ocean. Terra found highest concentrations of water vapor (brown) and coldest cloud top temperatures were around the center and northeastern quadrant. Credits: NASA/NRL
Haishen strengthened quickly. It developed on August 31 as Tropical Depression 11W, and by Sept. 1, it had reached tropical storm status. By Sept. 2, it was a typhoon.
Water vapor analysis of tropical cyclones tells forecasters how much potential a storm has to develop. Water vapor releases latent heat as it condenses into liquid. That liquid becomes clouds and thunderstorms that make up a tropical cyclone. Temperature is important when trying to understand how strong storms can be. The higher the cloud tops, the colder and the stronger the storms.
NASA’s Terra satellite passed over Haishen on Sept. 2 at 9:35 a.m. EDT (1335 UTC), and the Moderate Resolution Imaging Spectroradiometer or MODIS instrument gathered water vapor content and temperature information. The MODIS image showed highest concentrations of water vapor and coldest cloud top temperatures were around the center of circulation and in a large band of thunderstorms in the northeastern quadrant of the storm.
MODIS data also showed coldest cloud top temperatures were as cold as or colder than minus 70 degrees Fahrenheit (minus 56.6 degrees Celsius) in those storms. Storms with cloud top temperatures that cold have the capability to produce heavy rainfall.
On Sept. 2 at 11 a.m. EDT (1500 UTC), Typhoon Haishen had maximum sustained winds near 70 knots (80 mph/130 kph) and it was strengthening. It was centered near latitude 19.5 degrees north and longitude 140.4 degrees east, about 812 nautical miles east-southeast of Kadena Air Base, Okinawa, Japan. Haishen was moving to the west-northwest.
Haishen’s Forecast Path Expected Similar to Maysak’s
As Typhoon Maysak approaches landfall in southern South Korea today, forecasters at the Joint Typhoon Warning Center now expect Haishen to follow a similar path.
Haishen will veer to the northwest while intensifying to 120 knots. The storm is forecast to move west of Kyushu, Japan, and will make landfall in South Korea after four days.
NASA’s Terra satellite is one in a fleet of NASA satellites that provide data for hurricane research.
NASA Researches Tropical Cyclones
Hurricanes/tropical cyclones are the most powerful weather events on Earth. NASA’s expertise in space and scientific exploration contributes to essential services provided to the American people by other federal agencies, such as hurricane weather forecasting.
For more than five decades, NASA has used the vantage point of space to understand and explore our home planet, improve lives and safeguard our future. NASA brings together technology, science, and unique global Earth observations to provide societal benefits and strengthen our nation. Advancing knowledge of our home planet contributes directly to America’s leadership in space and scientific exploration.
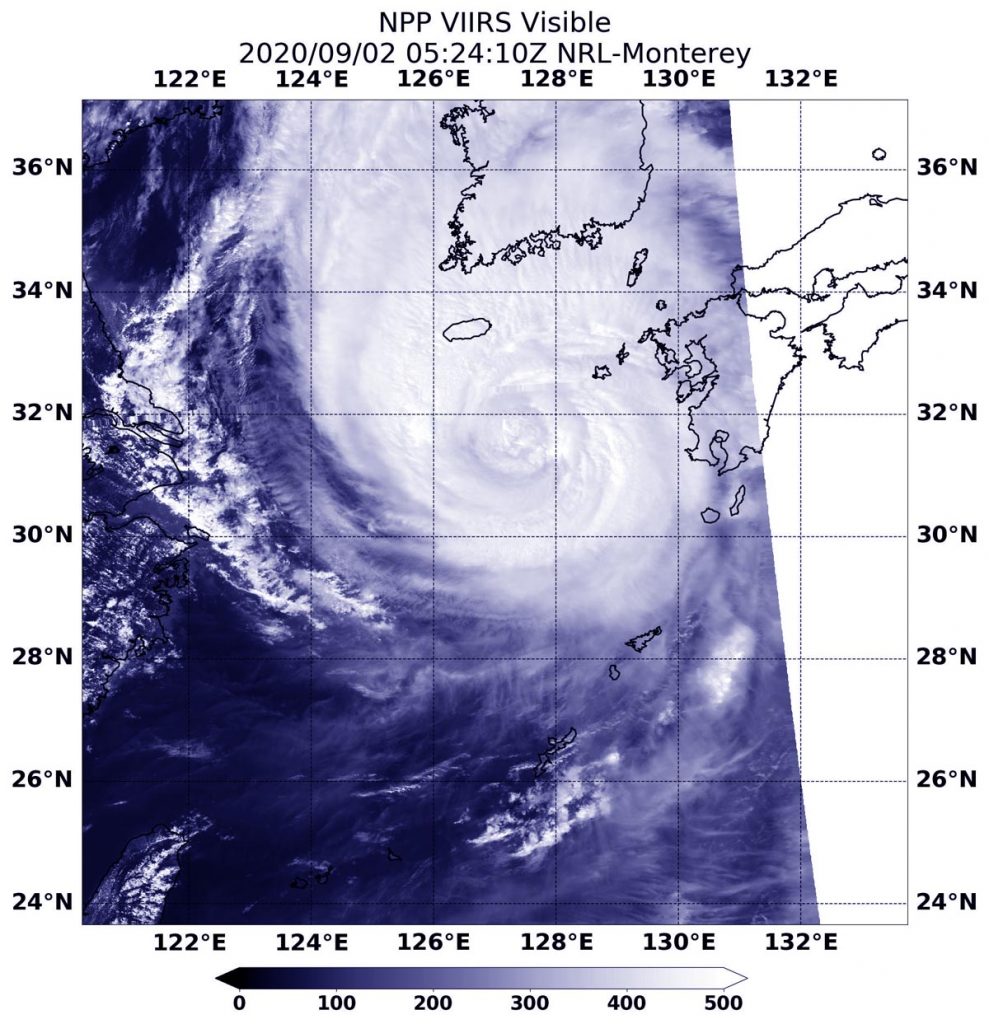
Typhoon Maysak was moving north through the East China Sea early on Sept. 2 when NASA-NOAA’s Suomi NPP satellite passed overhead and captured a visible image of the storm approaching landfall in South Korea.
NASA-NOAA’s Suomi NPP satellite passed over the East China Sea on Sept. 2 at 1:24 a.m. EDT (0524 UTC) and saw Typhoon Maysak headed for landfall in southern South Korea. Credit: NASA/NRL
The Visible Infrared Imaging Radiometer Suite (VIIRS) instrument aboard Suomi NPP provided a visible image of Typhoon Maysak on Sept. 2 at 1:24 a.m. EDT (0524 UTC) and saw Typhoon Maysak headed for landfall in southern South Korea. The image revealed that the eye had again become obscured, and strong thunderstorms circled the center of circulation. The northern quadrant was already moving over South Korea and the eastern quadrant was brushing Kyushu, Japan. Kyushu is the most southern and third largest island of Japan’s five main islands.
On Sept. 2 at 11 a.m. EDT (1500 UTC) Maysak was still a typhoon with maximum sustained winds near 90 knots (104 mph/167 kph). It was located near latitude 33.1 degrees north and longitude 127.9 degrees east, about 134 miles south-southwest of Busan, South Korea. Maysak was moving to the north-northeast.
Maysak is forecast to move north and make landfall later in the day today, west of Busan, South Korea. It will weaken rapidly as it passes over the length of the Korean peninsula and will dissipate over northeastern China.
For more than five decades, NASA has used the vantage point of space to understand and explore our home planet, improve lives and safeguard our future. NASA brings together technology, science, and unique global Earth observations to provide societal benefits and strengthen our nation. Advancing knowledge of our home planet contributes directly to America’s leadership in space and scientific exploration
Sep. 02, 2020 – NASA Finds New Tropical Storm Nana Strengthening in the Caribbean
The storm was a potential tropical depression on Sept. 1, but by Sept. 2, the area of low pressure in the Caribbean Sea strengthened into a tropical storm and was named Nana.
NASA’s Terra satellite provided forecasters with a look at the strength of the thunderstorms that make up Nana by analyzing cloud top temperatures.
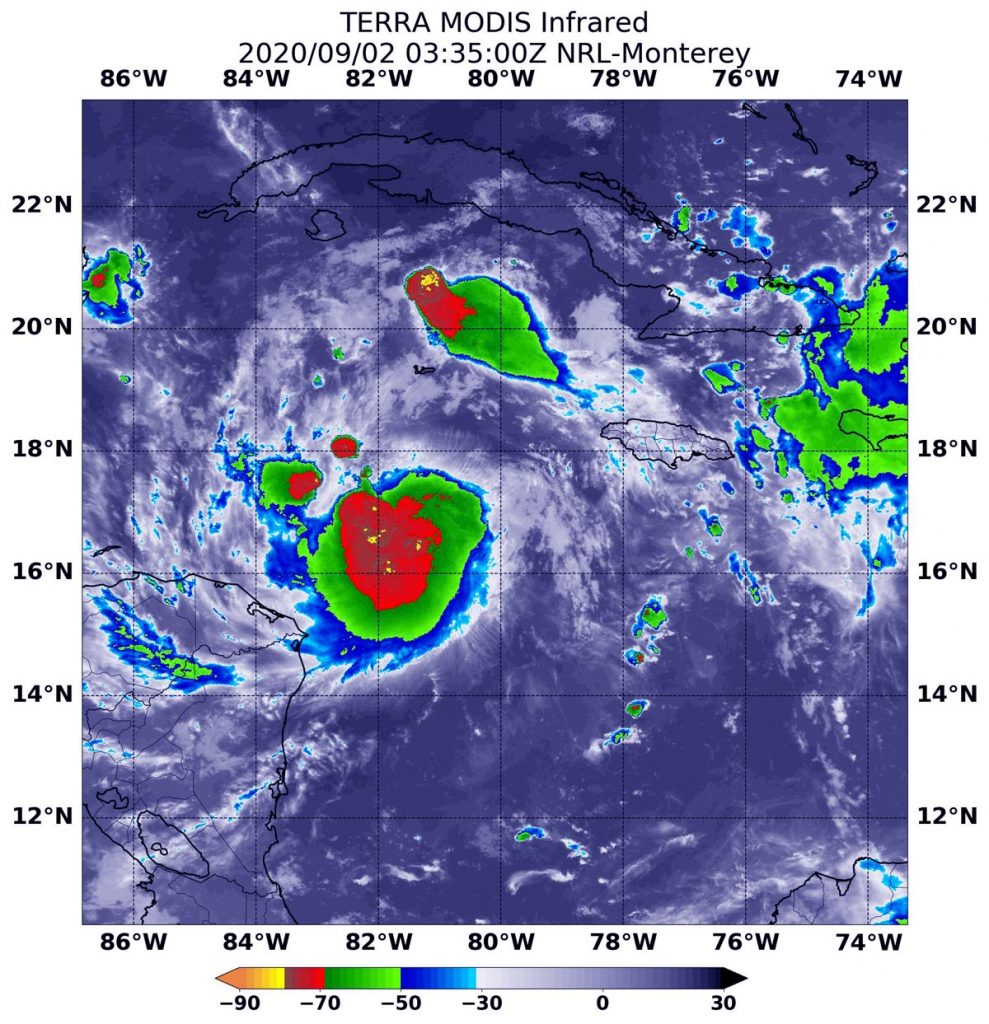
On Sept. 1 at 11:35 p.m. EDT (Sept. 2 at 335 UTC), the MODIS instrument aboard NASA’s Terra satellite gathered temperature information about Tropical Storm Nana’s cloud tops. MODIS found the most powerful thunderstorms (yellow) were around the center of the storm, where temperatures were as cold as or colder than minus 80 degrees (minus 62.2 degrees Fahrenheit). That area was surrounded by slightly less powerful storms (red) where cloud top temperatures were as cold as or colder than minus 70 degrees Fahrenheit (minus 56.6 Celsius). Credit: NASA/NRL
Potential Tropical Depression 16 developed into a tropical storm by 12:05 p.m. EDT on Sept. 1, south of Jamaica. Tropical Storm Nana is the 14th named tropical storm of the 2020 Atlantic hurricane season.
Warnings and Watches Now in Effect
NOAA’s National Hurricane Center (NHC) posted watches and warnings on Sept. 2 for areas in Central America, as Nana is forecast to move on a westerly path through the Caribbean Sea.
A Hurricane Watch is in effect for the entire coast of Belize. A Tropical Storm Warning is in effect for Yucatan, Mexico from Puerto Costa Maya to Chetumal, Mexico and for the entire coast of Belize.
A Tropical Storm Watch is in effect for the northern coast of Honduras from Punta Patuca westward to the Guatemala border, for Roatan Island and the Bay Islands of Honduras and for the Caribbean Sea coast of Guatemala.
Infrared Data Reveals Nana Strengthening
On Sept. 1 at 11:35 p.m. EDT (Sept. 2 at 335 UTC), the Moderate Resolution Imaging Spectroradiometer or MODIS instrument aboard NASA’s Terra satellite gathered temperature information about Tropical Storm Nana’s cloud tops. Strongest storms were around the center of the storm, where temperatures were as cold as or colder than minus 80 degrees (minus 62.2 degrees Fahrenheit). That area was surrounded by large area of slightly less powerful storms where cloud top temperatures were as cold as or colder than minus 70 degrees Fahrenheit (minus 56.6 Celsius).
“Nana’s Central Dense Overcast has become a little better defined, with cloud tops to minus 80 degrees Celsius [minus 112 degrees Fahrenheit] or colder. Upper-level outflow continues to be somewhat inhibited over the northern portion of the circulation. SFMR-observed surface winds and adjusted flight-level winds from an Air Force Hurricane Hunter aircraft indicated an intensity of 50 knots. Although northerly [wind] shear is likely to limit intensification, the environment is conducive enough for Nana to strengthen into a hurricane later today,” Dr. Richard Pasch wrote in the 5 a.m. EDT Nana Discussion. Pasch is a senior hurricane specialist at NOAA’s National Hurricane Center (NHC) in Miami, Florida.
Nana’s Status on Sept. 2
At 8 a.m. EDT (1200 UTC) on Sept. 2, the center of Tropical Storm Nana was located near latitude 17.1 degrees north and longitude 83.7 degrees west. It was centered about 150 miles (240 km) northeast of Limon, Honduras and 305 miles (490 km) east of Belize City, Belize.
Nana was moving toward the west near 18 mph (30 kph), and this general motion with some decrease in forward speed is expected today. Maximum sustained winds were near 60 mph (95 kph) with higher gusts. The minimum central pressure estimated from a NOAA Hurricane Hunter aircraft observations is 996 millibars.
Nana Forecast Toward Belize
The NHC forecast expects a westward or west-southwestward motion tonight and Thursday. Strengthening is expected, and Nana is forecast to become a hurricane later today or tonight before it reaches the coast of Belize. On the forecast track, Nana will be moving near but north of the coast of Honduras today and likely be approaching the coast of Belize tonight and early Thursday.
Tropical cyclones/hurricanes are the most powerful weather events on Earth. NASA’s expertise in space and scientific exploration contributes to essential services provided to the American people by other federal agencies, such as hurricane weather forecasting.
Sep. 02, 2020 – NASA Catches Formation of Atlantic’s Record-breaking 15th Tropical Storm
Tropical Depression 15 strengthened into a tropical storm late on Sept. 1 and was renamed Omar. Visible imagery from NASA-NOAA’s Suomi NPP satellite was compiled into an animation that showed the system’s formation and strengthening. NASA’s Terra satellite also provided temperature data on Omar that revealed wind shear was affecting the storm.
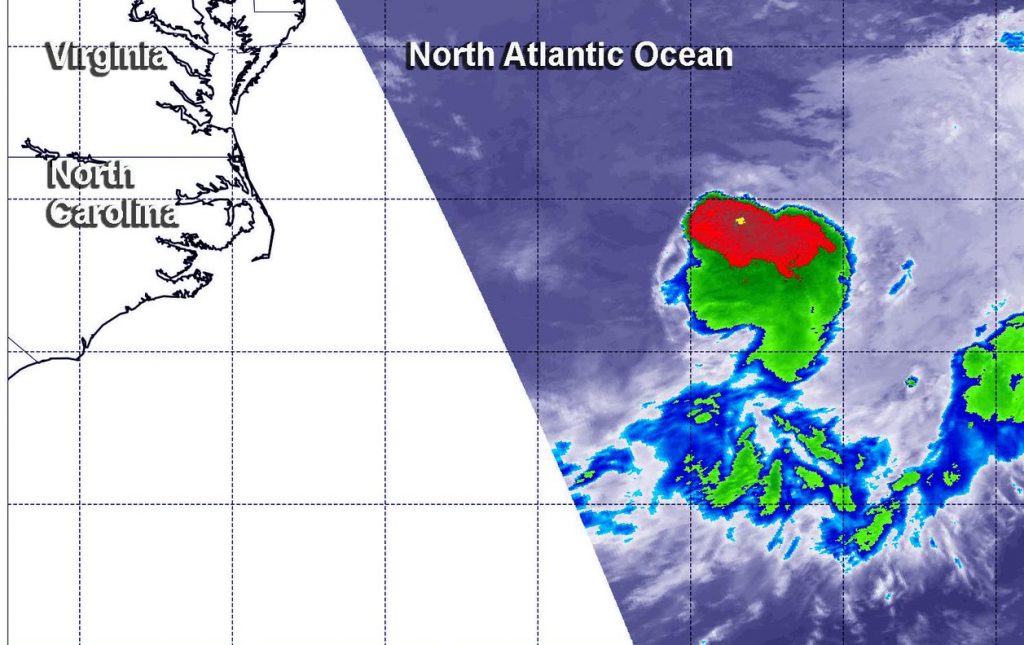
On Sept. 1 at 10 p.m. EDT (Sept. 2 at 0200 UTC) the MODIS instrument aboard NASA’s Terra satellite gathered temperature information about Tropical Storm Omar’s cloud tops. MODIS found the most powerful thunderstorms (red) were on the southeastern side of the storm, where temperatures were as cold as or colder than minus 70 degrees Fahrenheit (minus 56.6 Celsius). Credit: NASA/NRL
Another Record-Breaker
Omar is the 15th named storm of the 2020 Atlantic hurricane season, and is the earliest 15th storm on record, besting the previous mark by about a week from Ophelia of 2005.
NASA Animates Omar’s Development
At NASA’s Goddard Space Flight Center in Greenbelt, Md. using the NASA Worldview platform an animation of satellite imagery was created to show Omar over three days. Using visible imagery from the Visible Infrared Imaging Radiometer Suite (VIIRS) instrument aboard NASA-NOAA’s Suomi NPP satellite, an animation shows the development, organization and movement of Tropical Depression 15 from Aug. 30 to Sept. 1 off the coast of North Carolina. On Sept. 2, it became Tropical Storm Omar.
This animation of visible imagery from the VIIRS instrument aboard NASA-NOAA’s Suomi NPP satellite shows the organization and movement of Tropical Depression 15 from Aug. 30 to Sept. 1 off the coast of North Carolina. On Sept. 2, it became Tropical Storm Omar. Courtesy: NASA Worldview, Earth Observing System Data and Information System (EOSDIS).
Infrared Data Reveals Wind Shear Battering Omar
Strong upper-level winds are battering Omar and pushing the strongest storms to the southeastern quadrant. Those northwesterly winds are not expected to let up, putting Omar on a weakening trend. NASA’s infrared data showed how those outside winds were displacing the strongest storms in Omar’s circulation.
On Sept. 1 at 10 p.m. EDT (Sept. 2 at 0200 UTC), the Moderate Resolution Imaging Spectroradiometer or MODIS instrument aboard NASA’s Terra satellite gathered temperature information about Tropical Storm Omar’s cloud tops. MODIS found the most powerful thunderstorms were on the southeastern side of the storm, where temperatures were as cold as or colder than minus 70 degrees Fahrenheit (minus 56.6 Celsius). Cloud top temperatures that cold indicate strong storms with the potential to generate heavy rainfall.
“Satellite images show that the system remains sheared with a bursting pattern on satellite, occasionally exposing the center, and a large area of curved bands in the southeastern quadrant of the circulation,” Eric Blake wrote in the 5 a.m. EDT Omar Discussion. Blake is a senior hurricane specialist at NOAA’s National Hurricane Center (NHC) in Miami, Florida.
Omar’s Status on Sept. 2
At 5 a.m. EDT (0900 UTC), NOAA’s NHC noted the center of Tropical Storm Omar was located near latitude 36.2 degrees north and longitude 68.7 degrees west. Omar was centered about 350 miles (560 km) northwest of Bermuda. The storm is moving toward the east-northeast near 14 mph (22 kph), and this general motion is expected to continue through this afternoon. Maximum sustained winds are near 40 mph (65 km/h) with higher gusts. Little change in strength is expected through tonight. The estimated minimum central pressure is 1003 millibars.
Omar’s Bleak Forecast
The NHC forecast calls for Omar to turn toward the east during the evening hours on Sept. 2, with a reduction in forward speed occurring through Friday, Sept. 4. Weakening should begin by Thursday, Sept. 3, with Omar likely to become a remnant low-pressure area by Thursday night.
About NASA’s Worldview
NASA’s Earth Observing System Data and Information System (EOSDIS) Worldview application provides the capability to interactively browse over 700 global, full-resolution satellite imagery layers and then download the underlying data. Many of the available imagery layers are updated within three hours of observation, essentially showing the entire Earth as it looks “right now.”
Tropical cyclones/hurricanes are the most powerful weather events on Earth. NASA’s expertise in space and scientific exploration contributes to essential services provided to the American people by other federal agencies, such as hurricane weather forecasting.
Sep. 01, 2020 – NASA Sees Typhoon Maysak’s Eye Reopen
NASA’s Terra satellite obtained visible imagery of Typhoon Maysak is it continued moving north though the East China Sea. The imagery revealed the eye of the storm had reappeared.
NASA’s Terra satellite provided a visible image to forecasters of Typhoon Maysak moving north through the East China Sea toward a landfall in southern South Korea. Image Courtesy: NASA Worldview, Earth Observing System Data and Information System (EOSDIS).
NASA Satellite View: Maysak’s Organization
The Moderate Resolution Imaging Spectroradiometer or MODIS instrument that flies aboard NASA’s Terra satellite captured a visible image of Tropical Storm Maysak on Sept. 1. In the image, the eye was again visible after being obscured by clouds during the previous day, Aug. 31. Satellite imagery depicts deep convection and spiral banding of thunderstorms wrapping tightly into a low-level circulation center.
Satellite imagery was created using NASA’s Worldview product at NASA’s Goddard Space Flight Center in Greenbelt, Md.
Maysak on Sept. 1
At 11 a.m. EDT (1500 UTC) on Sept. 1, the Joint Typhoon Warning Center (JTWC) in Honolulu, Hawaii noted that Typhoon Maysak was located about 427 nautical miles south-southwest of Busan, South Korea near latitude 28.4 degrees north and longitude 126.3 degrees east. Maysak was moving to the north with maximum sustained winds of 120 knots (138 mph/222 kph).
Maysak is forecast to make landfall to the west of Busan on Sept. 2. Then it is expected to weaken rapidly as it passes over the length of the Korean peninsula, and will dissipate over northeastern China.
About NASA’s Worldview and Terra Satellite
NASA’s Earth Observing System Data and Information System (EOSDIS) Worldview application provides the capability to interactively browse over 700 global, full-resolution satellite imagery layers and then download the underlying data. Many of the available imagery layers are updated within three hours of observation, essentially showing the entire Earth as it looks “right now.”
NASA’s Terra satellite is one in a fleet of NASA satellites that provide data for hurricane research.
Tropical cyclones/hurricanes are the most powerful weather events on Earth. NASA’s expertise in space and scientific exploration contributes to essential services provided to the American people by other federal agencies, such as hurricane weather forecasting.
Sep. 01, 2020 – NASA-NOAA Satellite Provides a Nighttime View of New Atlantic Tropical Depression
NASA-NOAA’s Suomi NPP satellite provided a nighttime view of the Atlantic Ocean hurricane season’s latest tropical cyclone off the coast of North Carolina. Ocean swells from the depression are affecting coastal North Carolina today, Sept. 1.
NASA-NOAA’s Suomi NPP satellite passed the Atlantic Ocean during the early morning hours of Sept. 1 and obtained an infrared view of Tropical Depression 15. TD15 is located in the Atlantic Ocean, off the coast of North Carolina. Credit: NASA Worldview, Earth Observing System Data and Information System (EOSDIS)
Tropical Depression 15 formed by 5 p.m. EDT off the coast of North Carolina and showed organized convection (rising air that forms the thunderstorms that make up a tropical cyclone). The storm has been battling vertical wind shear since its formation, which has kept it from intensifying into a tropical storm.
NASA’s Night-Time View
The Visible Infrared Imaging Radiometer Suite (VIIRS) instrument aboard Suomi NPP provided a nighttime image of 15 during the early morning hours of Sept 1 when it flew over the northwestern Atlantic Ocean. Infrared data showed the most powerful thunderstorms east of center where cloud top temperatures were as cold as or colder than minus 70 degrees Fahrenheit. Deep convection remains displaced to the east and southeast of the depression’s low-level center due to increasing west-northwesterly wind shear.
The image was created using the NASA Worldview application at NASA’s Goddard Space Flight Center, Greenbelt, Md.
TD15’s Status
At 11 a.m. EDT (1500 UTC), NOAA’s National Hurricane Center (NHC) reported the center of Tropical Depression 15 (TD 15) was located near latitude 34.7 degrees north and longitude 73.1 degrees west. TD 15 is centered about 140 miles (225 km) east-southeast of Cape Hatteras, North Carolina. The depression is moving toward the east-northeast near 14 mph (22 kph). This general motion is forecast today, followed by a turn toward the east by Thursday. On the forecast track, the center of the depression will continue to move away from the North Carolina coast today.
Maximum sustained winds remain near 35 mph (55 kph) with higher gusts. The depression could become a tropical storm later today or tonight. Gradual weakening is anticipated by late Wednesday. The system is forecast to become a remnant low on Thursday.
TD15’s Effects Along the U.S. Coast
Although the depression is off the coast of North Carolina it is generating ocean swells that are affecting the U.S. coast. NHC said, “Swells generated by the depression will continue to affect portions of the Outer Banks of North Carolina through this evening, causing life-threatening surf and rip current conditions.” There are no other watches or warnings in effect and the storm is forecast to move away from the coast.
About NASA’s EOSDIS Worldview
NASA’s Earth Observing System Data and Information System (EOSDIS) Worldview application provides the capability to interactively browse over 700 global, full-resolution satellite imagery layers and then download the underlying data. Many of the available imagery layers are updated within three hours of observation, essentially showing the entire Earth as it looks “right now.”
NASA Researches Earth from Space
For more than five decades, NASA has used the vantage point of space to understand and explore our home planet, improve lives and safeguard our future. NASA brings together technology, science, and unique global Earth observations to provide societal benefits and strengthen our nation. Advancing knowledge of our home planet contributes directly to America’s leadership in space and scientific exploration.
Aug. 31, 2020 – NASA Finds Typhoon Maysak Moving Near Okinawa, Japan
Typhoon Maysak continued to move through the Northwestern Pacific and was closing in on Japan’s Okinawa Island when NASA’s Terra satellite obtained a visible image of the storm. Maysak’s eye is not expected to go over the island, but pass just west of it.
NASA’s Terra satellite provided a visible image to forecasters of Typhoon Maysak as it neared Okinawa Island, Japan on Aug. 31. Image Courtesy: NASA Worldview, Earth Observing System Data and Information System (EOSDIS).
The Moderate Resolution Imaging Spectroradiometer or MODIS instrument that flies aboard NASA’s Terra satellite captured a visible image of Typhoon Maysak. Imagery showed the eye of the storm appeared filled with high clouds, as powerful bands of thunderstorm circled it. Bands of thunderstorms from the south were spiraling into the low-level center.
On Aug. 31 at 5 a.m. EDT (0900 UTC), Typhoon Maysak was located about 144 nautical miles south of Kadena Air Base, Okinawa Island, Japan. It was moving to the north-northwest and had maximum sustained winds near 100 knots (115 mph/185 kph).
Maysak’s center is expected to pass just west of Okinawa within 24 hours. The storm is expected to make landfall in southern South Korea and will start to become extra-tropical.
About NASA’s Worldview and Terra Satellite
NASA’s Earth Observing System Data and Information System (EOSDIS) Worldview application provides the capability to interactively browse over 700 global, full-resolution satellite imagery layers and then download the underlying data. Many of the available imagery layers are updated within three hours of observation, essentially showing the entire Earth as it looks “right now.”
NASA’s Terra satellite is one in a fleet of NASA satellites that provide data for hurricane research.
Tropical cyclones/hurricanes are the most powerful weather events on Earth. NASA’s expertise in space and scientific exploration contributes to essential services provided to the American people by other federal agencies, such as hurricane weather forecasting.