Sep. 10, 2020 – NASA Finds Tropical Storm Rene Less Affected by Wind Shear
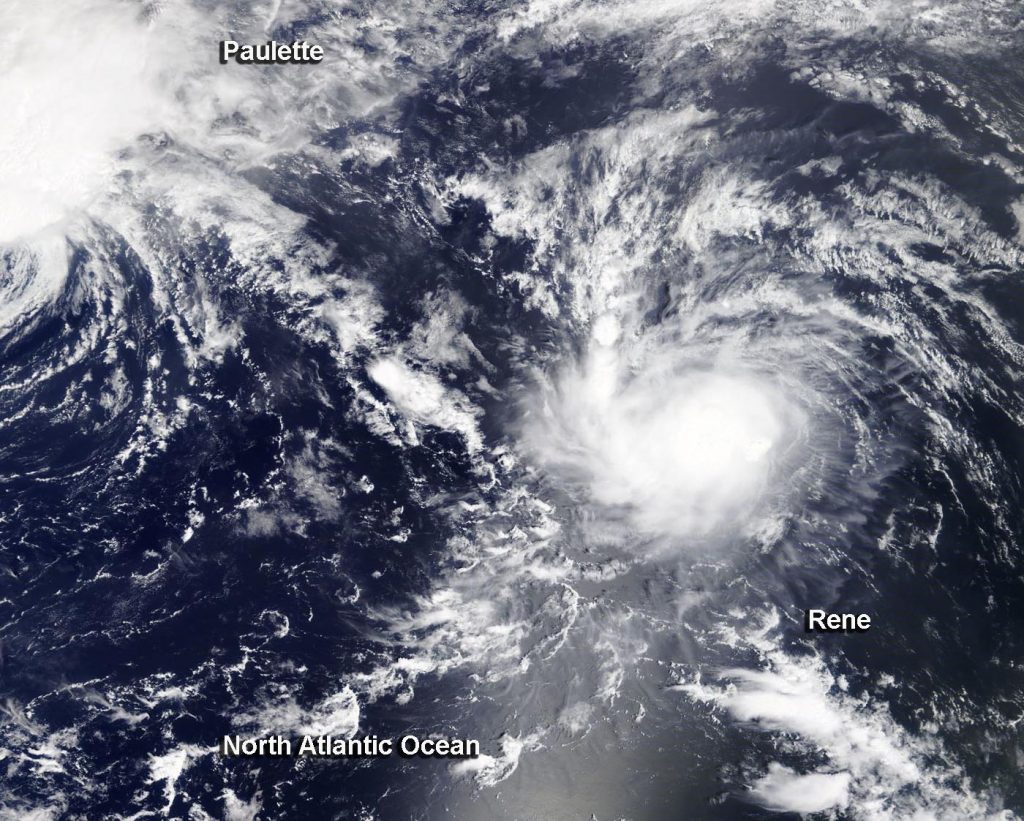
NASA’s Terra satellite obtained visible imagery of Tropical Storm Rene is it continued moving north though the central North Atlantic Ocean. Rene appeared more organized on satellite imagery as wind shear eased.
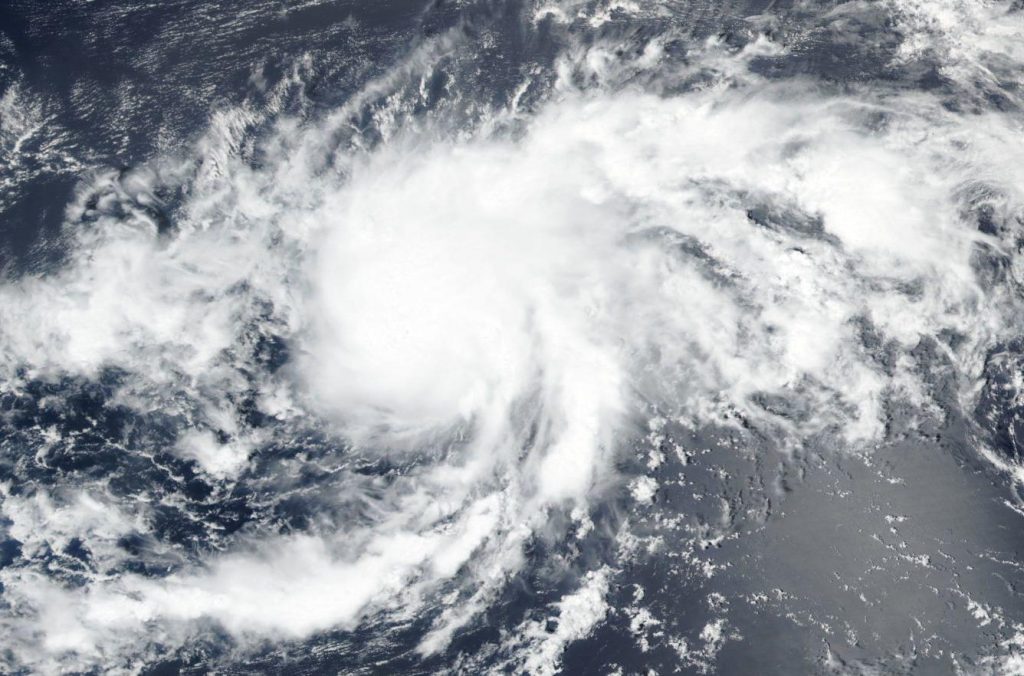
On Sept. 10, 2020, NASA’s Terra satellite provided a visible image of Tropical Storm Rene, and the eastern side of Tropical Storm Paulette (top left) moving through the Atlantic Ocean. Image Courtesy: NASA Worldview, Earth Observing System Data and Information System (EOSDIS).
NASA Satellite View: Rene’s Organization
The Moderate Resolution Imaging Spectroradiometer or MODIS instrument that flies aboard NASA’s Terra satellite captured a visible image of Tropical Storm Rene on Sept. 10. Rene appeared slightly more circular. That is because vertical wind shear (outside winds blowing at different levels of the atmosphere) appears to have lessened somewhat over Rene allowing the storm to organize. The image showed Tropical Storm Paulette was located to Rene’s northwest.
Satellite imagery was created using NASA’s Worldview product at NASA’s Goddard Space Flight Center in Greenbelt, Md.
Rene on Sept. 10
At 11 a.m. EDT (1500 UTC) on Sept. 10, the center of Tropical Storm Rene was located near latitude 18.6 degrees north and longitude 35.8 degrees west. Rene was about 800 miles (1,285 km) west-northwest of the Cabo Verde Islands.
Rene is moving toward the west-northwest near 12 mph (19 kph). This general motion is expected to continue for the next couple of days, followed by a turn toward the northwest. Maximum sustained winds have increased to near 50 mph (85 kph) with higher gusts. The estimated minimum central pressure is 1000 millibars.
NOAA’s National Hurricane Center (NHC) noted that additional strengthening is forecast for the next couple of days as vertical wind shear is not expected to be strong. Therefore, Rene is expected to become a hurricane by Saturday, Sept. 12. The storm is not expected to affect any land areas in the next five days, according to the NHC forecast.
About NASA’s Worldview and Terra Satellite
NASA’s Earth Observing System Data and Information System (EOSDIS) Worldview application provides the capability to interactively browse over 700 global, full-resolution satellite imagery layers and then download the underlying data. Many of the available imagery layers are updated within three hours of observation, essentially showing the entire Earth as it looks “right now.”
NASA’s Terra satellite is one in a fleet of NASA satellites that provide data for hurricane research.
Tropical cyclones/hurricanes are the most powerful weather events on Earth. NASA’s expertise in space and scientific exploration contributes to essential services provided to the American people by other federal agencies, such as hurricane weather forecasting.
Sep. 10, 2020 – Infrared NASA Imagery Provides Paulette’s Temperature Palette
NASA’s Aqua satellite analyzed Tropical Storm Paulette in infrared imagery as it moved through the Central Atlantic Ocean. At NASA, the imagery was false-colored to show cloud-top temperature gradients and identify the locations of the strongest storms. The imagery also indicated Paulette was being affected by wind shear.
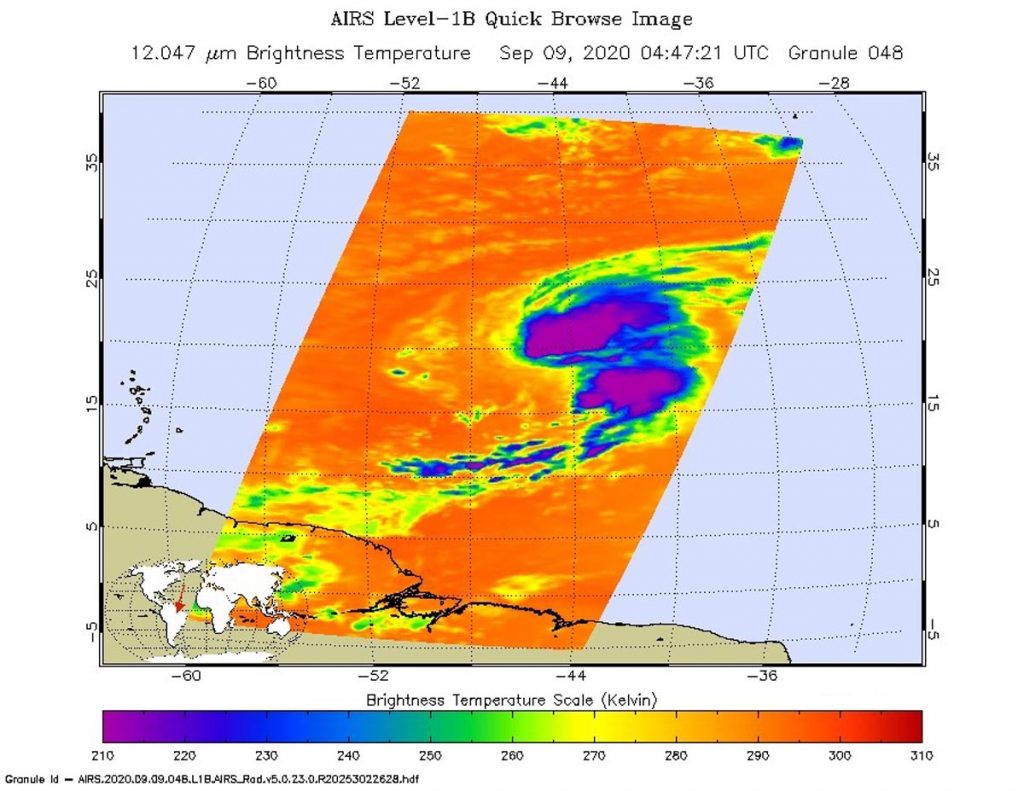
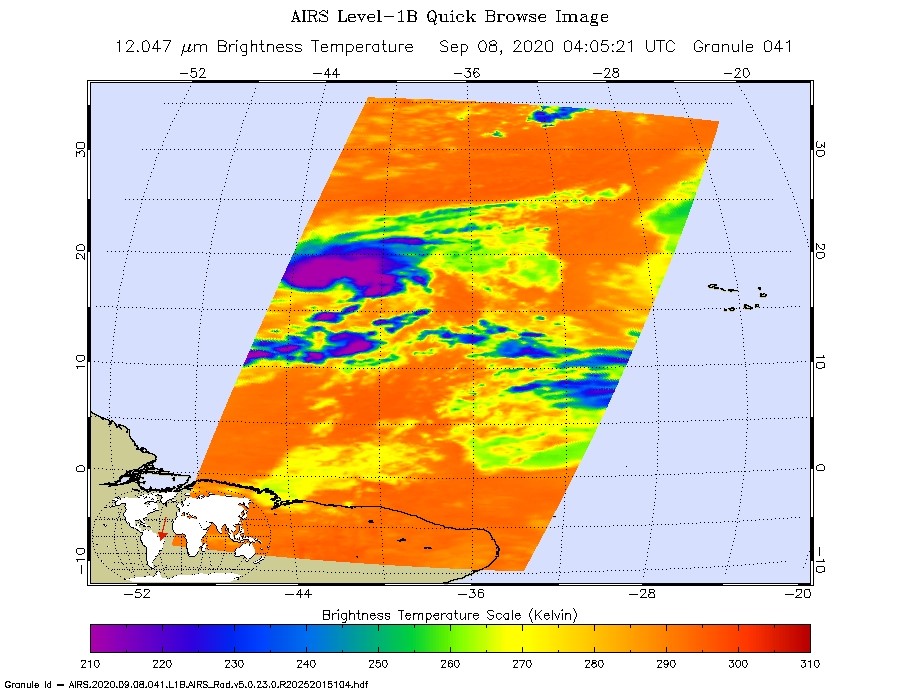
On Sept. 9 at 12:47a.m. EDT (0447 UTC) NASA’s Aqua satellite analyzed Tropical Storm Paulette using the Atmospheric Infrared Sounder or AIRS instrument. AIRS found coldest cloud top temperatures as cold as or colder than (purple) minus 63 degrees Fahrenheit (minus 53 degrees Celsius) northeast of the center and in a band of thunderstorms south of center. Credit: NASA JPL/Heidar Thrastarson
Infrared Imagery and Paulette’s Strength
One of the ways NASA researches tropical cyclones is using infrared data that provides temperature information. The AIRS instrument aboard NASA’s Aqua satellite captured a look at those temperatures in Paulette and gave insight into the size of the storm and its rainfall potential.
Cloud top temperatures provide information to forecasters about where the strongest storms are located within a tropical cyclone. Tropical cyclones do not always have uniform strength, and some sides have stronger sides than others. The stronger the storms, the higher they extend into the troposphere, and the colder the cloud top temperatures. NASA provides that data to forecasters at NOAA’s National Hurricane Center or NHC so they can incorporate in their forecasting.
On Sept. 9 at 12:47 a.m. EDT (0447 UTC) NASA’s Aqua satellite analyzed Tropical Storm Paulette using the Atmospheric Infrared Sounder or AIRS instrument. AIRS found coldest cloud top temperatures as cold as or colder than minus 63 degrees Fahrenheit (minus 53 degrees Celsius) northeast of the center and in a band of thunderstorms south of center. The center is near the southern side of a large thunderstorm cluster, with the bulk of deep convection in the northeastern quadrant of the cyclone.
NASA research has shown that cloud top temperatures that cold indicate strong storms that have the capability to create heavy rain.
Paulette had maximum sustained winds near 60 mph (95 kph) at the time of the AIRS image. Wind shear continued to affect the storm and weakened it over the next day.
What is Wind Shear?
In general, wind shear is a measure of how the speed and direction of winds change with altitude. Tropical cyclones are like rotating cylinders of winds. Each level needs to be stacked on top each other vertically in order for the storm to maintain strength or intensify. Wind shear occurs when winds at different levels of the atmosphere push against the rotating cylinder of winds, weakening the rotation by pushing it apart at different levels. Wind shear from the west-southwest was pushing the bulk of strong thunderstorms northeast of Paulette’s center.
Paulette’s Status of Sept. 10
By 5 a.m. EDT (0900 UTC) on Sept. 10, although Paulette’s center of circulation had separated farther south from the cloud mass during the early morning hours, infrared imagery showed the cyclone was still producing an area of deep convection and strong thunderstorms consisting of minus 79 degrees Celsius (minus 110.2 degrees Fahrenheit) cold cloud tops.
Robbie Berg, hurricane specialist at NOAA’s National Hurricane Center in Miami, Florida, noted at 11 a.m. EDT on Sept. 10, “Southwesterly shear has increased over the cyclone as expected, with the latest University of Wisconsin-Madison-CIMSS analysis now between 35 and 40 knots.” The wind shear is expected to peak by 11 p.m. EDT on Sept. 10, so a little more weakening is anticipated over the next day or so. The shear is then forecast to gradually abate.
At 11 a.m. EDT (1500 UTC), NHC reported the center of Tropical Storm Paulette was located near latitude 21.5 degrees north and longitude 49.1 degrees west. That is about 935 miles (1,510 km) east-northeast of the Northern Leeward Islands. Paulette is moving toward the west-northwest near 10 mph (17 kph). A west-northwestward or northwestward motion with some increase in forward speed is expected through the weekend. Maximum sustained winds have decreased to near 50 mph (85 kph) with higher gusts.
Paulette’s Forecast
NHC expects a west-northwestward or northwestward motion with some increase in forward speed through the weekend. Some additional slight weakening is expected during the next day or so, but Paulette is then forecast to re-strengthen by Saturday. Paulette could become a hurricane by Sunday or Monday.
There are no coastal watches or warnings in effect. Interests in Bermuda should monitor the progress of this system. Ocean swells forecast to spread across the southwestern Atlantic through the weekend.
The AIRS instrument is one of six instruments flying on board NASA’s Aqua satellite, launched on May 4, 2002.
For more than five decades, NASA has used the vantage point of space to understand and explore our home planet, improve lives and safeguard our future. NASA brings together technology, science, and unique global Earth observations to provide societal benefits and strengthen our nation. Advancing knowledge of our home planet contributes directly to America’s leadership in space and scientific exploration.
Sep. 09, 2020 – NASA Infrared Imagery Shows Tropical Storm Rene’s Seesaw of Strength
Tropical Storm Rene weakened to a tropical depression late on Sept. 8 but regained tropical storm status on Sept. 9. Infrared imagery from NASA’s Aqua satellite captured Rene as it was twice transitioning.
Rene has been battling wind shear in the eastern North Atlantic Ocean and when NASA’s Aqua satellite passed over the storm on Sept. 8, it found Rene weakening although still a tropical storm. Wind shear occurs when winds blowing outside of a tropical cyclone at different levels of the atmosphere push against the tropical cyclone and weaken it.
NASA’s Infrared Views of Rene
Tropical cyclones are made up of hundreds of thunderstorms, and infrared data can show where the strongest storms are located. That is because infrared data provides temperature information, and the strongest thunderstorms that reach highest into the atmosphere have the coldest cloud top temperatures.
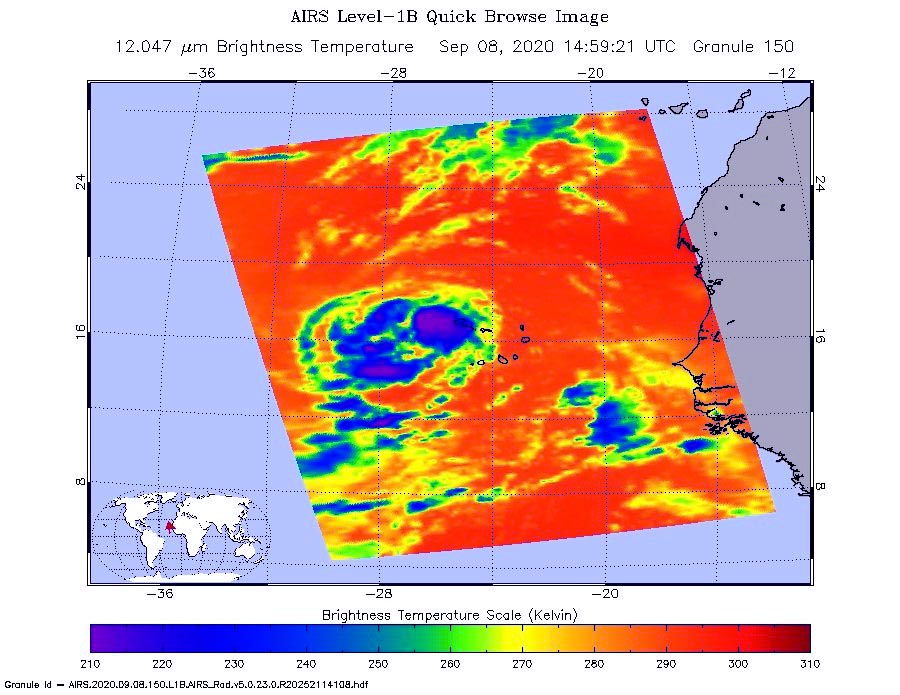
On Sept. 8 at 10:59 a.m. EDT (1459 UTC), NASA’s Aqua satellite analyzed Rene’s cloud top temperatures. Imagery showed the strongest storms (purple) east of the center of circulation, and in fragmented bands west of the center where coldest cloud top temperatures as cold as or colder 210 Kelvin minus 81 degrees Fahrenheit (minus 63.1 degrees Celsius). Credit: NASA JPL/Heidar Thrastarson
On Sept. 8 at 10:59 a.m. EDT (1459 UTC), NASA’s Aqua satellite analyzed the storm using the Atmospheric Infrared Sounder or AIRS instrument. The AIRS imagery showed the strongest storms east of the center of circulation, and in fragmented bands west of the center where coldest cloud top temperatures as cold as or colder 210 Kelvin minus 81 degrees Fahrenheit (minus 63.1 degrees Celsius). NASA research has shown that cloud top temperatures that cold indicate strong storms that have the capability to create heavy rain.
By 11 p.m. EDT on Sept. 8, although Rene had weakened to a tropical depression, infrared imagery revealed a burst of strong convection with cloud tops colder than minus 80 degrees Celsius (minus 112 Fahrenheit) had developed over and to the west of the center, while a fragmented band of convection had formed in the northern semicircle.
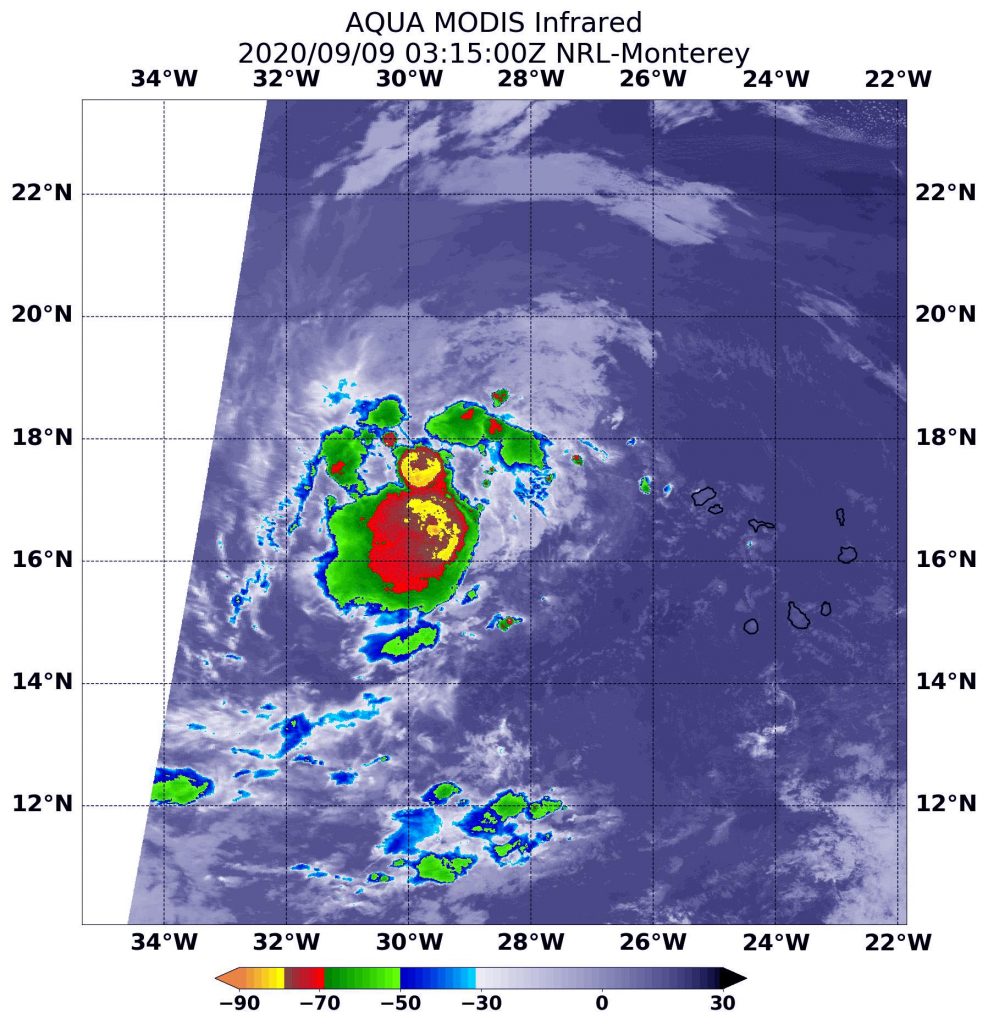
On Sept. 8 at 11:15 p.m. EDT (Sept. 9 at 0315 UTC), the Moderate Resolution Imaging Spectroradiometer or MODIS instrument that flies aboard NASA’s Aqua satellite used infrared light to analyze the strength of storms within Rene. MODIS showed that burst of convection and showed the most powerful thunderstorms had cloud top temperatures were as cold as or colder than minus 80 degrees Fahrenheit (minus 62.2 Celsius). Strong storms with cloud top temperatures as cold as minus 70 degrees Fahrenheit (minus 56.6. degrees Celsius) surrounded that area. NASA research has found that cloud top temperatures that cold indicate strong storms with the potential to generate heavy rainfall.
On Sept. 8 at 11:15 p.m. EDT (Sept. 9 at 0315 UTC), the MODIS instrument that flies aboard NASA’s Aqua satellite revealed the most powerful thunderstorms (yellow) had cloud top temperatures as cold as or colder than minus 80 degrees Fahrenheit (minus 62.2 Celsius). Strong storms with cloud top temperatures as cold as minus 70 degrees Fahrenheit (minus 56.6. degrees Celsius) surrounded that area. Credit: NASA/NRL
Rene’s outflow was symmetrical in all quadrants, but because scatterometer data showed that its winds dropped to 30 knots (35 mph/56 kph) per hour, it was classified as a tropical depression. Less than six hours later, infrared imagery showed Rene was becoming better organized and in an additional six hours, it would regain its strength.
On Sept. 9 at 11 a.m. EDT, Richard Pasch, Senior Hurricane Specialist at NOAA’s National Hurricane Center in Miami, Fla. noted, “Although easterly wind shear has been affecting the system, Rene is producing vigorous deep convection, along with a broad convective band, over its western semicircle. Scatterometer data indicate winds to 35 knots [40 mph/65 kph] over the northwestern quadrant, and therefore the system is again being designated as a tropical storm.”
Rene’s Status on Sept. 9
At 11 a.m. EDT (1500 UTC) on Sept. 9, Rene re-strengthened into a tropical storm. At that time, the center of Tropical Storm Rene was located near latitude 17.6 degrees north and longitude 31.5 degrees west. Rene is moving toward the west-northwest near 13 mph (20 kph). The estimated minimum central pressure is 1003 millibars. Satellite-derived wind data indicate that the maximum sustained winds have increased to near 40 mph (65 kph) with higher gusts.
Rene’s Forecast from NHC
The NHC forecasts additional strengthening during the next 48 hours and a motion toward the west-northwest is expected for the next couple of days, followed by a turn to the northwest.
NASA Researches Earth from Space
For more than five decades, NASA has used the vantage point of space to understand and explore our home planet, improve lives and safeguard our future. NASA brings together technology, science, and unique global Earth observations to provide societal benefits and strengthen our nation. Advancing knowledge of our home planet contributes directly to America’s leadership in space and scientific exploration.
Tropical Storm Paulette has run into wind shear that is pushing the bulk of clouds and showers away from its center of circulation, and that is apparent on infrared imagery from NASA.
On Sept. 9 at 12:50 a.m. EDT (0450 UTC) the MODIS instrument that flies aboard NASA’s Aqua satellite revealed the most powerful thunderstorms (yellow) were around Paulette’s center where cloud top temperatures were as cold as minus 80 degrees Fahrenheit (minus 62.2 Celsius). Strong storms (red) with cloud top temperatures as cold as minus 70 degrees Fahrenheit (minus 56.6. degrees Celsius) were pushed east-northeast of the center. Credit: NASA/NRL
A large upper-level trough or elongated area of low pressure is located to the northwest of Paulette, and this feature is producing 20 to 30 knots (23 to 35 mph/37 to 56 kph) of south-southwesterly wind shear over the cyclone. Wind shear occurs when winds blowing outside of a tropical cyclone at different levels of the atmosphere push against the tropical cyclone weakening it. The wind shear Paulette is experiencing is pushing the bulk of clouds to the north-northeast of the center.
NASA’s Infrared Data Reveals Heavy Rainmakers
Tropical cyclones are made up of hundreds of thunderstorms, and infrared data can show where the strongest storms are located. That is because infrared data provides temperature information, and the strongest thunderstorms that reach highest into the atmosphere have the coldest cloud top temperatures.
On Sept. 9 at 12:50 a.m. EDT (0450 UTC), the Moderate Resolution Imaging Spectroradiometer or MODIS instrument that flies aboard NASA’s Aqua satellite used infrared light to analyze the strength of storms within Paulette. MODIS found the most powerful thunderstorms were near Paulette’s center where cloud top temperatures were as cold as minus 80 degrees Fahrenheit (minus 62.2 Celsius). However, strong storms with cloud top temperatures as cold as minus 70 degrees Fahrenheit (minus 56.6. degrees Celsius) were being pushed east-northeast of those most powerful storms. NASA research has found that cloud top temperatures that cold indicate strong storms with the potential to generate heavy rainfall.
Hurricane Specialist Robbie Berg of NOAA’s National Hurricane Center in Miami, Fla. noted, “Morning visible satellite images show that Paulette’s center is located beneath a thin veil of cirrus clouds and displaced to the south of the deep convection.”
Paulette’s Status on Sept. 9
At 11 a.m. EDT (1500 UTC) on Sept. 9, the center of Tropical Storm Paulette was located near latitude 20.0 degrees north and longitude 46.5 degrees west. Paulette is 1,090 miles (1,755 km) east of the Northern Leeward Islands. Paulette is moving toward the west-northwest near 9 mph (15 kph). Maximum sustained winds are near 60 mph (95 kph) with higher gusts. The estimated minimum central pressure is 996 millibars.
Paulette’s Forecast from NHC
The NHC forecasts a general westward or west-northwestward motion through Friday, followed by a turn toward the northwest Friday night and Saturday. Some weakening is forecast during the next couple of days.
NHC said, “Swells generated by Paulette are expected to reach portions of the Leeward Islands Thursday night and Friday and will continue to spread westward to portions of the Greater Antilles, Bahamas, and Bermuda into the weekend. These swells are likely to cause life-threatening surf and rip current conditions.”
NASA Researches Earth from Space
For more than five decades, NASA has used the vantage point of space to understand and explore our home planet, improve lives and safeguard our future. NASA brings together technology, science, and unique global Earth observations to provide societal benefits and strengthen our nation. Advancing knowledge of our home planet contributes directly to America’s leadership in space and scientific exploration.
NASA-NOAA’s Suomi NPP satellite provided forecasters with a visible image of Tropical Storm Paulette as it tracked through the Central North Atlantic Ocean on Sept. 8. Paulette, like some other tropical storms this year, has broken a season record.
On Sept. 8, NASA-NOAA’s Suomi NPP satellite provided forecasters with a visible image of Tropical Storm Paulette in the Central North Atlantic Ocean. Credit: NASA Worldview, Earth Observing System Data and Information System (EOSDIS)
Tropical Depression 17 developed on Sunday, Sept. 6 by 11 p.m. EDT about 1,160 miles (1,865 km) west of the Cabo Verde Islands. Twelve hours later on Sept. 7 at 11 a.m. EDT, it had strengthened and organized into a tropical storm and was renamed Tropical Storm Paulette.
Record-Breaking Paulette
Paulette’s development set another hurricane season record. Paulette is the 16th named storm of the 2020 Atlantic hurricane season. It is also the earliest 16th named storm of any Atlantic season by 10 days. The previous record was Philippe, which formed on September 17, 2005.
Satellite Views of Paulette
On Sept. 8, the Visible Infrared Imaging Radiometer Suite (VIIRS) instrument aboard Suomi NPP provided a visible image of Paulette when it passed overhead. Forecasters looking at the VIIRS imagery noted that Paulette’s organization had noticeably improved since last night. The tropical storm is still sheared (vertical wind shear is pushing against the storm from the northeast), with its outflow restricted to the southwest.
The National Hurricane Center noted, “Overnight AMSU imagery indicated that convection was beginning to wrap around the western portion of its circulation.” The Advanced Microwave Sounding Unit (AMSU) is a multi-channel microwave radiometer installed on meteorological satellites. The instrument examines several bands of microwave radiation from the atmosphere to perform atmospheric sounding of temperature and moisture levels. That instrument flies aboard NASA’s Aqua satellite and NOAA weather satellites.
On Sept. 8 at 12:05 a.m. EDT (0405 UTC) NASA’s Aqua satellite analyzed Paulette using the Atmospheric Infrared Sounder or AIRS instrument. AIRS found coldest cloud top temperatures as cold as or colder than minus 63 degrees Fahrenheit (minus 53 degrees Celsius). NASA research has shown that cloud top temperatures that cold indicate strong storms that have the capability to create heavy rain.
On Sept. 8 at 12:05 a.m. EDT (0405 UTC) NASA’s Aqua satellite analyzed Paulette using the AIRS found coldest cloud top temperatures as cold as or colder than minus 63 degrees Fahrenheit (minus 53 degrees Celsius). Credit: NASA JPL/Heidar Thrastarson
Paulette’s Status
At 11 a.m. EDT (1500 UTC) on Sept. 8, the center of Tropical Storm Paulette was located near latitude 18.4 degrees north and longitude 43.3 degrees west. Paulette is moving toward the northwest near 6 mph (9 kph). The estimated minimum central pressure is 995 millibars. Maximum sustained winds are near 65 mph (100 kph) with higher gusts.
A turn toward the west-northwest or west with a slight increase in forward speed is expected during the next couple of days. Moderate additional strengthening is possible today and Paulette could be near hurricane strength by tonight, Sept. 8.
NASA Researches Tropical Cyclones
Hurricanes/tropical cyclones are the most powerful weather events on Earth. NASA’s expertise in space and scientific exploration contributes to essential services provided to the American people by other federal agencies, such as hurricane weather forecasting.
For more than five decades, NASA has used the vantage point of space to understand and explore our home planet, improve lives and safeguard our future. NASA brings together technology, science, and unique global Earth observations to provide societal benefits and strengthen our nation. Advancing knowledge of our home planet contributes directly to America’s leadership in space and scientific exploration.
Sep. 08, 2020 – NASA-NOAA Satellite Sees New Tropical Storm Rene Drenching Cabo Verde Islands
NASA-NOAA’s Suomi NPP satellite provided forecasters with a visible image of the latest tropical cyclone in the North Atlantic hurricane season. Tropical Storm Rene was bringing tropical-storm force winds and rain to the Cabo Verde Islands.
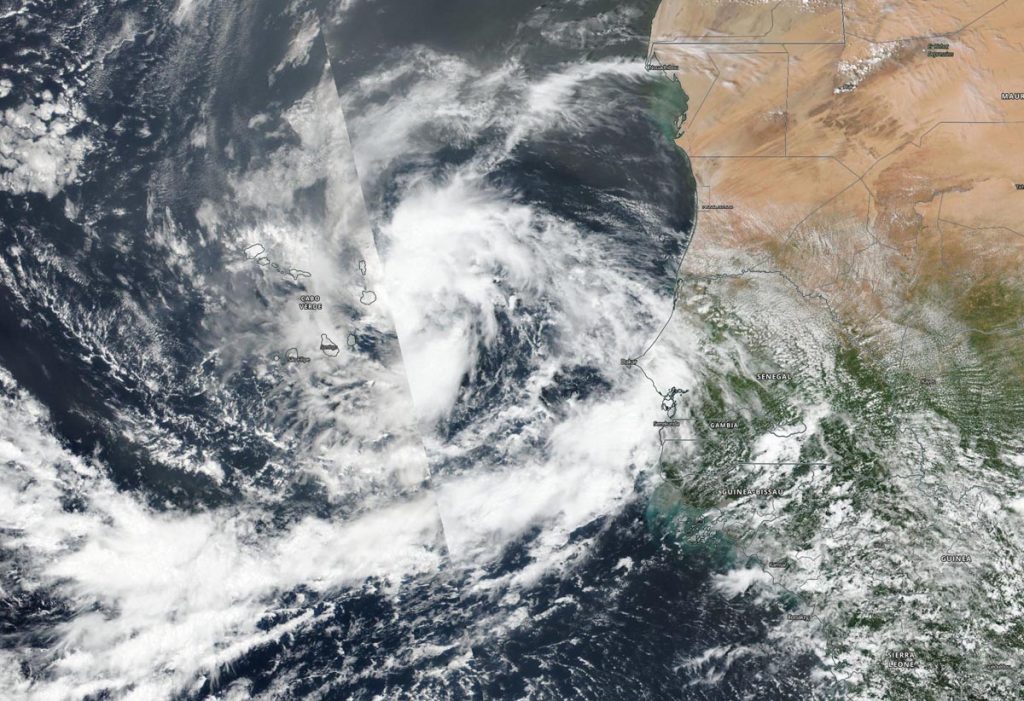
On Sept. 8, NASA-NOAA’s Suomi NPP satellite provided forecasters with a visible image of Tropical Storm Rene over the Cabo Verde islands in the eastern North Atlantic Ocean. The African coast is seen to the east (right). Credit: NASA Worldview, Earth Observing System Data and Information System (EOSDIS)
Cabo Verde, also known as Cape Verde, is a country consisting of a chain of islands, located about 385 miles (620 km) off the west coast of Africa.
Tropical Depression 18 developed on Monday, Sept. 7 in the far eastern North Atlantic Ocean, about 250 miles (405 km) east-southeast of the Cabo Verde Islands. By 5 p.m. EDT (2100 UTC) on Sept. 7, the depression strengthened into a tropical storm and was renamed Rene.
On Sept. 8, a Tropical Storm Warning was in effect for the Cabo Verde Islands. The Visible Infrared Imaging Radiometer Suite (VIIRS) instrument aboard Suomi NPP provided a visible image of Rene when it passed overhead. The imagery showed that the tropical storm has a well-defined circulation. However, the banding of thunderstorms around the center has shown no increased organization since Sept. 7.
At 11 a.m. EDT (1500 UTC) on Sept. 8, Tropical Storm Rene was bringing tropical-storm force winds and heavy rain to the western Cabo Verde Islands. The center of Tropical Storm Rene was located near latitude 16.5 degrees north and longitude 26.5 degrees west. Rene was moving toward the west near 16 mph (26 kph), and a motion toward the west to west-northwest is expected over the next two or three days. Maximum sustained winds are near 40 mph (65 kph) with higher gusts. The estimated minimum central pressure is 1001 millibars.
On the forecast track, the center of Rene will move away from the Cabo Verde Islands later today. Little change in strength is expected today, followed by gradual strengthening on Thursday and Friday. Rene is forecast to become a hurricane in a couple of days.
NASA Researches Tropical Cyclones
Hurricanes/tropical cyclones are the most powerful weather events on Earth. NASA’s expertise in space and scientific exploration contributes to essential services provided to the American people by other federal agencies, such as hurricane weather forecasting.
For more than five decades, NASA has used the vantage point of space to understand and explore our home planet, improve lives and safeguard our future. NASA brings together technology, science, and unique global Earth observations to provide societal benefits and strengthen our nation. Advancing knowledge of our home planet contributes directly to America’s leadership in space and scientific exploration.
Sep. 08, 2020 – NASA Satellites Catch Typhoon Haishen Before and After Landfall
Formerly a typhoon, Tropical Storm Haishen made landfall in South Korea on Monday, Sept. 2 and continued moving north toward China. NASA’s Aqua satellite provided an infrared view of Haishen as a typhoon before landfall and a visible image after landfall as an extra-tropical storm.
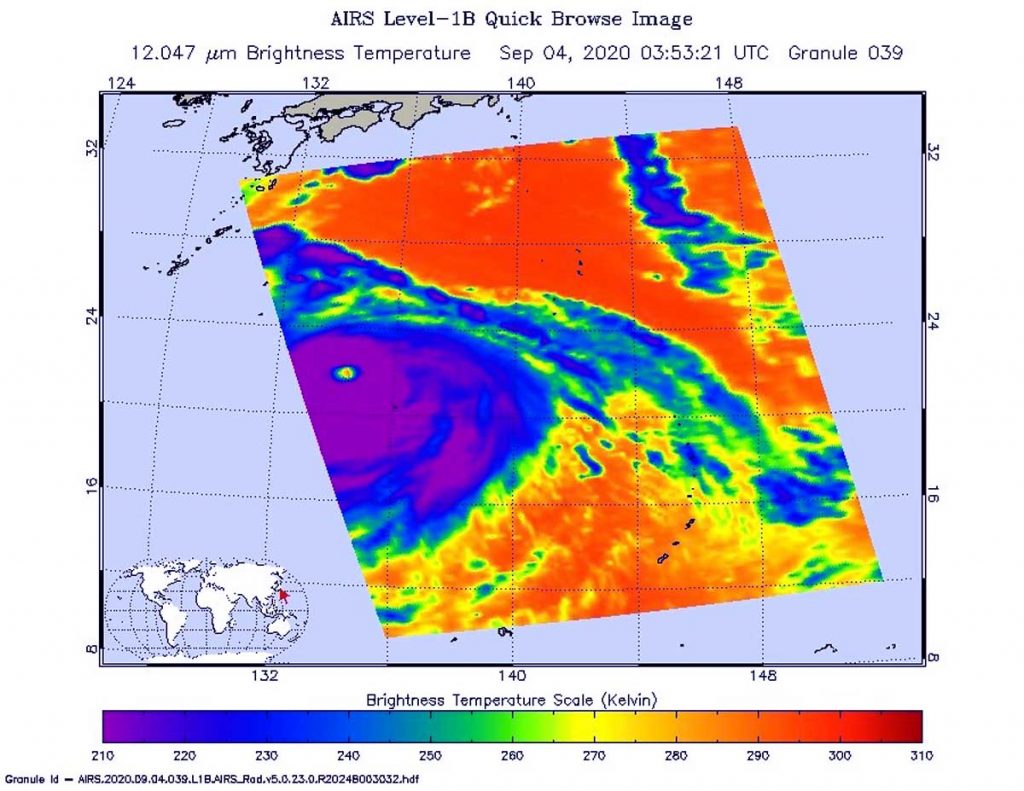
On Sept. 3 at 11:53 p.m. EDT (Sept. 4 at 0353) NASA’s Aqua satellite analyzed Typhoon Haishen using the AIRS found coldest cloud top temperatures as cold as or colder than minus 80 degrees Fahrenheit (minus 62.2 degrees Celsius) around a very clear and open eye. Credit: NASA JPL/Heidar Thrastarson
Infrared View of Haishen as a Typhoon
One of the ways NASA researches tropical cyclones is using infrared data that provides temperature information. The AIRS instrument aboard NASA’s Aqua satellite captured a look at those temperatures in Haishen and gave insight into the size of the storm and its rainfall potential.
Cloud top temperatures provide information to forecasters about where the strongest storms are located within a tropical cyclone. Tropical cyclones do not always have uniform strength, and some sides have stronger sides than others. The stronger the storms, the higher they extend into the troposphere, and they have the colder cloud temperatures. NASA provides that data to forecasters so they can incorporate in their forecasts.
On Sept. 3 at 11:53 p.m. EDT (Sept. 4 at 0353), NASA’s Aqua satellite analyzed the storm using the Atmospheric Infrared Sounder or AIRS instrument. At the time, Haishen was a Super Typhoon with maximum sustained winds near 135 knots (155 mph/250 kph) and strengthened to a Category 5 hurricane/typhoon later that day.
AIRS found coldest cloud top temperatures as cold as or colder than minus 80 degrees Fahrenheit (minus 62.2 degrees Celsius) around a very clear and open eye. NASA research has shown that cloud top temperatures that cold indicate strong storms that have the capability to create heavy rain.
Haishen Batters Kyushu, Japan
Before Typhoon Haishen made landfall, it moved past southwestern Japan, knocking out power to around 475,000 houses in Kyushu. Haishen brought very heavy rain, storm surge, flooding and landslides as it moved west of Kyushu toward South Korea. In Japan, over 100 people were reported injured, two people died and four people were reported missing.
Typhoon Haishen made its landfall in South Korea’s southeastern coast on Monday, Sept. 7.
Haishen’s Final Bulletin
At 11 a.m. EDT (1500 UTC) on Sept. 7, the Joint Typhoon Warning Center (JWTC) issued their final bulletin on Tropical Storm Haishen. At that time, Haishen was located near latitude 40.7 degrees north and longitude 128.9 degrees east, about 233 miles north-northeast of Osan Air Base, South Korea. Haishen was moving quickly to the north at 24 knots (28 mph/44 kph). Maximum sustained winds were near 35 knots (40 mph/65 kph). Haishen was moving north and is becoming extra-tropical.
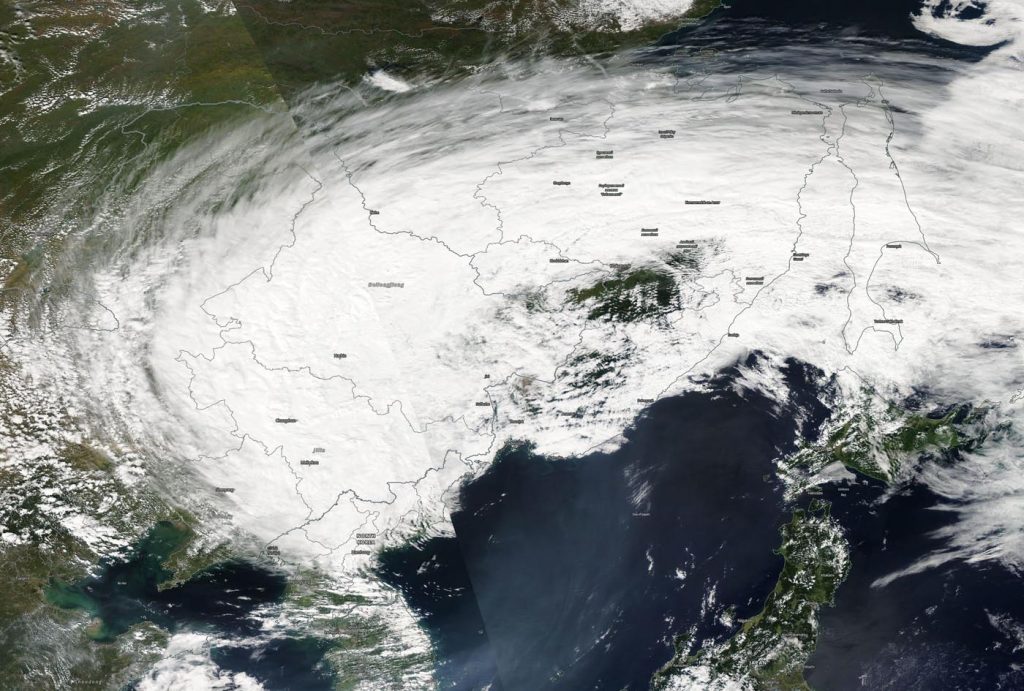
On Sept. 7 at 11:40 p.m. EDT (0340 UTC, Sept. 8), the Moderate Imaging Spectroradiometer or MODIS instrument that flies aboard NASA’s Aqua satellite provided a visible image of Extra-Tropical Storm Haishen over eastern China. Haishen’s eastern quadrant extended over the northern Sea of Japan. Credit: NASA/NRL
A Visible Image of an Extra-tropical Storm
On Sept. 7 at 11:40 p.m. EDT (0340 UTC, Sept. 8), the Moderate Resolution Imaging Spectroradiometer or MODIS instrument that flies aboard NASA’s Aqua satellite provided a visible image of Extra-Tropical Storm Haishen over eastern China. Haishen’s eastern quadrant extended over the northern Sea of Japan.
After landfall in South Korea and a track north to China, Haishen moved over China’s Jilin Province as an extra-tropical storm. The China Meteorological Department said Haishen started to move out of the Yanbian Korean Autonomous Prefecture and into Heilongjiang Province at noon (local time) on Tuesday.
What does Extra-tropical Mean?
When a storm becomes extra-tropical, it means that a tropical cyclone has lost its “tropical” characteristics. The National Hurricane Center defines “extra-tropical” as a transition that implies both poleward displacement (meaning it moves toward the north or south pole) of the cyclone and the conversion of the cyclone’s primary energy source from the release of latent heat of condensation to baroclinic (the temperature contrast between warm and cold air masses) processes. It is important to note that cyclones can become extratropical and retain winds of hurricane or tropical storm force.
Tropical cyclones/hurricanes are the most powerful weather events on Earth. NASA’s expertise in space and scientific exploration contributes to essential services provided to the American people by other federal agencies, such as hurricane weather forecasting.
Sep. 04, 2020 – NASA Satellite Finds Haishen Now a Super Typhoon
NASA-NOAA’s Suomi NPP satellite passed over the Philippine Sea on Sept. 4 and provided a visible image of Haishen that had strengthened into a super typhoon.
NASA-NOAA’s Suomi NPP satellite captured a visible image of Super Typhoon Haishen moving through the Philippine Sea on Sept. 4. Credit: NASA Worldview, Earth Observing System Data and Information System (EOSDIS)
The Visible Infrared Imaging Radiometer Suite (VIIRS) instrument aboard Suomi NPP provided a visible image of Haishen that revealed a large, circular, organized structure of strong thunderstorms circling the open eye. The eyewall, the strong thunderstorms that circle the open eye, is estimated to be 81 nautical miles-wide. Satellite data indicate the eye is about 31 nautical miles wide. The storm is at least 450 miles in diameter, as tropical storm-force winds extend up to 225 miles from the center.
The Joint Typhoon Warning Center (JTWC) in Honolulu, Hawaii noted at 5 a.m. EDT (0900 UTC) on Sept. 4, that Super Typhoon Haishen had maximum sustained winds near 135 knots (155 mph/250 kph). It is currently a Category 4 hurricane/typhoon. It was centered near latitude 22.2 degrees north and longitude 134.3 degrees east, about 439 nautical miles southeast of Kadena Air Base, Okinawa Island, Japan. The storm was moving to the northwest.
JTWC forecasters expect Haishen will turn to the north-northwest while intensifying more. It is expected to peak later on Sept. 4 with sustained winds near 140 knots (161 mph/259 kph) which would make it equivalent to a Category 5 hurricane on the Saffir-Simpson Hurricane Wind Scale. JWTC forecasts Haishen to pass west of Kyushu, Japan and make landfall in South Korea after 3 days.
NASA Researches Tropical Cyclones
Hurricanes/tropical cyclones are the most powerful weather events on Earth. NASA’s expertise in space and scientific exploration contributes to essential services provided to the American people by other federal agencies, such as hurricane weather forecasting.
For more than five decades, NASA has used the vantage point of space to understand and explore our home planet, improve lives and safeguard our future. NASA brings together technology, science, and unique global Earth observations to provide societal benefits and strengthen our nation. Advancing knowledge of our home planet contributes directly to America’s leadership in space and scientific exploration.
Sep. 04, 2020 – NASA’s Aqua Satellite Finds Wind Shear Not Letting Up on Omar
Tropical Depression Omar is one stubborn storm. Since it developed early in the week, it was being affected by wind shear. That wind shear has not let up by the week’s end, and NASA satellite imagery showed the bulk of storms were being pushed to the southeast of the center. Yet, he persists.
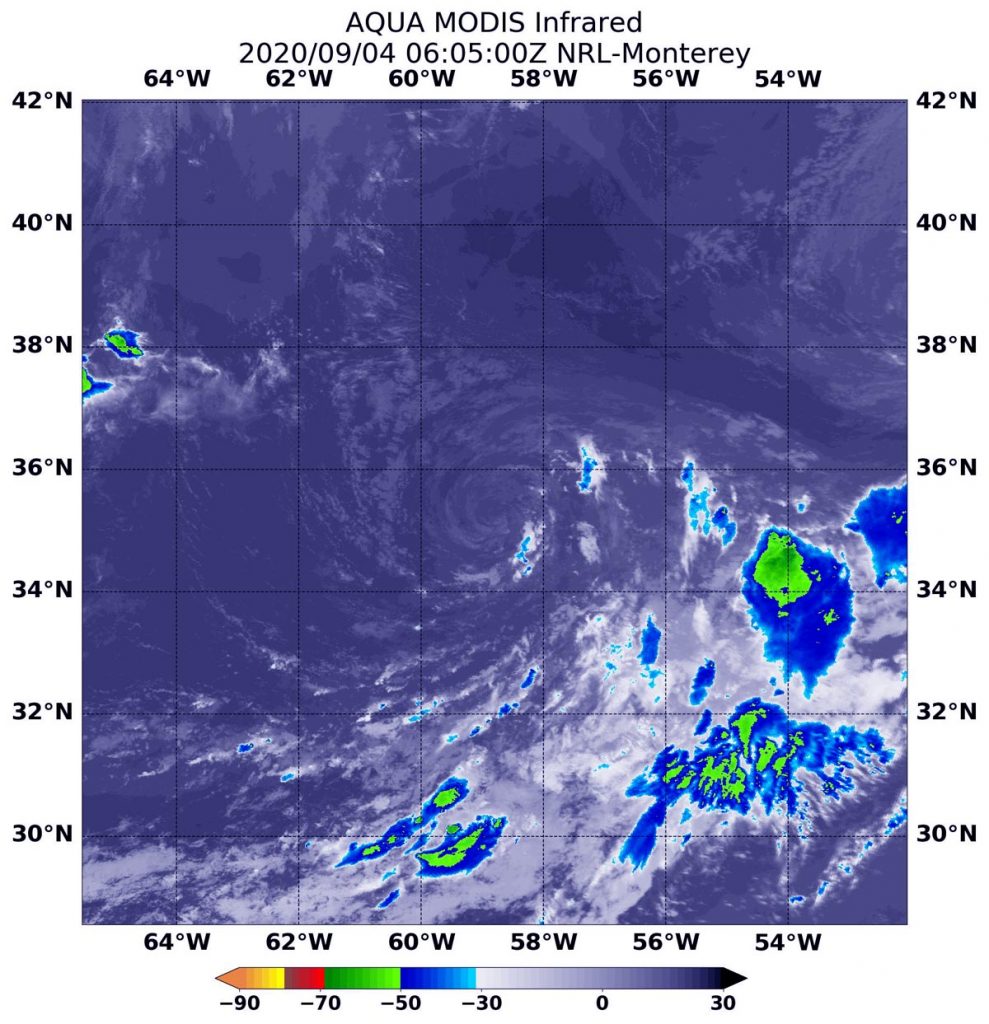
On Sept. 4 at 2:05 a.m. EDT (0605 UTC), the MODIS instrument that flies aboard NASA’s Aqua satellite gathered infrared data on Omar that confirmed wind shear was adversely affecting the storm. Persistent north-northwesterly vertical wind shear showed strongest storms (yellow) pushed southeast of the center where cloud top temperatures are as cold as minus 50 degrees Fahrenheit (minus 45.5 Celsius). Credit: NASA/NRL
NASA’s Aqua Satellite Reveals Effects of Wind Shear
NASA’s Aqua satellite uses infrared light to analyze the strength of storms by providing temperature information about the system’s clouds. The strongest thunderstorms that reach high into the atmosphere have the coldest cloud top temperatures.
On Sept. 4 at 2:05 a.m. EDT (0605 UTC), the Moderate Resolution Imaging Spectroradiometer or MODIS instrument that flies aboard NASA’s Aqua satellite gathered infrared data on Omar that confirmed wind shear was still adversely affecting the storm. The center of circulation appears to be a swirl of clouds devoid of precipitation. In addition, satellite data reveals that some dry air is also being drawn into the circulation, which is further inhibiting the development of thunderstorms.
The only precipitation was in an area of fragmented storms pushed to the southeast of the center, as a result of strong north-northwesterly vertical wind shear. Those storms had cloud top temperatures as cold as minus 50 degrees Fahrenheit (minus 45.5 Celsius). Satellite imagery also shows the low-level circulation center became exposed.
Wind Shear Affecting Omar
The shape of a tropical cyclone provides forecasters with an idea of its organization and strength. When outside winds batter a storm, it can change the storm’s shape and push much of the associated clouds and rain to one side of it. That is what wind shear does.
In general, wind shear is a measure of how the speed and direction of winds change with altitude. Tropical cyclones are like rotating cylinders of winds. Each level needs to be stacked on top each other vertically in order for the storm to maintain strength or intensify. Wind shear occurs when winds at different levels of the atmosphere push against the rotating cylinder of winds, weakening the rotation by pushing it apart at different levels.
Omar’s Status on Friday, September 4, 2020
At 5 a.m. EDT (0900 UTC) on Sept. 4, the center of Tropical Depression Omar was located near latitude 35.3 degrees north and longitude 58.5 degrees west. That is about 415 miles (670 km) east-northeast of Bermuda. The depression is moving toward the east near 7 mph (11 km/h) and a turn toward the northeast with an increase in forward speed is expected over the next couple of days. Maximum sustained winds are near 30 mph (45 km/h) with higher gusts.
Forecast for Omar
The National Hurricane Center noted if the lack of convection continues, Omar will be declared a remnant low-pressure system later today, Sept. 4. The cyclone is expected to become absorbed by a frontal trough (elongated area of low pressure) within a couple of days.
NASA Researches Tropical Cyclones
Hurricanes/tropical cyclones are the most powerful weather events on Earth. NASA’s expertise in space and scientific exploration contributes to essential services provided to the American people by other federal agencies, such as hurricane weather forecasting.
For more than five decades, NASA has used the vantage point of space to understand and explore our home planet, improve lives and safeguard our future. NASA brings together technology, science, and unique global Earth observations to provide societal benefits and strengthen our nation. Advancing knowledge of our home planet contributes directly to America’s leadership in space and scientific exploration.
Sep. 03, 2020 – NASA Finds Maysak Becoming Extra-Tropical
NASA-NOAA’s Suomi NPP satellite provided forecasters with a visible image of former Typhoon Maysak, now an extra-tropical storm. Wind shear continued pushing the bulk of the storm’s clouds to the northwest.
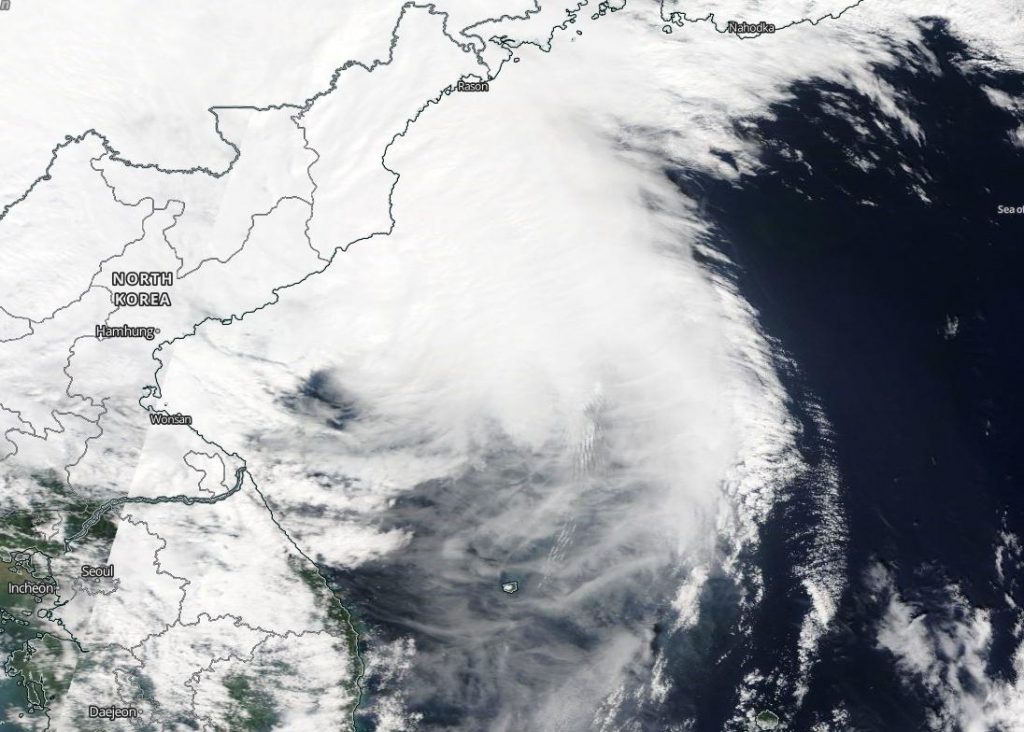
On Sept. 3, NASA-NOAA’s Suomi NPP satellite revealed southeasterly wind shear battering Maysak had exposed the center of circulation and pushed the bulk of clouds and precipitation to the northwest of the center. The storm extended from the Korean Peninsula into the Sea of Japan. Credit: NASA Worldview, Earth Observing System Data and Information System (EOSDIS)
Maysak’s Landfall
Maysak made landfall on Sept. 2 at 1 p.m. EDT (1700 UTC) about 12 miles west of Busan, South Korea with maximum sustained surface winds of 64 knots (74 mph/119 kph).
Typhoon Maysak’s Final Status on Sept. 2
On Sept. 2 at 5 p.m. EDT (2100 UTC), the Joint Typhoon Warning Center (JTWC) issued their final bulletin on Maysak. At that time, Maysak was located near latitude 36.9 degrees north and longitude 128.9 degrees east. That is about 24 nautical miles north-northwest of Busan, South Korea. Maximum sustained surface winds were near 64 knots (74 mph/119 kph). Maysak was moving to the north-northeast. At the time, the JTWC noted, “Animated enhanced infrared satellite imagery and radar imagery indicate tightly-curved banding wrapping into a defined low-level circulation center.”
Maysak was undergoing extra-tropical transition late on Sept 2. It is embedded within the leading edge of a deep mid-latitude shortwave trough (elongated area of low pressure).
NASA’s Satellite View on Sept. 3
On Sept. 3, the Visible Infrared Imaging Radiometer Suite (VIIRS) instrument aboard Suomi NPP revealed southeasterly wind shear battering Maysak had exposed the center of circulation and pushed the bulk of clouds and precipitation to the northwest of the center. The storm extended from the Korean Peninsula into the Sea of Japan.
On Sept. 3, the system completed extra-tropical transition and gained frontal characteristics.
What is Wind Shear?
In general, wind shear is a measure of how the speed and direction of winds change with altitude. Tropical cyclones are like rotating cylinders of winds. Each level needs to be stacked on top each other vertically in order for the storm to maintain strength or intensify. Wind shear occurs when winds at different levels of the atmosphere push against the rotating cylinder of winds, weakening the rotation by pushing it apart at different levels.
What does Extra-tropical Mean?
When a storm becomes extra-tropical it means that a tropical cyclone has lost its “tropical” characteristics. The National Hurricane Center defines “extra-tropical” as a transition that implies both poleward displacement (meaning it moves toward the north or south pole) of the cyclone and the conversion of the cyclone’s primary energy source from the release of latent heat of condensation to baroclinic (the temperature contrast between warm and cold air masses) processes. It is important to note that cyclones can become extratropical and still retain winds of hurricane or tropical storm force.
This system is forecast to deepen as a storm-force extra-tropical low-pressure area over North Korea and China.
NASA Researches Tropical Cyclones
Hurricanes/tropical cyclones are the most powerful weather events on Earth. NASA’s expertise in space and scientific exploration contributes to essential services provided to the American people by other federal agencies, such as hurricane weather forecasting.
For more than five decades, NASA has used the vantage point of space to understand and explore our home planet, improve lives and safeguard our future. NASA brings together technology, science, and unique global Earth observations to provide societal benefits and strengthen our nation. Advancing knowledge of our home planet contributes directly to America’s leadership in space and scientific exploration.