Oct. 30, 2019 – NASA Finds Tropical Storm Matmo Consolidating off Vietnam Coast
NASA-NOAA’s Suomi NPP satellite captured an image of Tropical Storm Matmo as it developed in the South China Sea, off the coast of Vietnam. The storm is expected to make a landfall in central southeastern Vietnam later on Oct. 30.
NASA-NOAA’s Suomi NPP satellite passed over Tropical Storm Matmo in the South China Sea on Oct. 30 as it was nearing the coast of southeastern central Vietnam. Credit: NASA Worldview, Earth Observing System Data and Information System (EOSDIS)
Visible imagery from NASA satellites help forecasters understand if a storm is organizing or weakening. The Visible Infrared Imaging Radiometer Suite (VIIRS) instrument aboard Suomi NPP provided a visible image of Matmo on Oct. 30 and found the storm taking on a much more rounded shape than the previous day.
The shape of the storm is a clue to forecasters that a storm is either strengthening or weakening. If a storm takes on a more rounded shape it is getting more organized and strengthening. Conversely, if it becomes less rounded or elongated, it is a sign the storm is weakening.
At 5 a.m. EDT (0900 UTC) on Oct. 30, the center of Matmo was near latitude 13.2 degrees north and longitude 111.0 degrees east. The post-tropical cyclone was moving toward the west-northwest. Maximum sustained winds associated with this system are near 46 mph (40 knots/74 kph) with higher gusts.
Vietnam’s National Centre for Hydro-Meteorological Forecasting (NCHMF) has posted a tropical storm warning for southeast central Vietnam. Matmo is expected to make landfall near Nha Trang. Nha Trang lies on the coast and is the capital of the Khanh Hoa Province, on the South Central Coast of Vietnam.
The Joint Typhoon Warning Center expects that Matmo will move west-northwest to make landfall in Vietnam later in the day.
Hurricanes are the most powerful weather event on Earth. NASA’s expertise in space and scientific exploration contributes to essential services provided to the American people by other federal agencies, such as hurricane weather forecasting.
For updated forecasts from the National Centre for Hydro-Meteorological Forecasting (NCHMF), visit: http://www.nchmf.gov.vn/
Oct. 29, 2019 – NASA Identifies a Strong Arabian Sea Tropical Cyclone Kyarr
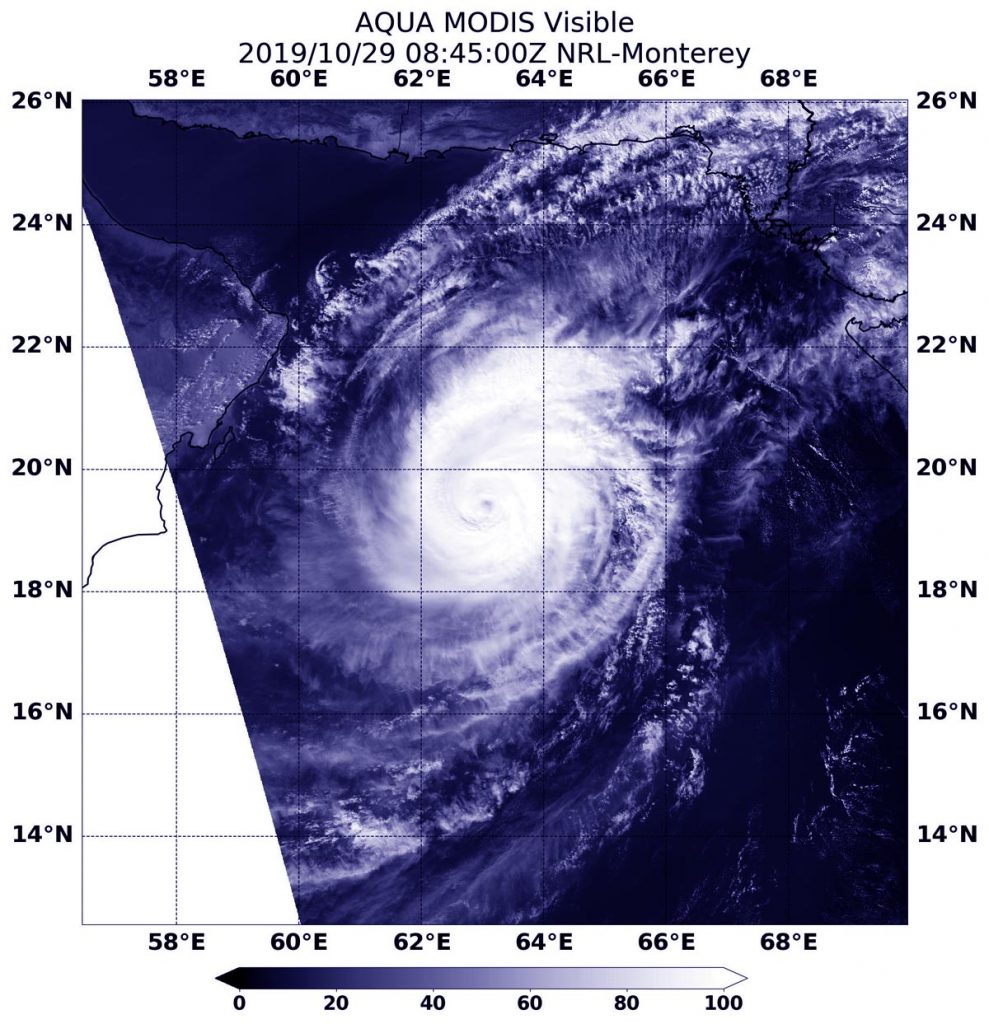
NASA’s Aqua satellite captured an image of Tropical Cyclone Kyarr in the Arabian Sea is it headed west toward Oman. The visible image showed a powerful and organized storm with an eye.
On Oct 29 at 4:45 a.m., EDT (0845 UTC) the MODIS instrument that flies aboard NASA’s Aqua satellite provided a visible image of Tropical Cyclone Kyarr in the central Arabian Sea. Credit: NASA Worldview
On Oct 29 at 4:45 a.m. EDT (0845 UTC), the Moderate Imaging Spectroradiometer or MODIS instrument that flies aboard NASA’s Aqua satellite provided a visible image of Kyarr. The MODIS image showed the cyclone continues to produce a large area of deep convection and strong thunderstorms around the visible eye. Satellite imagery showed the ragged eye is about 19 nautical miles in diameter. Bands of thunderstorms were wrapping into the low-level center from the north and east of the center.
At 5 a.m. EDT (0900 UTC), the center of Tropical Cyclone Kyarr was located near latitude 19.4 degrees north and longitude 63.1 degrees east. That is about 257 nautical miles east-southeast of Masirah Island. The storm has tracked northwestward. However, two large areas of high pressure are expected to turn the storm to the southwest. Maximum sustained winds were near 115 knots (132 mph/213 kph) and the storm is on a weakening trend.
Kyarr is forecast to turn to the southwest and parallel the coast of Oman and Yemen, move through the opening of the Gulf of Aden, pass just west of Socotra Island and make landfall in Somalia.
NASA’s Aqua satellite is one in a fleet of NASA satellites that provide data for hurricane research.
Hurricanes are the most powerful weather event on Earth. NASA’s expertise in space and scientific exploration contributes to essential services provided to the American people by other federal agencies, such as hurricane weather forecasting.
Oct. 28, 2019 – NASA Finds Arabian Sea Tropical Cyclone Kyarr’s Heavy Rainfall
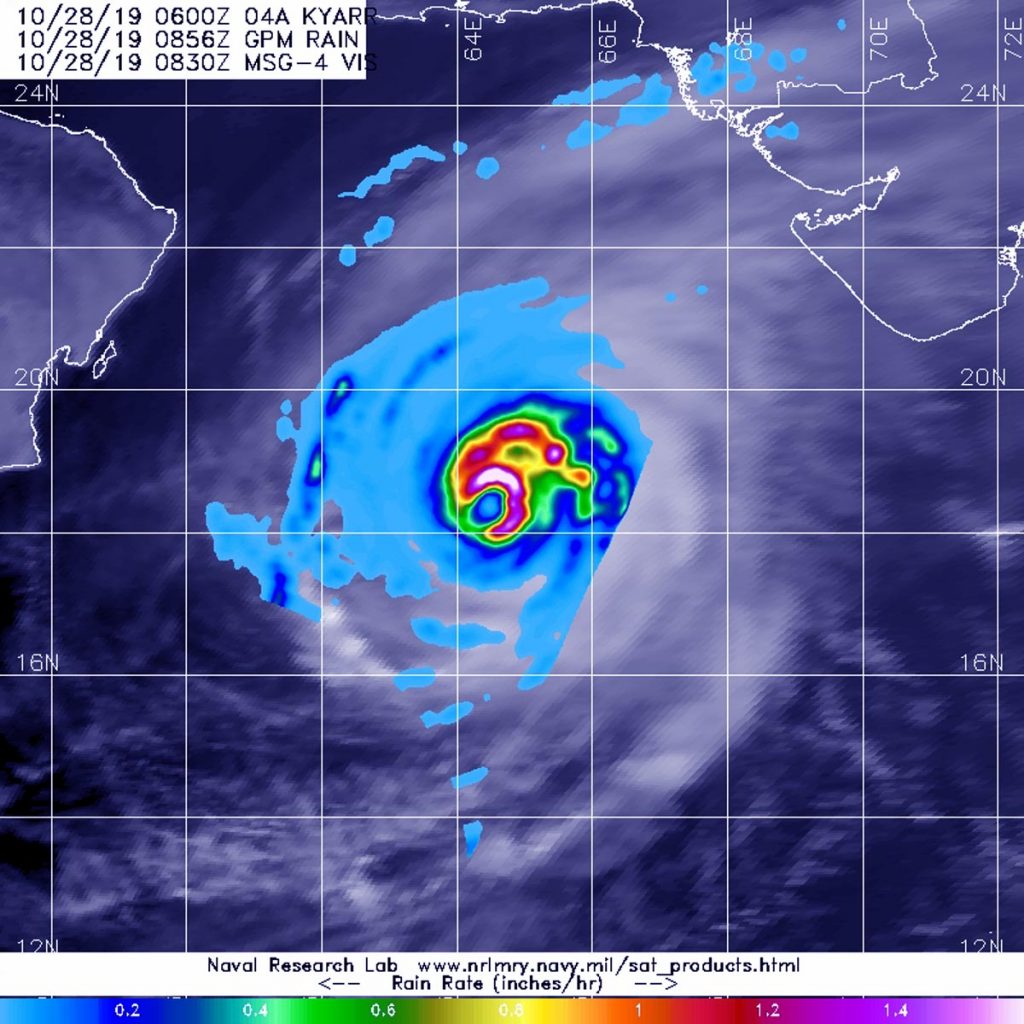
Tropical Cyclone Kyarr is moving through the central Arabian Sea and NASA provided forecasters with an analysis of rainfall rates occurring in the powerful tropical cyclone.
The GPM’s core satellite passed over Tropical Cyclone Kyarr in the Arabian Sea, Northern Indian Ocean on Oct. 28 at 4:56 a.m. EDT (0856 UTC). GPM found the heaviest rainfall stretching from the northern to the eastern side of the storm where it was falling at a rate of over 40 mm (about 1.6 inches) per hour. Credit: NASA/JAXA/NRL
NASA has the unique capability of peering under the clouds in storms and measuring the rate in which rain is falling. Global Precipitation Measurement mission or GPM passed over Kyarr from its orbit in space and measured rainfall rates throughout the storm.
GPM passed over Tropical Cyclone Kyarr in the Arabian Sea, Northern Indian Ocean on Oct. 28 at 4:56 a.m. EDT (0856 UTC). GPM found the heaviest rainfall stretching from the northern to the eastern side of the storm where it was falling at a rate of over 40 mm (about 1.6 inches) per hour. Forecasters incorporate the rainfall data into their forecasts.
At 11 a.m. EDT (1500 UTC) on Oct. 28, the Joint Typhoon Warning Center or JTWC noted that Kyarr was located near latitude 18.5 degrees north and longitude 64.4 degrees east, about 337 miles east-southeast of Masirah Island, Oman. Kyarr was moving to the west-northwest and had maximum sustained winds 130 knots (150 mph/241 kph). That means that Kyarr is a major hurricane on the Saffir-Simpson Hurricane Wind scale and is equivalent to a Category 4 hurricane.
On Oct. 27, 2019 at 5:05 p.m. EDT (2105 UTC), the AIRS instrument aboard NASA’s Aqua satellite provided a false-color image of cloud top temperatures using infrared data. Coldest temperatures, as cold as or colder than minus 63 degrees Fahrenheit (minus 53 degrees Celsius) appear in purple. Credit: NASA JPL/Heidar Thrastarson
Kyarr is moving west and is forecast to start weakening within 24 hours. The storm is then forecast to turn to the west-southwest while slowly weakening as it approaches the Gulf of Aden.
The previous day, on Oct. 27, 2019 at 5:05 p.m. EDT (2105 UTC), the AIRS instrument aboard NASA’s Aqua satellite provided cloud top temperatures using infrared data. Coldest temperatures, as cold as or colder than minus 63 degrees Fahrenheit (minus 53 degrees Celsius) appeared around the eye. NASA research has shown that storms with cloud top temperatures that cold can produce heavy rain, and that heavy rain was seen in the GPM image taken on Oct. 28. The image was created at NASA’s Jet Propulsion Laboratory in Pasadena, California.
Hurricanes are the most powerful weather event on Earth. NASA’s expertise in space and scientific exploration contributes to essential services provided to the American people by other federal agencies, such as hurricane weather forecasting.
Both the Japan Aerospace Exploration Agency, JAXA and NASA manage GPM.
Oct. 28, 2019 – NASA Tracking Eastern Atlantic’s Late Season Tropical Storm Pablo
Pablo is a tropical cyclone that formed late on Oct. 25 and strengthened into a hurricane for a short time before weakening again into a tropical storm. NASA’s Aqua and Terra satellites provided imagery that covered that fast transition. Pablo’s formation was also interesting because it formed within a larger system.
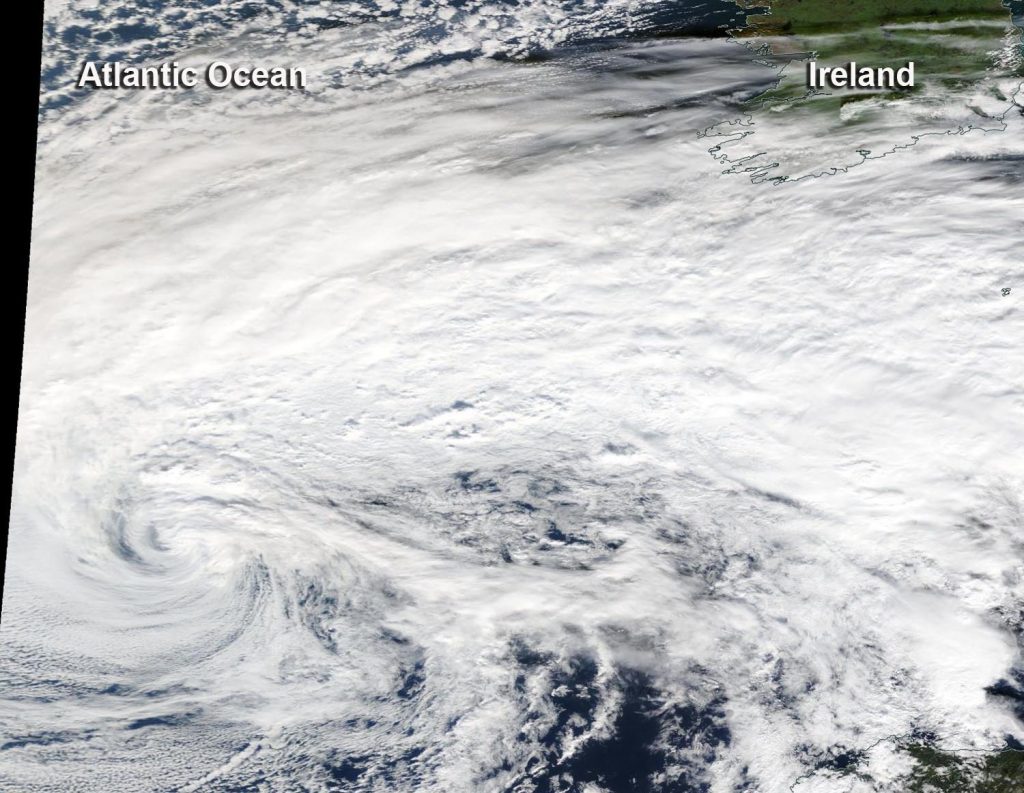
When NASA’s Terra satellite passed over the eastern Atlantic Ocean on Oct. 28, it found Tropical Storm Pablo to the west of Ireland. Pablo’s center of circulation can be seen within the larger low-pressure area. Credit: NASA Worldview
On Oct. 25, the National Hurricane Center or NHC noted that a tropical cyclone has formed within a larger extratropical cyclone in the northeastern Atlantic. This is not unique and has occurred several times in the past, primarily during the latter part of the hurricane season. Pablo formed as a very small-scale tropical cyclone, but had a well-defined but small circulation with 40 knots winds embedded within the larger low-pressure area.
By 5 p.m. EDT on Oct. 25, Tropical Storm Pablo formed about 325 miles west-southwest of the Azores islands.
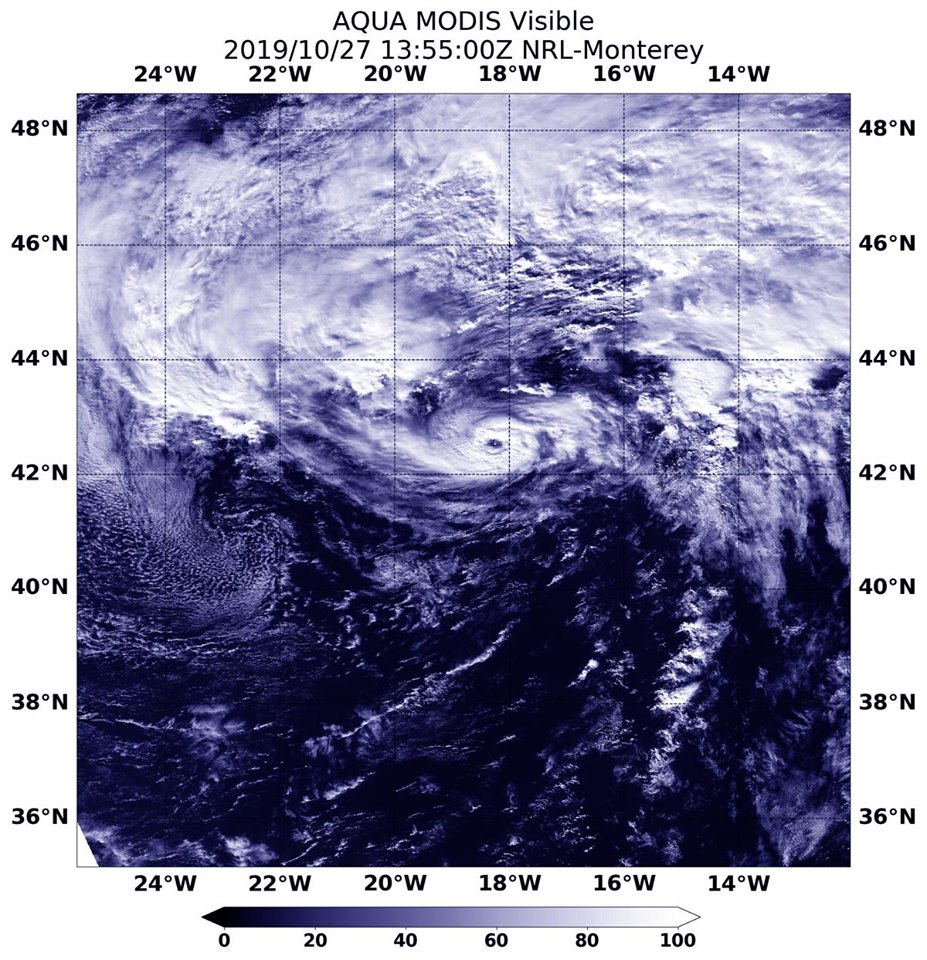
On Oct. 27, NASA’s Aqua satellite found Pablo had strengthened into a hurricane. NASA’s Aqua satellite passed over Hurricane Pablo on Sunday, Oct. 27 at 9:55 a.m. EDT (1355 UTC) and captured a visible image of the compact storm that showed the storm had a clear eye. Pablo was a small tropical cyclone with hurricane-force winds extending outward up to 10 miles (20 km) from the center and tropical-storm-force winds extending outward up to 80 miles (130 km).
NASA’s Aqua satellite passed over Hurricane Pablo on Sunday, Oct. 27 at 9:55 a.m. EDT (1355 UTC) and captured a visible image of the compact storm that showed the storm had a clear eye. Pablo was a small tropical cyclone, with hurricane-force winds extending outward up to 10 miles (20 km) from the center. Credit: NASA/NRL
At 11 a.m. EDT (1500 UTC) on Oct. 27, the center of Hurricane Pablo was located near latitude 42.8 degrees north and longitude 18.3 degrees west. Maximum sustained winds had increased to near 75 mph (120 kph) with higher gusts. The estimated minimum central pressure is 983 millibars.
On Oct. 28 at 5 a.m. EDT (0900 UTC), the center of Tropical Storm Pablo was located near latitude 46.6 degrees north and longitude 17.5 degrees west. That is about 725 miles (1,165 km) northeast of Lajes Air Base in the Azores. Pablo was moving toward the north near 5 mph (7 kph). Maximum sustained winds were near 50 mph (85 kph) with higher gusts.
When NASA’s Terra satellite passed over the eastern Atlantic Ocean on Oct. 28, the Moderate Resolution Imaging Spectroradiometer found Tropical Storm Pablo to the west of Ireland. Pablo’s center of circulation was visible as a circular area of clouds within the larger low-pressure area. Satellite imagery revealed that thunderstorm development within the storm decreased significantly in both coverage and vertical depth during the morning of Oct. 28, and the system barely met the criterion to be classified as a tropical cyclone. The remaining thunderstorm development and convection (rising air that forms the thunderstorms that make up a tropical cyclone) that does remain is limited to the southeastern quadrant.
Slow weakening is expected during the next 24 hours, and the NHC forecast notes that Pablo should transition to a post-tropical cyclone later on Oct. 28 and dissipate on Tuesday, Oct. 29.
Hurricanes are the most powerful weather event on Earth. NASA’s expertise in space and scientific exploration contributes to essential services provided to the American people by other federal agencies, such as hurricane weather forecasting.
Oct. 28, 2019 – NASA Sees Tropical Cyclone Olga Merge with a Cold Front
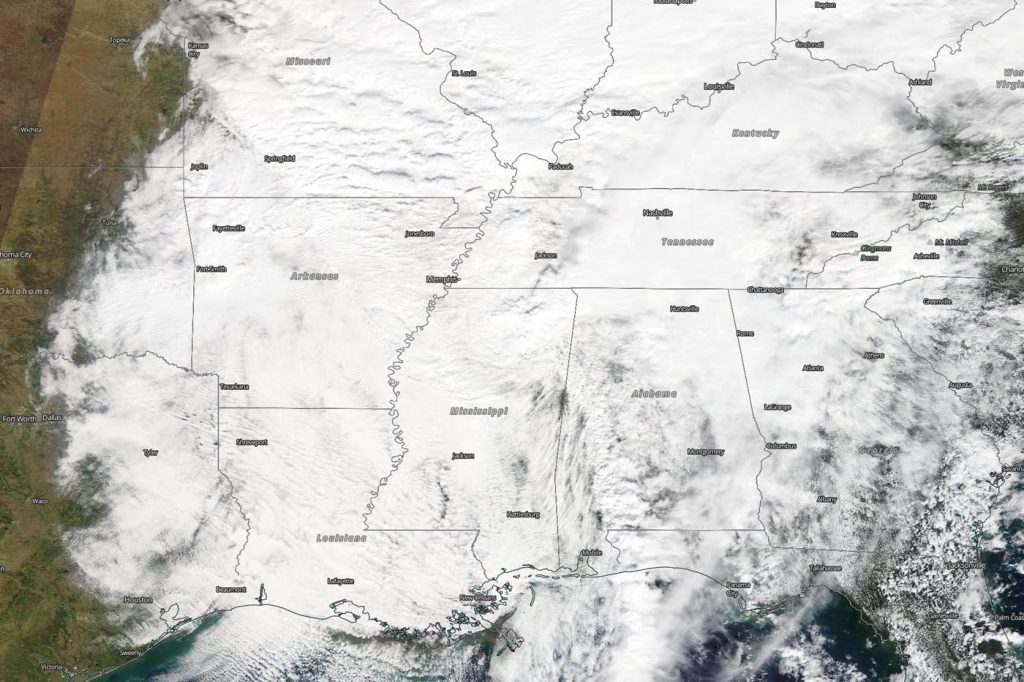
Tropical Depression 17 strengthened briefly into a tropical storm on the same day it formed, Oct. 25. NASA’s Terra satellite captured a look at the clouds associated with its remnants merging with a cold front over the southern U.S.
When NASA’s Terra satellite passed over the eastern U.S. on Oct. 26, it found post-tropical cyclone Olga’s clouds spreading into the Mississippi Valley, but there was no discernable center of circulation as the storm became embedded in a cold front. Credit: NASA Worldview
Tropical Depression 17 formed early on Friday, Oct. 25 and by 5 p.m. EDT it had strengthened and organized into a tropical storm and was renamed Olga. However, by 11 p.m. EDT, Olga transitioned again into a post-tropical storm.
The last advisory on Tropical Storm Olga was issued at 11 p.m. EDT on Oct. 25 by the National Hurricane Center or NHC. At that time, the center of Post-Tropical Cyclone Olga was located near latitude 27.8 degrees north and longitude 92.2 degrees west. The post-tropical cyclone was moving toward the northeast near 17 mph (28 kph) and maximum sustained winds were near 50 mph (85 kph) and weakening.
At that time, the NHC discussion said, “Earlier this evening, the last 2 passes through Olga made by an Air Force Reserve Hurricane Hunter aircraft showed that the cyclone had become embedded within a cold front. Strong northwesterly flow was observed within 10 nautical miles northwest of Olga’s center and a sharp temperature and dew point gradient was measured across the cyclone. It does not appear that Olga has separated from the front in any significant way since the plane left. In fact, recent surface observations suggest that either the front passes through the center of the cyclone or its circulation has become poorly defined. Based on all these data, Olga is now classified as post-tropical and this is the last NHC advisory.”
Since Olga became entangled with the front, the winds and seas associated the front were then considered to be representative of the overall system.
Olga’s remnants moved through the Mississippi Valley today and toward the Great Lakes on Sunday, Oct. 27.
Oct. 25, 2019 – NASA Observes Tropical Storm Kyarr Form Near Southwest India Coast
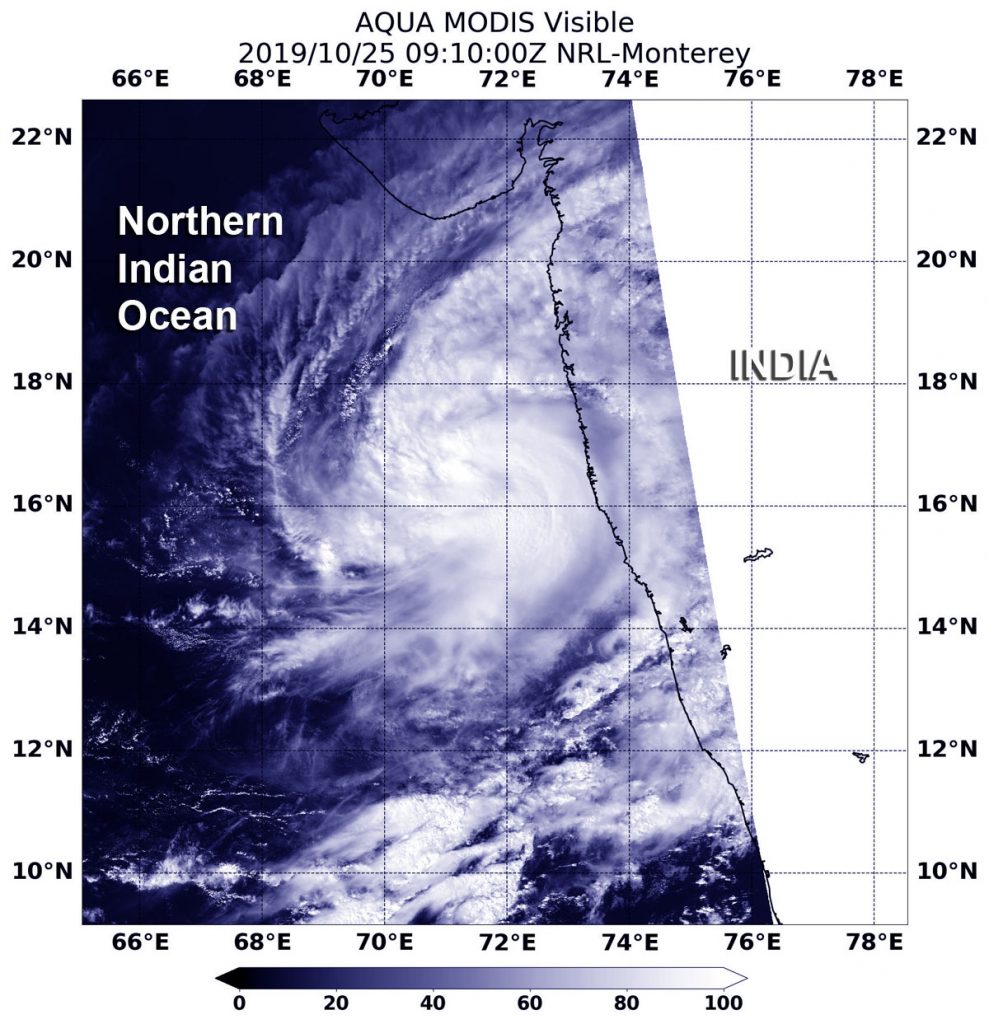
Tropical Storm Kyarr formed near the southwestern coast of India, and NASA’s Aqua satellite provided forecasters with a visible image of the storm that revealed it organized quickly.
On Oct. 25 at 5:10 a.m. EDT (0910 UTC), the MODIS instrument that flies aboard NASA’s Aqua satellite took this image of Tropical Storm Kyarr off the coast of southwestern India. Credit: NASA/NRL
Kyarr formed early on Oct. 25 from a low-pressure area designated as System 97A in the northern Indian Ocean. Once the storm consolidated, it intensified quickly and became a tropical storm just off the southwest India coast.
The India Meteorological Department issued some warnings on Kyarr on Oct. 25. There is a heavy rainfall warning in effect that calls for light to moderate rainfall in most places. Heavy to very heavy falls are predicted at isolated places very likely over coastal districts of Karnataka, Goa and south Konkan and isolated heavy rainfall over north Konkan during next 24 hours. There is also a wind warning in effect calling for gale-force winds with speeds reaching 70-80 kph (43 to 50 mph) gusting to 90 kph (56 mph), prevailing around the system center over east-central Arabian Sea. It is very likely to increase gradually becoming 90-100 kph (56 to 62 mph).
On Oct. 25 at 5:10 a.m. EDT (0910 UTC), the Moderate Imaging Spectroradiometer or MODIS instrument that flies aboard NASA’s Aqua satellite provided a visible image of Kyarr. The image showed that there is a large band of powerful thunderstorms circling Kyarr’s low-level center of circulation. In addition, infrared satellite imagery showed that Kyarr has a solid core of strong convection – that is, rising air which forms the thunderstorms that make up a tropical cyclone, wrap around the low-level circulation center. Microwave satellite imagery revealed the storm had developed an eye, a sign of strengthening.
The shape of the storm is a clue to forecasters that a storm is either strengthening or weakening. If a storm takes on a more rounded shape it is getting more organized and strengthening. Conversely, if it becomes less rounded or elongated, it is a sign the storm is weakening.
At 11 a.m. EDT (1500 UTC) on Oct. 25, the Joint Typhoon Warning Center or JTWC noted Tropical Cyclone Kyarr was located near latitude 16.3 degrees north and longitude 71.9 degrees east, about 579 nautical miles south-southeast of Karachi, Pakistan. Maximum sustained winds were 55 knots (63 mph/102 kph).
Kyarr is drifting generally northward while located between two subtropical ridges (elongated areas of high pressure) located to the northwest and northeast of the tropical storm. As those ridges strengthen and build, Kyarr is forecast to turn to the northwest and rapidly intensify.
The JTWC expects the storm will peak after three days, but will then start to weaken on approach to the Oman coastline.
Hurricanes are the most powerful weather event on Earth. NASA’s expertise in space and scientific exploration contributes to essential services provided to the American people by other federal agencies, such as hurricane weather forecasting.
Oct. 25, 2019 – NASA-NOAA Satellite Catches Development of Gulf Tropical Depression 17
NASA-NOAA’s Suomi NPP satellite passed over the Gulf of Mexico and revealed that a low pressure area was developing into a depression. On Oct. 25, that low pressure area became Tropical Depression 17.
NASA-NOAA’s Suomi NPP satellite passed over the Gulf of Mexico and the VIIRS instrument aboard captured this image of developing Tropical Depression 17 on Oct. 24. Suomi NPP showed that the center of circulation was west of the bulk of clouds. Credit: NASA/NOAA/NRL
On Oct. 24, the Visible Infrared Imaging Radiometer Suite (VIIRS) instrument aboard NASA-NOAA’s Suomi NPP satellite captured a visible image of the structure of the low pressure area that became Tropical Depression 17 on Oct. 25. The storm appeared elongated from south to north, but the center was actually located west of all of the clouds and showers. In satellite imagery on Oct. 25, the National Hurricane Center said, “Satellite imagery indicates that the low pressure system in the western Gulf of Mexico has developed a well-defined circulation. In addition, a cluster of strong convection is located near and to the northeast of the low-level center.”
Status of Tropical Depression 17
At 11 a.m. EDT (1500 UTC) on Oct. 25, the center of Tropical Depression 17 was located near latitude 25.6 degrees north and longitude 94.4 degrees west. That puts the center about 320 miles (515 km) south-southwest of Lake Charles, Louisiana.
The depression was moving toward the north near 16 mph (26 kph). A motion toward the north-northeast at a faster forward speed is expected later in the day and through Sunday [Oct 27]. Maximum sustained winds are near 35 mph (55 kph) with higher gusts. The estimated minimum central pressure is 1006 millibars.
The National Hurricane Center or NHC said, “Some strengthening is expected and the depression could become a tropical storm later in the day on Oct. 25. The cyclone is then expected to merge with a cold front and become a post-tropical low with gale-force winds tonight before the center reaches the Gulf coast.”
On the forecast track, the center of the cyclone should move across the northwestern Gulf of Mexico this afternoon and then move over the northern Gulf coast tonight or Saturday morning.
NHC Forecasts Conditions Expected
The NHC noted the following conditions are forecast: Gale-force winds associated with this system should spread over portions of the northern Gulf coast tonight and Saturday morning. The depression and rainfall ahead of the system along and north of the frontal boundary across the Central Gulf coast is expected to produce total rainfall accumulations of 2 to 4 inches with maximum totals of 8 inches across the Central Gulf coast into the Lower Mississippi Valley through Saturday morning. These rains may produce flash flooding across the Central Gulf coast into the Lower Mississippi Valley.
Above-normal tides and associated coastal flooding are possible across portions of the northern Gulf coast. A couple tornadoes are possible through tonight across southeast portions of Louisiana and Mississippi into southwest Alabama.
Forecasting a Merge With a Cold Front
The NHC noted, “Since the depression is expected to merge with a cold front and become post-tropical by tonight, hazards related to wind, rainfall and coastal flooding will be covered by products issued by local National Weather Service forecast offices, available at weather.gov.”
Hurricanes are the most powerful weather event on Earth. NASA’s expertise in space and scientific exploration contributes to essential services provided to the American people by other federal agencies, such as hurricane weather forecasting.
NASA-NOAA’s Suomi NPP satellite passed over the Northwestern Pacific Ocean revealed that Typhoon Bualoi continued to look asymmetric because of ongoing wind shear. The Joint Typhoon Warning Center issued the final bulletin on Bualoi as it was beginning the transition into an extra-tropical cyclone.
NASA-NOAA’s Suomi NPP satellite passed over Typhoon Bualoi and the VIIRS instrument aboard captured this image of the storm on Oct. 25. Suomi NPP showed that Bualoi continued to appear asymmetric as it was transitioning into an extra-tropical cyclone. Credit: NASA Worldview, Earth Observing System Data and Information System (EOSDIS)
On Oct. 25, the Visible Infrared Imaging Radiometer Suite (VIIRS) instrument aboard NASA-NOAA’s Suomi NPP satellite captured a visible image of the structure of Bualoi. The storm appeared elongated from southwest to northeast, indicating that it had begun its transition into an extra-tropical cyclone. The image was generated by NASA Worldview, Earth Observing System Data and Information System (EOSDIS), at NASA’s Goddard Space Flight Center in Greenbelt, Md.
What Wind Shear Does to a Tropical Cyclone
In general, wind shear is a measure of how the speed and direction of winds change with altitude. Tropical cyclones are like rotating cylinders of winds. Each level needs to be stacked on top each other vertically in order for the storm to maintain strength or intensify. Wind shear occurs when winds at different levels of the atmosphere push against the rotating cylinder of winds, weakening the rotation by pushing it apart at different levels.
What does Extra-tropical Mean?
When a storm becomes extra-tropical it means that a tropical cyclone has lost its “tropical” characteristics. The National Hurricane Center defines “extra-tropical” as a transition that implies both poleward displacement (meaning it moves toward the north or south pole) of the cyclone and the conversion of the cyclone’s primary energy source from the release of latent heat of condensation to baroclinic (the temperature contrast between warm and cold air masses) processes. It is important to note that cyclones can become extratropical and still retain winds of hurricane or tropical storm force.
Bualoi’s Final Advisory
When the Joint Typhoon Warning Center issued their final bulletin on Bualoi at 5 a.m. EDT (0900 UTC), the storm was centered near latitude 33.7 degrees north and longitude 148.0 degrees east, about 421 nautical miles east of Yokosuka, Japan. The storm was speeding to the northeast at 25 knots (28 mph/44 kph) and had maximum sustained winds near 65 knots (75 mph/120 kph).
Forecasters at the Joint Typhoon Warning Center said that Bualoi was moving north-northeast and will continue to weaken. The storm is forecast to make its transition to an extra-tropical cyclone well to the east of Japan by the end of the day on Oct. 25.
Hurricanes are the most powerful weather event on Earth. NASA’s expertise in space and scientific exploration contributes to essential services provided to the American people by other federal agencies, such as hurricane weather forecasting.
NASA-NOAA’s Suomi NPP satellite and NASA’s Aqua satellite both passed over the Northwestern Pacific Ocean and both used infrared light to obtain temperature data and shape information on Typhoon Bualoi.
NASA’s Aqua satellite passed over Typhoon Bualoi and the AIRS instrument aboard captured this image of the storm on Oct. 23 at 11:29 p.m. EDT (0329 UTC). Aqua found that the strongest thunderstorms around west of center had cloud top temperatures as cold as or colder than 210 Kelvin (minus 81.6 degrees Fahrenheit/minus 63.5 Celsius). Credit: NASA JPL, Heidar Thrastarson
The shape of a storm says a lot about what is happening to it. Symmetrical storms are stronger, more organized storms. It is like a spinning tire that is well rounded. It can spin faster. Asymmetric storms cannot rotate as fast as symmetrical storms. It is similar to a flat tire cannot go as fast as a rounded tire. Satellite data provides a look at the symmetry of storms and found that Typhoon Bualoi is now an asymmetric storm, indicating it is weakening.
Infrared data provides temperature information, and the strongest thunderstorms that reach high into the atmosphere have the coldest cloud top temperatures. This data is helpful to forecasters because storms are not uniform around tropical cyclones and it helps pinpoint where the strongest storms are located.
NASA-NOAA’s Suomi NPP satellite passed over Typhoon Bualoi and the VIIRS instrument aboard captured this image of the storm on Oct. 23 at 12:12 p.m. EDT (1612 UTC). Suomi NPP found that the strongest thunderstorms west of center had cloud top temperatures as cold as 190 Kelvin (minus 117 degrees Fahrenheit/minus 83.1 Celsius). Credit: NASA/NOAA/UWM-CIMSS, William Straka III
On Oct. 23 at 12:12 p.m. EDT (1612 UTC), the Visible Infrared Imaging Radiometer Suite (VIIRS) instrument aboard Suomi NPP found strongest thunderstorms west of center had cloud top temperatures as cold as 190 Kelvin (minus 117 degrees Fahrenheit/minus 83.1 Celsius). NASA research has shown that cloud top temperatures that cold indicate strong storms have the potential to generate heavy rainfall.
William Straka III, a researcher at the University of Wisconsin – Madison, Space Science and Engineering Center (SSEC) created imagery of the storm using the Suomi-NPP satellite. The strongest thunderstorms were on the western side of the eye, while the eastern side showed tropospheric gravity waves created by overshooting cloud tops into the stratosphere. An overshooting cloud top is a dome-like protrusion above a cumulonimbus anvil cloud, often penetrating into the lower stratosphere. It indicates a very strong updraft in the convective cloud or thunderstorm.
Gravity waves are the mark of a powerful storm. They are created when air moving around the atmosphere gets pushed to another place as in the case of tropical cyclones. Powerful thunderstorms around a tropical cyclone’s center can move air up and down and generate these waves in quick, short bursts. They can be seen as ripples in some imagery of clouds in a tropical cyclone.
“The brightness temperature showed an asymmetrical orientation with the circulation being hidden in the convection. Also, the southern part of the storm seems to have some dry air intruding in on it, simply based on the infrared appearance,” Straka said.
When NASA’s Aqua satellite passed over Typhoon Bualoi, the Atmospheric Infrared Sounder or AIRS instrument aboard captured an image of the storm on Oct. 23 at 11:29 p.m. EDT (0329 UTC). Aqua found that the strongest thunderstorms around west of center had cloud top temperatures as cold as or colder than 210 Kelvin (minus 81.6 degrees Fahrenheit/minus 63.5 Celsius). The Joint Typhoon Warning Center said that animated enhanced infrared satellite imagery depicts decaying deep convective banding wrapping into a ragged eye.
On Oct. 24 at 11 a.m. EDT (1500 UTC), Typhoon Bualoi was located near latitude 29.4 degrees north and longitude 143.5 degrees east. That is about 670 nautical miles south of Misawa, Japan. Bualoi was moving to the north-northeast with maximum sustained winds near 90 knots (103 mph/167 kph).
The Joint Typhoon Warning Center noted that Bualoi is moving north-northeast and will continue to weaken. The storm will become extra-tropical east of Japan within 24 hours.
Hurricanes are the most powerful weather event on Earth. NASA’s expertise in space and scientific exploration contributes to essential services provided to the American people by other federal agencies, such as hurricane weather forecasting.
Oct. 23, 2019 – NASA Analysis Shows Heavy Rain in Typhoon Bualoi
Typhoon Bualoi continues to move through the Northwestern Pacific Ocean and the Global Precipitation Measurement mission or GPM core satellite measured rainfall rates throughout the storm.
The GPM core satellite passed over strengthening Typhoon Bualoi in the Northwestern Pacific Ocean on Oct. 22 at 12:11 p.m. EDT (1611 UTC) and found the heaviest rainfall (white/pink) falling at a rate of over 50 mm (about 2 inches) per hour. Credit: NASA/JAXA/NRL
The GPM’s core satellite passed over Typhoon Bualoi on Oct. 22 at 12:11 p.m. EDT (1611 UTC). GPM found the heaviest rain around the eye, falling at a rate of over 50 mm (about 2 inches) per hour. Forecasters at NOAA’s National Hurricane Center or NHC incorporate the rainfall data into their forecasts.
At 5 a.m. EDT (7 p.m. ChST/0900 UTC) the center of Typhoon Bualoi was located near latitude 23.5 degrees north and longitude 142.0 degrees east. The National Weather Service in Tiyan, Guam noted that it is about 405 miles northwest of Agrihan. Bualoi is now moving north-northwest at 13 mph and will continue a gradual turn to the north tonight and then toward the north-northeast through Thursday night. Maximum sustained winds have decreased to 115 mph and Bualoi is expected to continue this weakening trend the next several days. Bualoi is expected to gradually increase in forward speed as it heads farther into the north Pacific east of Japan.
Both the Japan Aerospace Exploration Agency (JAXA) and NASA manage GPM.
Hurricanes are the most powerful weather event on Earth. NASA’s expertise in space and scientific exploration contributes to essential services provided to the American people by other federal agencies, such as hurricane weather forecasting.