Jerry – North Atlantic Ocean

Sep. 18, 2019 – NASA-NOAA Satellite Provides Forecasters a View of Tropical Storm Jerry’s Structure

Tropical Storm Jerry is the latest in a line of tropical cyclones to develop in the North Atlantic Ocean this season. NASA-NOAA’s Suomi NPP satellite passed overhead and provided forecasters with a view of its structure that helped confirm it was organizing.

Suomi NPP image of Jerry
On Sept. 17 NASA-NOAA’s Suomi NPP satellite passed over newly developed Tropical Depression 10 as it was strengthening into a tropical storm, and found strong bands of thunderstorms over the southern and southwestern portions of the circulation, but were limited over the remainder of the cyclone. Credit: NASA/NOAA/NRL

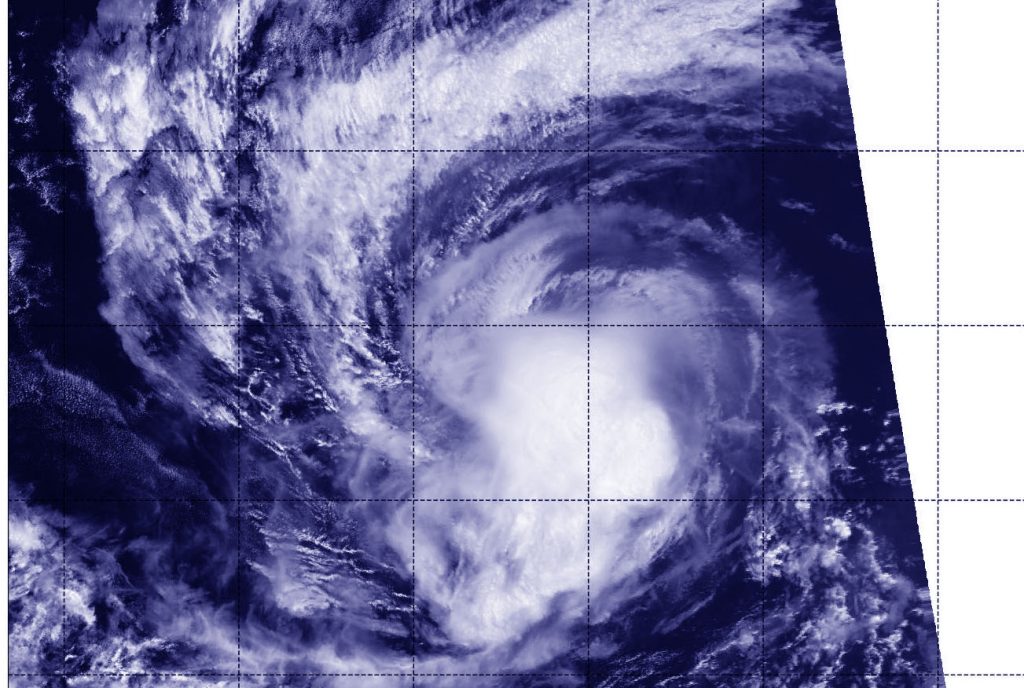
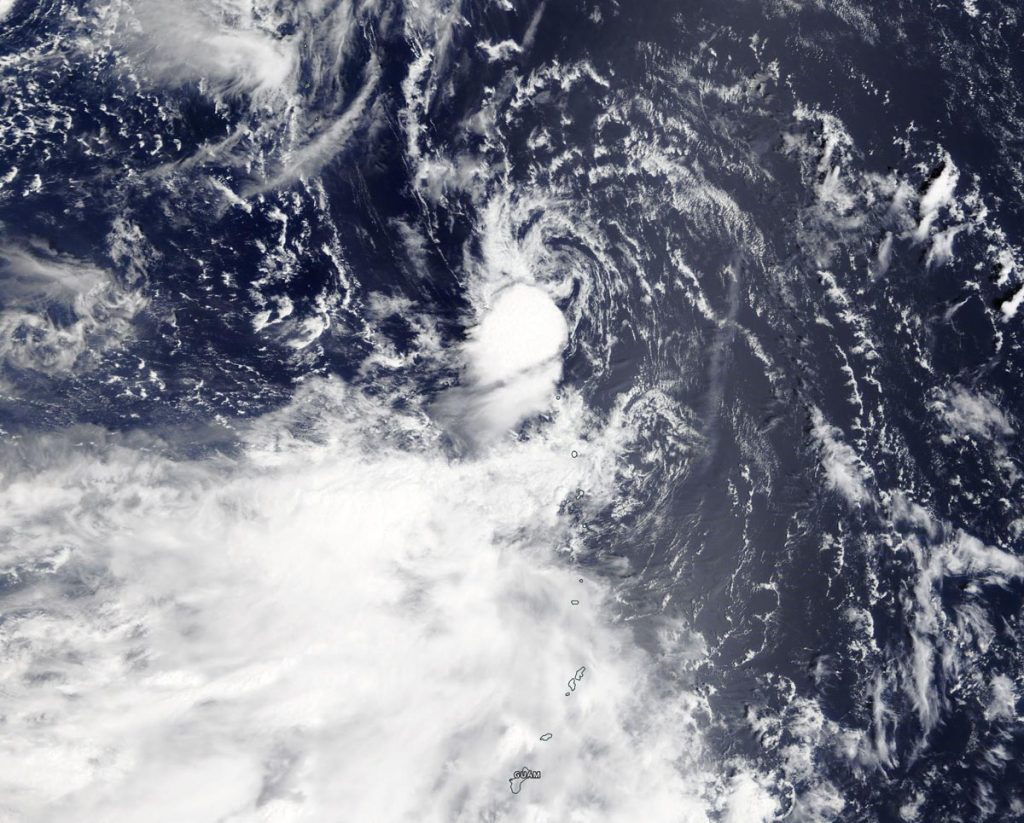
Tropical Depression 10 formed in the Central Atlantic on Sept. 17 by 11 a.m. EDT. On Sept. 17, at 12:48 p.m. EDT (1648 UTC), the Visible Infrared Imaging Radiometer Suite (VIIRS) instrument aboard Suomi NPP provided a visible image of the Tropical Depression 10, which later became Tropical Storm Jerry. The VIIRS image showed that the storm had taken a more rounded circulation than previously in the day, indicating it had become better organized. The image showed strong bands of thunderstorms that were located over the southern and southwestern portions of the circulation, but were limited over the remainder of the cyclone.

Hurricanes are the most powerful weather event on Earth. NASA’s expertise in space and scientific exploration contributes to essential services provided to the American people by other federal agencies, such as hurricane weather forecasting.

By 5 a.m. EDT on Sept. 18, the depression strengthened enough to become a tropical storm. At that time, it was renamed as Tropical Storm Jerry.

NOAA’s National Hurricane Center or NHC said, “At 11 a.m. EDT (1500 UTC) on Sept. 18 the center of Tropical Storm Jerry was located near latitude 14.6 degrees North and longitude 49.2 degrees West. That puts Jerry’s center about 855 miles (1,375 km) east of the Leeward Islands. Jerry is moving toward the west-northwest near 14 mph (22 kph). Maximum sustained winds have increased to near 50 mph (85 kph) with higher gusts.  Jerry is forecast to become a hurricane by late Thursday, with little change in strength anticipated on Friday and Saturday. The estimated minimum central pressure is 1002 millibars.

NASA and NOAA satellite data have shown that there are warm waters and light wind shear in Jerry’s path which will enable it to strengthen. However, there is also dry air around the tropical storm which is forecast to limit the intensification for now.

NHC said, “A west- northwest motion at a slightly faster forward speed is expected over the next few days. On the forecast track, the system will be near the northern Leeward Islands Friday and pass north of Puerto Rico on Saturday [Sept. 21].”

For updated forecasts. visit: www.nhc.noaa.gov

By Rob Gutro 
NASA’s Goddard Space Flight Center

Humberto – Atlantic Ocean

Sep. 18, 2019 – NASA’s Wide View of Major Hurricane Humberto’s Massive Atlantic “Tail”

NASA’s Aqua satellite is one in a fleet of NASA satellites that provide data for research. NASA’s Aqua satellite provided a visible image of Major Hurricane Humberto and its very long “tail” of thunderstorms stretching past eastern Canada.

Aqua image of Humberto
On Sept. 18, the MODIS instrument that flies aboard NASA’s Aqua satellite provided these stitched together images of Hurricane Humberto in the Atlantic Ocean. Although Humberto’s eye was just about 490 miles (785 km) west-southwest of Bermuda at the time of the Aqua overpass, the thick band of thunderstorms east of the center stretched beyond eastern Canada! Credit: NASA Worldview

Hurricanes are the most powerful weather event on Earth. NASA’s expertise in space and scientific exploration contributes to essential services provided to the American people by other federal agencies, such as hurricane weather forecasting.

On Sept. 18, the Moderate Imaging Spectroradiometer or MODIS instrument that flies aboard NASA’s Aqua satellite passed over the northern Atlantic Ocean and gathered images of Hurricane Humberto. Humberto is such a large storm that the Aqua satellite had to make two Earth orbits to capture the entire storm. At NASA’s Goddard Space Flight Center in Greenbelt, Maryland, those images were put together to form a complete picture of Humberto.

Although Humberto’s eye was just about 490 miles (785 km) west-southwest of Bermuda at the time of the Aqua overpass, the thick band of thunderstorms east of the center stretched beyond eastern Canada!

On Sept. 19, the National Hurricane Center (NHC) said, “Humberto’s satellite presentation continues to be outstanding with a large ragged eye and surrounded by deep convection.”

The NHC said, “At 8 a.m. EDT (1200 UTC), the eye of Hurricane Humberto was located by satellite near latitude 31.8 degrees north and longitude 68.9 degrees west. Humberto has increased its forward speed and is moving toward the east-northeast near 16 mph (26 kph). This general motion with an additional increase in forward speed is expected through early Thursday, followed by a northeastward to north-northeastward motion through Friday.

Maximum sustained winds are near 115 mph (185 kph) with higher gusts.  Humberto is a category 3 hurricane on the Saffir-Simpson Hurricane Wind Scale.  Some fluctuations in intensity are likely during the next day or so, but Humberto should remain a powerful hurricane through early Thursday.  A steady weakening trend should begin later on Thursday, Sept. 19.

Hurricane-force winds extend outward up to 60 miles (95 km) from the center and tropical-storm-force winds extend outward up to 175 miles (280 km).  The estimated minimum central pressure is 951 millibars.

On the NHC forecast track, the core of Humberto is expected to pass just to the northwest and north of Bermuda later tonight.

For updated forecasts, visit: https://www.nhc.noaa.gov

By Rob Gutro
NASA’s Goddard Space Flight Center

Lorena – Eastern Pacific Ocean

Sep. 17, 2019 – GPM  Finds Heavy Rain in New Eastern Pacific Tropical Storm Lorena

The Global Precipitation Measurement mission or GPM core satellite provided information about the rate in which rain was falling within the Eastern Pacific Ocean’s tropical storm.

GPM image of Lorena
The GPM core satellite passed over developing Tropical Storm Lorena in the eastern Pacific Ocean on Sept. 17 at 2:31 p.m. EDT (1831 UTC). GPM found the heaviest rainfall (pink) near the center where it was falling at a rate of over 40 mm (about 1.6 inch) per hour. Lighter rainfall rates (yellow and blue) were measured throughout the north and west sides of the storm. Credit: NASA/JAXA/NRL

Lorena is close enough to the coast of Mexico to trigger a watch. A Tropical Storm Watch is in effect from Zihuatanejo to Cabo Corrientes, Mexico.

Tropical Storm Lorena formed today, Sept. 17. GPM passed over Tropical Storm Lorena in the Eastern Pacific on Sept. 17 at 2:31 p.m. EDT (1831 UTC). GPM found the heaviest rainfall around the center where it was falling at a rate of over 40 mm (about 1.6 inch) per hour.  Lighter rainfall rates were measured throughout the north and west sides of the storm.

GPM is a joint mission between NASA and the Japan Aerospace Exploration Agency, JAXA.

NOAA’s National Hurricane Center or NHC noted at 2 p.m. EDT (1800 UTC), the center of Tropical Storm Lorena was located near latitude 13.9 degrees North and longitude degrees 100.4 West. The tropical storm is moving toward the northwest near 15 mph (24 kph). Recent satellite-derived wind data indicate that Lorena’s maximum sustained winds have increased to near 45 mph (75 kph) with higher gusts. The estimated minimum central pressure is 1004 millibars.

A northwestward motion at a slightly slower speed is expected for the next couple of days. Lorena is expected to move near the southwest coast of Mexico by Thursday. Continued gradual strengthening is anticipated during the next couple of days as Lorena approaches the coast of Mexico.

For updated forecasts, visit: www.nhc.noaa.gov

By Rob Gutro
NASA’s Goddard Space Flight Center

Imelda – Atlantic Ocean

Sep. 17, 2019 – NASA’s Terra Satellite Sees the Birth of Tropical Storm Imelda

NASA’s Terra satellite passed over the western Gulf of Mexico during the early afternoon of Sept. 17 and captured a visible image of the newly formed Tropical Depression 11.

Terra image of Imelda
On Sept. 17 at 1:30 p.m. EDT (17:30 UTC), the MODIS instrument that flies aboard NASA’s Terra satellite showed newly formed Tropical Depression 11 just after it made landfall along the Texas coast. Credit: NASA Worldview

The eleventh tropical depression developed during the late morning of Sept. 17. Soon afterward it briefly strengthened into a tropical storm and was re-named Imelda. Then Imelda made landfall near Freeport, Texas. A Tropical Storm Warning was in effect from Sargent to Port Bolivar, Texas.

On Sept. 17 at 1:30 p.m. EDT (17:30 UTC), the Moderate Imaging Spectroradiometer or MODIS instrument that flies aboard NASA’s Terra satellite provided a visible picture of the storm shortly after it made landfall on the southeastern Texas coastline. The storm appeared to be slightly elongated, and when Terra passed overhead the western quadrant of the storm was already over land while the eastern half was over the western Gulf of Mexico.

At 1 p.m. EDT (1700 UTC), the center of Tropical Storm Imelda was located near latitude 28.7 North, longitude 95.4 West. The storm is moving toward the north near 7 mph (11 kph), and this general motion is expected to continue through early Wednesday. Maximum sustained winds are near 35 mph (55 kph), tropical storm strength, with higher gusts. Some slight strengthening is possible before the center moves onshore. The estimated minimum central pressure is 1009 millibars.

For local Houston area radar, visit: https://www.weather.gov/hgx/

A north-northwestward motion is expected Wednesday night and Thursday. On the forecast track, the center of the depression will move inland over the Upper Texas coast later today, and move farther inland tonight and Wednesday.

For updated forecasts, visit: https://www.nhc.noaa.gov

By Rob Gutro
NASA’s Goddard Space Flight Center

Kiko – Eastern Pacific Ocean

Sep. 17, 2019 – NASA-NOAA Satellite Catches Hurricane Kiko

Hurricane Kiko continued to track west through the Eastern Pacific Ocean when NASA-NOAA’s Suomi NPP satellite passed overhead and provided a view of the storm. Satellite imagery revealed an elongated shape, which indicated wind shear was still affecting Kiko.

Suomi NPP image of Kiko
Hurricane Kiko continued to weaken on Sept. 16 at 6:12 p.m. EDT (2212 UTC) when NASA-NOAA’s Suomi NPP satellite passed over the Eastern Pacific Ocean and the VIIRS instrument aboard captured this image of the storm. Credit: NASA/NOAA/NRL

The Visible Infrared Imaging Radiometer Suite (VIIRS) instrument aboard Suomi NPP provided an infrared image of the storm on Sept. 16 at 6:12 p.m. EDT (2212 UTC). The VIIRS image and microwave satellite imagery indicates that the northeasterly wind shear was still affecting Kiko.

In general, wind shear is a measure of how the speed and direction of winds change with altitude. Tropical cyclones are like rotating cylinders of winds. Each level needs to be stacked on top each other vertically in order for the storm to maintain strength or intensify. Wind shear occurs when winds at different levels of the atmosphere push against the rotating cylinder of winds, weakening the rotation by pushing it apart at different levels.

The National Hurricane Center noted that satellite imagery shows an irregular shaped central dense overcast with the anvil clouds being forced to the southwest of center. Anvil clouds form in the upper parts of thunderstorms and the anvils are mostly composed of ice (because they are so high in the atmosphere). They get their anvil shape because rising air in thunderstorms expands and spreads out as the air flattens against the bottom of the stratosphere.

At 5 a.m. EDT (0900 UTC) on Sept. 17, the center of Hurricane Kiko was located near latitude 17.2 degrees north and longitude 124.7 degrees west. That is about 1,035 miles (1,670 km) west-southwest of the southern tip of Baja California, Mexico. Kiko is moving toward the west near 5 mph (7 km/h). A turn to the west-southwest is expected today, followed by a turn to the west to west-northwest by Wednesday.

Maximum sustained winds are near 80 mph (130 kph) with higher gusts. Hurricane-force winds extend outward up to 15 miles (30 km) from the center and tropical-storm-force winds extend outward up to 60 miles (95 km). The estimated minimum central pressure is 985 millibars.

The National Hurricane Center said, “Additional weakening is expected through this evening and Kiko is forecast to become a tropical storm later today. Some slight re-strengthening is possible Wednesday and Thursday.”

For updated forecasts. visit: www.nhc.noaa.gov

By Rob Gutro 
NASA’s Goddard Space Flight Center

Humberto – Atlantic Ocean

Sep. 17, 2019 – NASA Satellite Provides a View of a Large Hurricane Humberto

NASA’s Terra Satellite provided a visible image of Hurricane Humberto when it was off the coast of the Carolinas and slowly moving north. The satellite image revealed that Humberto is a large storm.

Terra image of Humberto
On Sept. 15, the MODIS instrument that flies aboard NASA’s Terra provided a visible image of Hurricane Humberto. The storm appears large in the imagery as it stretches from Florida to North Carolina, and has a tail extending to the northeast for hundreds of miles into the western Atlantic Ocean north of Bermuda. In the image, powerful thunderstorms circled the eye, which was also visible. Credit: NASA Worldview, Earth Observing System Data and Information System (EOSDIS).

On Sept. 16, the Moderate Imaging Spectroradiometer or MODIS instrument that flies aboard NASA’s Terra satellite provided a visible image of Hurricane Humberto. The storm appears large in the imagery as it stretches from Florida to North Carolina, and has a tail extending to the northeast for hundreds of miles into the western Atlantic Ocean north of Bermuda. In the image, powerful thunderstorms circled the eye, which was also visible.

Humberto appears to have grown in size, and although it is located off the U.S. East coast, its extent is reaching Bermuda. The National Hurricane Center or NHC issued a Tropical Storm Warning for Bermuda on Sept. 17. Humberto may bring periods of heavy rain to Bermuda beginning Tuesday, with rainfall accumulations of 1 to 3 inches expected. Large swells generated by Humberto will increase along the coast of Bermuda by Wednesday.

NHC said at 8 a.m. EDT (1200 UTC), the large and ragged eye of Hurricane Humberto was located near latitude 30.6 degrees north and longitude 74.0 degrees west. Humberto is moving toward the east-northeast near 8 mph (13 kph).

Data from the Hurricane Hunters aircraft indicate that maximum sustained winds have increased to near 100 mph (160 kph) with higher gusts. Hurricane-force winds extend outward up to 30 miles (45 km) from the center and tropical-storm-force winds extend outward up to 150 miles (240 km).The minimum central pressure recently measured by the reconnaissance aircraft was 961 millibars.

On the forecast track, NHC said the center of Humberto is forecast to approach Bermuda Wednesday night, Sept. 18. NHC forecasters said that strengthening is expected during the next 24 hours, and Humberto could become a major hurricane by late on Sept. 17 or 18.

For updated forecasts, visit: www.nhc.noaa.gov

By Rob Gutro
NASA’s Goddard Space Flight Center

Peipah – Northwestern Pacific Ocean

Sep. 16, 2019 – NASA Finds Tropical Depression Peipah Dissipating

NASA’s Terra satellite passed over the northwestern Pacific Ocean and provided a final view of Tropical Depression Peipah.

Terra image of Peipah
On Sept. 16, the MODIS instrument aboard NASA’s Terra satellite provided a visible image of Peipah. The storm had diminished to a swirl of clouds, with only a small area of strong thunderstorms southwest of the center. Wind shear from the northeast pushed those storms southwest of center. Credit: NASA Worldview, Earth Observing System Data and Information System (EOSDIS)

Peipah developed on Sept. 14 as a depression. It was the seventeenth (17W) tropical depression of the Northwestern Pacific Ocean typhoon season. On Sept. 15 at 11 a.m. EDT (1500 UTC) the depression strengthened into a tropical storm with maximum sustained winds near 35 knots (40 mph) and was renamed Peipah. On Sept. 16, Peipah weakened back to a depression.

On Sept. 16, the Moderate Resolution Imaging Spectroradiometer or MODIS instrument aboard NASA’s Terra satellite provided a visible image of Peipah. The storm had diminished to a swirl of clouds, with only a small area of strong thunderstorms southwest of the center. Wind shear from the northeast pushed those storms southwest of center.

In general, wind shear is a measure of how the speed and direction of winds change with altitude. Tropical cyclones are like rotating cylinders of winds. Each level needs to be stacked on top each other vertically in order for the storm to maintain strength or intensify. Wind shear occurs when winds at different levels of the atmosphere push against the rotating cylinder of winds, weakening the rotation by pushing it apart at different levels.

Tropical Depression Peipah was dissipating on Sept. 16 at 11 a.m. EDT (1500 UTC). It was centered near 24.8 degrees north latitude and 142.8 degrees east longitude, about 82 miles east of Iwo To Island, Japan. Peipah was moving to the northwest and had maximum sustained winds near 25 knots.

The Joint Typhoon Warning Center issued their final warning on the system as it continued to dissipate.

By Rob Gutro
NASA’s Goddard Space Flight Center

Kiko – Eastern Pacific Ocean

Sep. 16, 2019 – NASA Finds Kiko Weakening in the Eastern Pacific

NASA’s Aqua satellite provided forecasters at the National Hurricane Center with infrared data and cloud top temperature information on Hurricane Kiko. Wind shear was affecting the storm and had closed the eye.

AIRS image of Kiko
On Sept. 16 at 5:41 a.m. EDT (0941 UTC) the AIRS instrument aboard NASA’s Aqua satellite analyzed cloud top temperatures of Hurricane Kiko in infrared light. AIRS found coldest cloud top temperatures (purple) of strongest thunderstorms were as cold as or colder than minus 63 degrees Fahrenheit (minus 53 degrees Celsius) around the center and in a large bands east and west of center. Credit: NASA JPL/Heidar Thrastarson

On Monday, September 16, 2019, microwave data and satellite imagery continue to indicate that the core of Kiko is being disrupted. Wind shear from the northeast is preventing Kiko from having a closed eyewall circulation. That means that the storm is subject to outside winds and can weaken.

NASA researches tropical cyclones. One of the ways NASA does that is with infrared data that provides temperature information. Cloud top temperatures provide information to forecasters about where the strongest storms are located within a tropical cyclone. Tropical cyclones do not always have uniform strength, and some sides have stronger sides than others. The stronger the storms, the higher they extend into the troposphere, and they have the colder cloud temperatures.

NASA’s Aqua satellite analyzed the storm on Sept. 8 at 11.59 p.m. EDT (Sept. 9 at 0359 UTC) using the Atmospheric Infrared Sounder or AIRS instrument. The AIRS instrument is one of six instruments flying on board NASA’s Aqua satellite, launched on May 4, 2002.

The AIRS infrared data no longer showed an eye in Kiko, indicating that the wind shear from the northeast had filled the center with clouds.

In general, wind shear is a measure of how the speed and direction of winds change with altitude. Tropical cyclones are like rotating cylinders of winds. Each level needs to be stacked on top each other vertically in order for the storm to maintain strength or intensify. Wind shear occurs when winds at different levels of the atmosphere push against the rotating cylinder of winds, weakening the rotation by pushing it apart at different levels.

AIRS found coldest cloud top temperatures as cold as or colder than minus 63 degrees Fahrenheit (minus 53 degrees Celsius) around Kiko’s center and in a large bands east and west of center. NASA research has shown that cloud top temperatures that cold indicate strong storms that have the capability to create heavy rain.

At 11 a.m. EDT (1500 UTC), the center of Hurricane Kiko was located near latitude 17.3 degrees north and longitude 123.7 degrees west. That put the center about 975 miles (1,570 km) west-southwest of the southern tip of Baja California, Mexico. Kiko is moving toward the west near 5 mph (7 kph), and this motion is expected to continue through tonight.

Maximum sustained winds have decreased to near 105 mph (165 kph) with higher gusts. Kiko is a small tropical cyclone. Hurricane-force winds extend outward up to 15 miles (30 km) from the center and tropical-storm-force winds extend outward up to 60 miles (95 km). The estimated minimum central pressure is 971 millibars.

NHC forecasters expect a west-southwestward motion on Sept. 17 followed by a turn back to the west on Wednesday. Gradual weakening is expected during the next couple of days.

For updated forecasts, visit: www.nhc.noaa.gov

By Rob Gutro
NASA’s Goddard Space Flight Center  

Humberto (Atlantic Ocean)

Sep. 16, 2019 – NASA Finds Humberto Strengthening off the Florida Coast

NASA’s Aqua Satellite provided a visible image of Tropical Storm Humberto as it was strengthening off the Florida coast on Sept. 15. Humberto became a hurricane late in the day.

Aqua image of Humberto
On Sept. 15, the MODIS instrument that flies aboard NASA’s Aqua provided a visible image of Tropical Storm Humberto spinning off the eastern coast of Florida and strengthening. Powerful thunderstorms circled the center and a large band of thunderstorms wrapped into the low-level center from the east. Credit: NASA Worldview, Earth Observing System Data and Information System (EOSDIS).

On Sept. 15, the Moderate Imaging Spectroradiometer or MODIS instrument that flies aboard NASA’s Aqua satellite provided a visible image of Tropical Storm Humberto spinning off the eastern coast of Florida and strengthening. Powerful thunderstorms circled the center and a large band of thunderstorms wrapped into the low-level center from the east. Humberto became a hurricane on Sept. 15 at 11 p.m. EDT.

Earlier that day at 2:11 p.m. EDT (1811 UTC) the Atmospheric Infrared Sounder (AIRS) instrument aboard NASA’s Aqua satellite analyzed Humberto’s cloud top temperatures in infrared light. AIRS found coldest cloud top temperatures (purple) of strongest thunderstorms were as cold as or colder than minus 63 degrees Fahrenheit (minus 53 degrees Celsius) around the center. NASA research has shown that storms with cloud top temperatures that cold can produce heavy rainfall.

AIRS infrared image of Humberto
On Sept. 15 at 2:11 p.m. EDT (1811 UTC) the AIRS instrument aboard NASA’s Aqua satellite analyzed Humberto’s cloud top temperatures in infrared light. AIRS found coldest cloud top temperatures (purple) of strongest thunderstorms were as cold as or colder than minus 63 degrees Fahrenheit (minus 53 degrees Celsius) around the center. Credit: NASA JPL/Heidar Thrastarson

On Sept. 16, Humberto was stirring up the seas and creating hazardous conditions. Humberto continued to get better organized to the west of Bermuda and was pushing large swells that were affecting much of the southeastern United States coastline. The National Hurricane Center (NHC) cautioned that interests in and around Bermuda should monitor the progress of Humberto since a Tropical Storm Watch will likely be required for Bermuda later in the day.

At 11 a.m. EDT (1500 UTC), the center of Hurricane Humberto was located near latitude 29.9 degrees north and longitude 76.5 degrees west making the center about 710 miles (1,145 km) west of Bermuda. Humberto is moving toward the east-northeast near 7 mph (11 kph). This general motion with a gradual increase in forward speed is expected through early Thursday.

Near visible Aqua image of Humberto
On Sept. 15 at 2:11 p.m. EDT (1811 UTC) the AIRS instrument aboard NASA’s Aqua satellite provided a near-visible image of Tropical Storm Humberto as it was strengthening into a hurricane. Credit: NASA JPL/Heidar Thrastarson

Data from an Air Force Reserve reconnaissance aircraft indicate that maximum sustained winds are near 85 mph (140 kph) with higher gusts. The minimum central pressure recently measured by reconnaissance aircraft was 978 millibars.

In the NHC discussion, Forecaster Stacy Stewart noted, “Humberto has been strengthening at a rate of 20 knots per 24 hours since this time yesterday, and that trend is expected to continue for the next day or so given the warm water beneath the hurricane and a continued favorable upper-level outflow pattern. The hurricane is expected to peak as a major hurricane in 36 to 48 hours.”

On the forecast track, the center of Humberto is forecast to approach Bermuda Wednesday night, Sept. 18. NHC forecasters said that strengthening is expected during the next 48 hours, and Humberto could become a major hurricane by Tuesday night, Sept. 17.

For updated forecasts, visit: www.nhc.noaa.gov

By Rob Gutro
NASA’s Goddard Space Flight Center

Humberto – Atlantic Ocean

Sep. 13, 2019 – GPM Analyzes Rainfall in Bahamas from Potential Tropical Cyclone 9

As the Bahamas continue to recover from Category 5 hurricane Dorian, a new developing tropical cyclone is bringing additional rainfall to an already soaked area.

GPM image of Potential Tropical Cyclone 9
The GPM core satellite passed over developing Potential Tropical Cyclone 9 on Sept. 13 at 2:26 a.m. EDT (0726 UTC). GPM found the heaviest rainfall (pink) northwest of the center where it was falling at a rate of over 40 mm (about 1.6 inch) per hour. Lighter rainfall rates (yellow and blue) were measured throughout the rest of the storm. Credit: NASA/JAXA/NRL

The Global Precipitation Measurement mission or GPM core satellite provided a look at those rainfall rates occurring in Potential Tropical Cyclone Nine, located over the Bahamas.

Potential Tropical Cyclone 9 developed around 5 p.m. EDT on Thursday, Sept. 12. At 11 a.m. EDT on Sept. 13, the depression triggered watches and warnings from NOAA’s National Hurricane Center. A Tropical Storm Warning is in effect for the northwestern Bahamas excluding Andros Island and a Tropical Storm Watch is in effect from Jupiter Inlet to the Flagler-Volusia County line, Fla.

Watches and warnings are already in effect. A Tropical Storm Warning is in effect for the northwestern Bahamas excluding Andros Island and a Tropical Storm Watch is in effect from Jupiter Inlet to Flagler-Volusia County line, Fla.

The GPM or Global Precipitation Measurement mission’s core satellite passed over Tropical Depression 9 on Sept. 13 at 2:26 a.m. EDT (0726 UTC). GPM found the heaviest rainfall northwest of the center where it was falling at a rate of over 40 mm (about 1.6 inch) per hour. GPM is a joint mission between NASA and the Japan Aerospace Exploration Agency, JAXA.

NOAA’s National Hurricane Center noted at 2 p.m. EDT (1800 UTC), the disturbance was centered near latitude 25.4 degrees north and longitude 74.2 degrees west. The system is expected to resume a slow motion toward the northwest and north-northwest later in the day. Maximum sustained winds are near 30 mph (45 kph) with higher gusts. The disturbance is forecast to become a tropical depression or a tropical storm later today or Saturday.

The potential tropical cyclone is expected to produce total rainfall accumulations through Sunday in the Bahamas of up to 2 to 4 inches, with isolated maximum amounts 6 inches. The U.S. Southeast Coast from central Florida into South Carolina can expect from 2 to 4 inches.

On the forecast track, the system is anticipated to move across the central and northwestern Bahamas today, and along or near the east coast of Florida Saturday and Saturday night.

For updated forecasts, visit: www.nhc.noaa.gov

By Rob Gutro
NASA’s Goddard Space Flight Center