Sep. 25, 2019 – NASA Finds Light Rain in Former Hurricane Kiko’s Remnants
Former Hurricane Kiko is now just a remnant low pressure area that has slid into the Central Pacific Ocean. The Global Precipitation Measurement mission or GPM satellite provided a look at the rainfall occurring within the low.
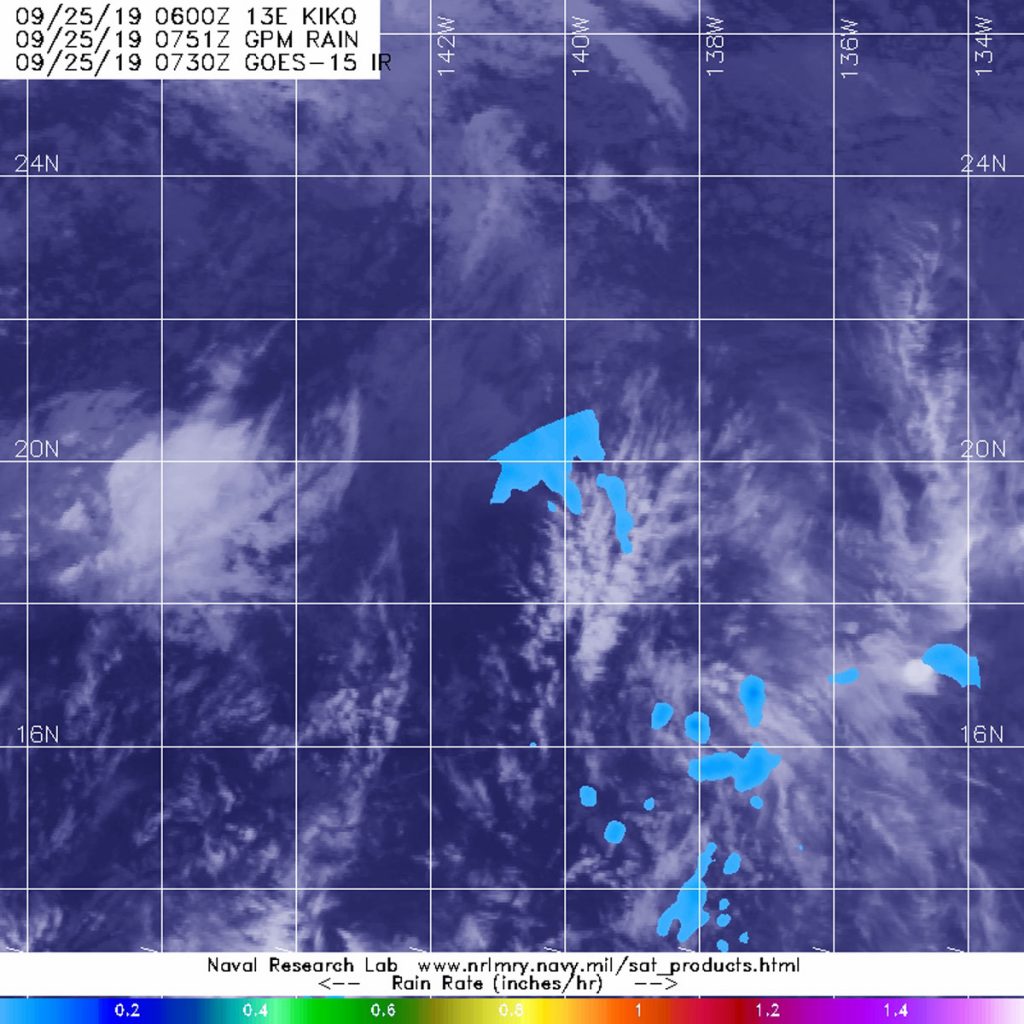
The GPM’s core satellite passed over Kiko’s remnants on Sept. 25 at 3:51 a.m. EDT (0751 UTC). GPM found scattered light rain (light blue) from the remnant clouds falling at less than 0.2 inches (less than 5 millimeters) per hour. Credit: NASA/NRL
Kiko weakened to a remnant low pressure area by 11 p.m. EDT on Sept. 24. At the time, it was about 950 miles (1.530 km) east of Hilo, Hawaii, near 19.2 degrees north latitude and 140.5 degrees west longitude. Maximum sustained winds at the time were near 35 mph (55 kph) and weakening. That also marked the last advisory from NOAA’s National Hurricane Center.
The GPM’s core satellite passed over Kiko’s remnants on Sept. 25 at 3:51 a.m. EDT (0751 UTC). GPM found scattered light rain from the remnant clouds falling at less than 0.2 inches (less than 5 millimeters) per hour. Forecasters at NOAA’s National Hurricane Center or NHC incorporate the rainfall data into their forecasts.
On Sept. 25, 2019, the Tropical Weather Discussion from NHC at 6:05 a.m. EDT (10:05 UTC) noted that Post-Tropical Cyclone Kiko is west of 140 degrees west longitude and in the Central Pacific Ocean. Kiko continues to move west.
The air-pressure gradient created between Kiko (a low pressure area) and high pressure north of the area is supporting moderate to fresh trade winds. Kiko’s remnants are producing a large area of ocean swells to 8 feet. Those ocean swells are expected to lessen as Kiko’s remnants dissipate.
Hurricanes are the most powerful weather event on Earth. NASA’s expertise in space and scientific exploration contributes to essential services provided to the American people by other federal agencies, such as hurricane weather forecasting.
GPM is a joint mission between NASA and the Japan Aerospace Exploration Agency, JAXA.
Sep. 24, 2019 – NASA Satellite Looks at Tropical Storm Kiko’s Cloud Heights, Temperatures
NASA’s Aqua Satellite provides a variety of data on tropical cyclones including cloud heights and cloud top temperatures. Aqua examined those factors in Tropical Storm Kiko before wind shear began to affect it and weaken the storm.
On Sept. 23, the MODIS instrument that flies aboard NASA’s Aqua provided an image of cloud top temperatures and heights of Tropical Storm Kiko. Purple indicates the highest cloud tops with the coldest temperatures. Credit: NASA Worldview, Earth Observing System Data and Information System (EOSDIS).
Tropical cyclones are made up of hundreds of thunderstorms. By analyzing the heights of thunderstorms the their cloud top temperatures, forecasters can tell if a storm is strengthening or weakening. The higher the cloud tops, the stronger the uplift in a storm. That rising air helps thunderstorms develop. As storms go higher, it is an indication that the storm is strengthening. Conversely, if over a period of time, satellite data shows cloud tops falling and warming, it is an indication the storm is weakening because there’s not as strong as an uplift or rising air in the storm.
On Sept. 23, the Moderate Imaging Spectroradiometer or MODIS instrument that flies aboard NASA’s Aqua satellite measured clouds heights and temperatures. Imagery showed the initial presence of an eye developing and strong thunderstorms developing around the southern quadrant. The imagery showed the highest cloud tops, higher than 12,000 meters (7.65 miles) were located around the developing eye and mostly south of the center. As the day progressed, high cirrus clouds covered the eye-like feature.
Aqua data also found that cloud top temperatures were as cold as or colder than 200 Kelvin (minus 99.6 degrees Fahrenheit/minus 73.1 degrees Celsius) around in those storms. NASA research has shown that cloud top temperatures that cold have the capability to generate heavy rainfall.
On Sept. 24, strong southwesterly wind shear between 40 and 45 knots caused Kiko’s convection and developing thunderstorms to become displaced from the low-level center by about 70 nautical miles. That has weakened the storm. The speed of that wind shear is expected to increase as Kiko moves westward, and that means the storm will weaken.
NOAA’s National Hurricane Center or NHC said at 11 a.m. EDT (1500 UTC) on Sept. 24 the center of Tropical Storm Kiko was located near latitude 17.9 degrees north and 138.9 degrees west longitude. That puts the center about 1,065 miles (1,715 km) east of Hilo, Hawaii. Kiko is moving toward the northwest at near 10 mph (17 kph), and this motion is expected to continue through the day. Maximum sustained winds are near 45 mph (75 kph) with higher gusts. Tropical-storm-force winds extend outward up to 70 miles (110 km) from the center. The estimated minimum central pressure is 1004 millibars.
On the forecast track, Kiko will move into the central Pacific basin later in the day on Sept. 24. Additional weakening is forecast, and Kiko is likely to become a tropical depression by tonight. It should then degenerate into a remnant low on Wednesday. Sept. 25.
The Aqua satellite cloud height and temperature data was provided by NASA’s Worldview product at NASA’s Goddard Space Flight Center, Greenbelt, Md.
Hurricanes are the most powerful weather event on Earth. NASA’s expertise in space and scientific exploration contributes to essential services provided to the American people by other federal agencies, such as hurricane weather forecasting.
Sep. 23, 2019 – NASA-NOAA Satellite Sees a Tight Circulation in Tropical Storm Kiko
NASA-NOAA’s Suomi NPP satellite imagery revealed that Tropical Storm Kiko had a tight circulation center.
NASA-NOAA’s Suomi NPP satellite passed over Tropical Storm Kiko on Sept.22 and revealed a tight circular area with some powerful storms around the low-level center. The image showed bands of thunderstorms were located over the northern quadrant of the storm. Credit: NASA Worldview, Earth Observing System Data and Information System (EOSDIS)
The Visible Infrared Imaging Radiometer Suite (VIIRS) instrument aboard Suomi NPP provided a visible image of Kiko on Sept. 22 that revealed the storm consisted of a tight circulation of low clouds with intermittent bursts of deep convection. The VIIRS image showed some powerful storms circled the low-level center and a large band of thunderstorms were located over the northern quadrant of the storm.
By early on Sept. 23, Kiko’s structure had improved on satellite imagery.
NOAA’s National Hurricane Center or NHC said, “At 11 a.m. EDT (1500 UTC) on Sept. 23 the center of Tropical Storm Kiko was located near latitude 15.7 north, longitude 135.8 west.
That is about 1,755 miles (2,825 km) west-southwest of the southern tip of Baja California, Mexico. Kiko is moving toward the west-northwest at near 8 mph (13 km/h). This general motion is expected today, followed by a turn toward the northwest on Tuesday. Kiko could begin to turn back toward the west in a few days as it weakens. Maximum sustained winds are near 50 mph (85 kph) with higher gusts. The estimated minimum central pressure is 1002 millibars.
NHC said some additional strengthening is possible today, but weakening is forecast to begin by Tuesday and Kiko is forecast to become a remnant low later this week.
Hurricanes are the most powerful weather event on Earth. NASA’s expertise in space and scientific exploration contributes to essential services provided to the American people by other federal agencies, such as hurricane weather forecasting.
Sep. 20, 2019 – NASA Finds a Tiny Tropical Storm Kiko
NASA’s Terra satellite is one in a fleet of NASA satellites that provide data for research. Terra captured an image of Tropical Storm Kiko in the Eastern Pacific Ocean which showed the extent of the small storm.
On Sept. 19, the MODIS instrument that flies aboard NASA’s Terra satellite provided this image of Tropical Storm Kiko moving toward the Central Pacific Ocean. Credit: NASA Worldview
On Sept. 19, the Moderate Imaging Spectroradiometer or MODIS instrument that flies aboard Terra provided a visible image on Kiko. The image showed that the storm is compact. Tropical-storm-force winds only extend outward up to 45 miles (75 km) from the center making the storm about 90 miles (150km) in diameter.
Since the MODIS image, a pair of microwave satellite images between (5 a.m. and 7 a.m. EDT) 0900 and 1100 UTC on Sept. 20 revealed that Kiko has redeveloped a well-defined low-level inner circulation. NOAA’s National Hurricane Center (NHC) said, “However, most of the deep convection (strongest thunderstorms) associated with the tropical storm is located northeast of the center, a result of moderate southwesterly [wind] shear.”
At 11 a.m. EDT (1500 UTC), the center of Tropical Storm Kiko was located near latitude 17.7 degrees north and longitude 130.2 degrees west. That puts the center about 1,360 miles (2,190 km) west-southwest of the southern tip of Baja California, Mexico. Kiko is moving toward the north-northwest at near 6 mph (9 km/h). A turn toward the west is expected tonight, followed by a turn toward the west-southwest over the weekend. Maximum sustained winds have increased to near 60 mph (95 kph) with higher gusts. Slight additional strengthening is possible today, but only small changes in intensity are expected during the next several days. The estimated minimum central pressure is 999 millibars.
Hurricanes are the most powerful weather event on Earth. NASA’s expertise in space and scientific exploration contributes to essential services provided to the American people by other federal agencies, such as hurricane weather forecasting.
Satellite imagery from NASA-NOAA’s Suomi NPP satellite showed Tropical Storm Kiko maintained its shape and strength after weakening from hurricane-force.
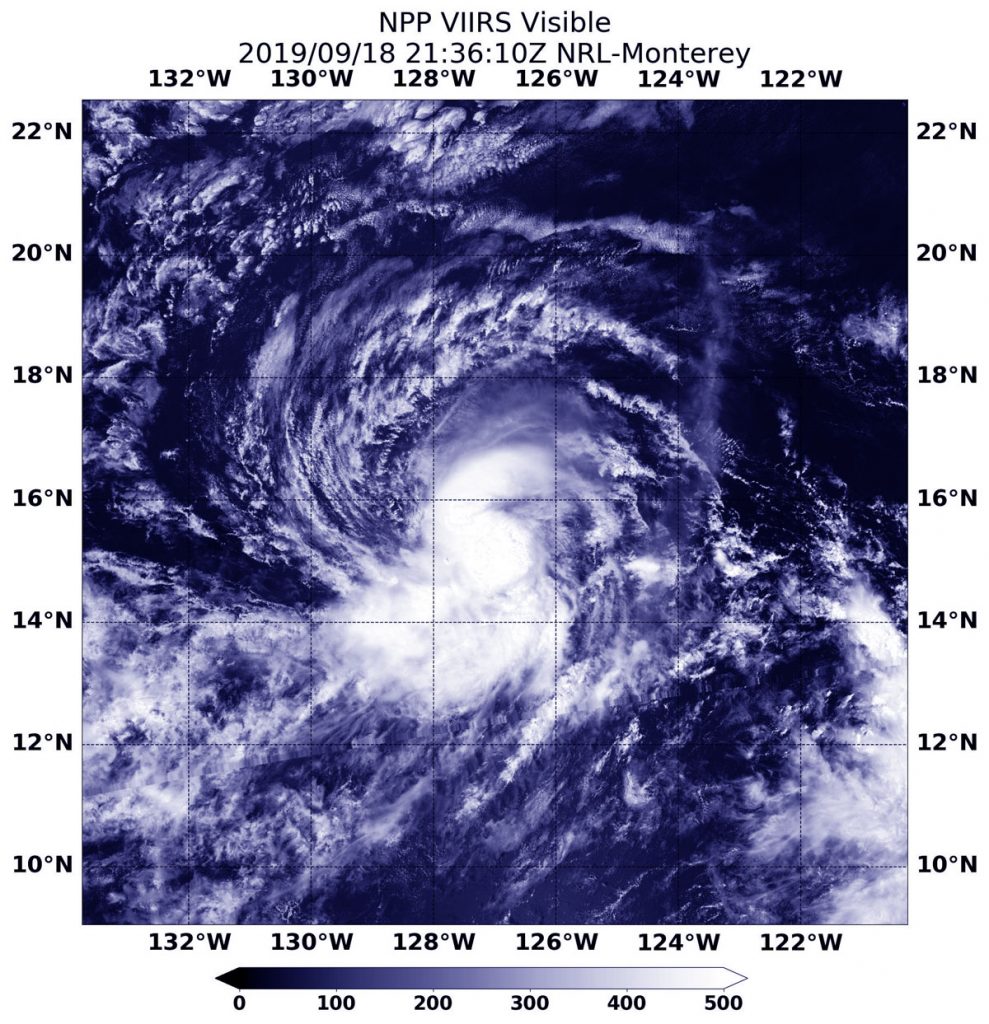
NASA-NOAA’s Suomi NPP satellite passed over Tropical Storm Kiko on Sept. 18 at 5:36 p.m. EDT (2136 UTC) and revealed a circular area of powerful storms around the low-level center. The image showed strong bands of thunderstorms were located over the northern and southern quadrants of the storm. Credit: NASA Worldview, Earth Observing System Data and Information System (EOSDIS)
The Visible Infrared Imaging Radiometer Suite (VIIRS) instrument aboard Suomi NPP provided a visible image of Kiko on Sept. 18 at 5:36 p.m. EDT (2136 UTC) and revealed a circular area of powerful storms around the low-level center. The image showed strong bands of thunderstorms were located over the northern and southern quadrants of the storm. Those bands shifted location by the next day. On Sept. 19, the storm remained relatively compact with deep convection (strongest thunderstorms) organized in bands to the north and east of the low-level center.
Hurricanes are the most powerful weather event on Earth. NASA’s expertise in space and scientific exploration contributes to essential services provided to the American people by other federal agencies, such as hurricane weather forecasting.
NOAA’s National Hurricane Center or NHC said, “At 11 a.m. EDT (1500 UTC) the center of Tropical Storm Kiko was located near latitude 16.0 degrees north and longitude 128.7 degrees west. Kiko is far from land and centered about 1,310 miles (2,110 km) west-southwest of the southernmost tip of Baja California, Mexico. Kiko is moving toward the west near 6 mph (9 kph). Maximum sustained winds are near 65 mph (100 kph) with higher gusts. Slow strengthening is forecast for the next few days, and Kiko may regain hurricane strength on Friday [Sept. 20].”
Hurricane Kiko weakened to a tropical storm, but imagery from NASA-NOAA’s Suomi NPP satellite showed that the storm has maintained strength in the circular area of powerful storms around the low-level center.
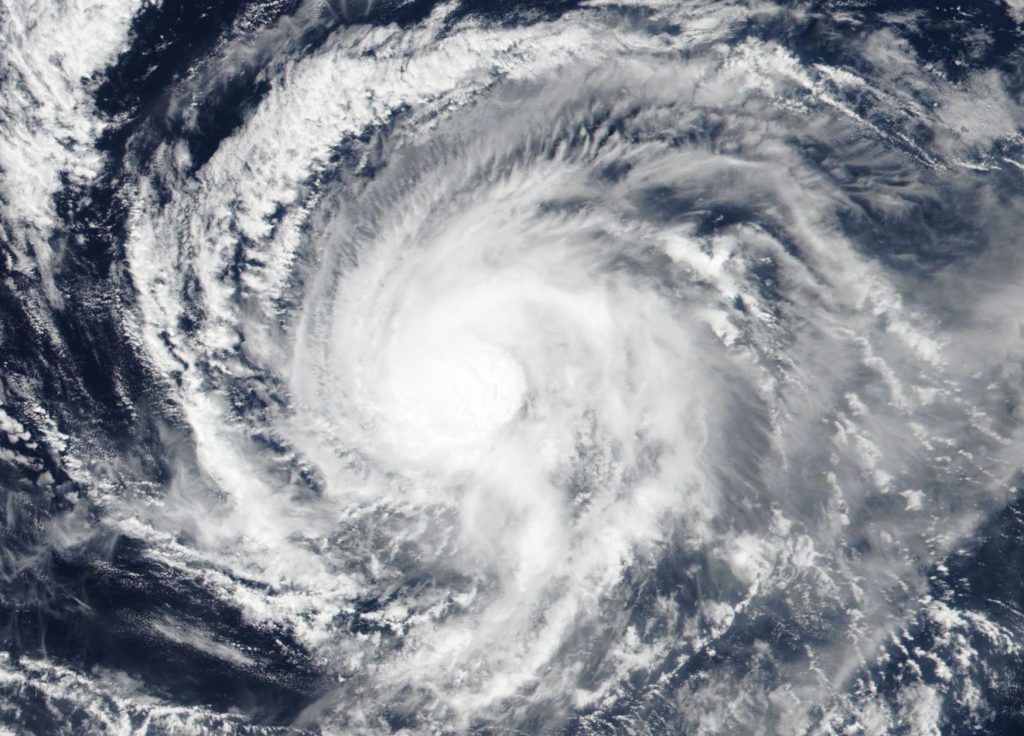
NASA-NOAA’s Suomi NPP satellite passed over Tropical Storm Kiko on Sept. 17 and revealed a circular area of powerful storms around the low-level center. The image showed strong bands of thunderstorms were located over the northern and western quadrants of the storm. Credit: NASA Worldview, Earth Observing System Data and Information System (EOSDIS)
The Visible Infrared Imaging Radiometer Suite (VIIRS) instrument aboard Suomi NPP provided a visible image of Kiko on Sept. 17 revealed that powerful storms circled the low-level center. The image showed strong bands of thunderstorms located over the northern and western quadrants of the storm.
Hurricanes are the most powerful weather event on Earth. NASA’s expertise in space and scientific exploration contributes to essential services provided to the American people by other federal agencies, such as hurricane weather forecasting.
NOAA’s National Hurricane Center or NHC said, “At 11 a.m. EDT (1500 UTC) on Sept. 18, the center of Tropical Storm Kiko was located near latitude 16.0 degrees north and longitude 126.7 degrees west.” That is 1,190 miles (1,920 km) west-southwest of the southernmost tip of Baja California, Mexico.
Kiko is moving toward the west-southwest near 6 mph (9 kph). A westward track is likely later today, followed by a west-northwest motion on Thursday and Friday, and a westward motion on Saturday. Maximum sustained winds are near 60 mph (95 kph) with higher gusts. The estimated minimum central pressure is 1001 millibars. NHC said, “Kiko appears to be stronger this morning with very deep convection near the center, although the cloud pattern is somewhat distorted.”
NHC indicated that Kiko could become a hurricane again on Friday or Saturday [Sept. 20 or 21].
Hurricane Kiko continued to track west through the Eastern Pacific Ocean when NASA-NOAA’s Suomi NPP satellite passed overhead and provided a view of the storm. Satellite imagery revealed an elongated shape, which indicated wind shear was still affecting Kiko.
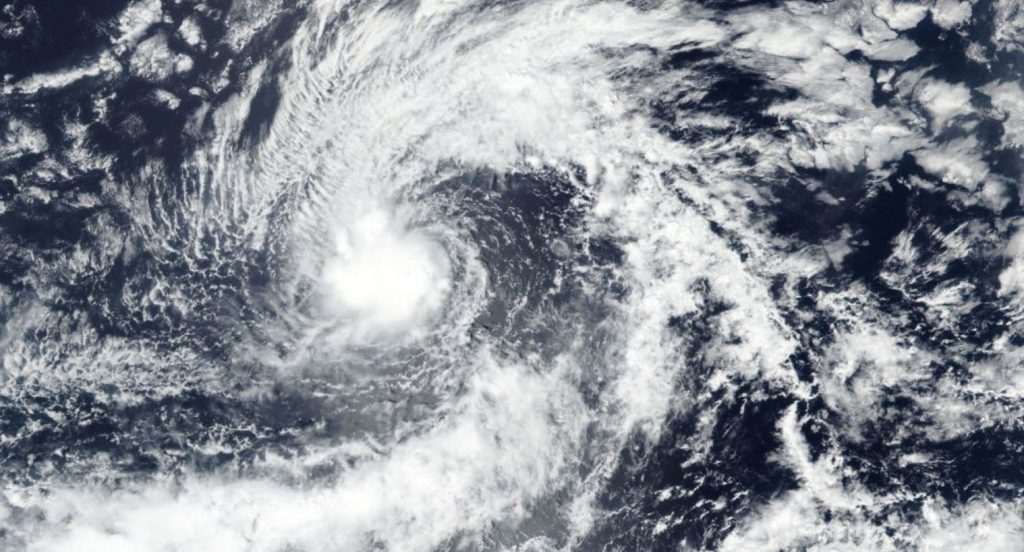
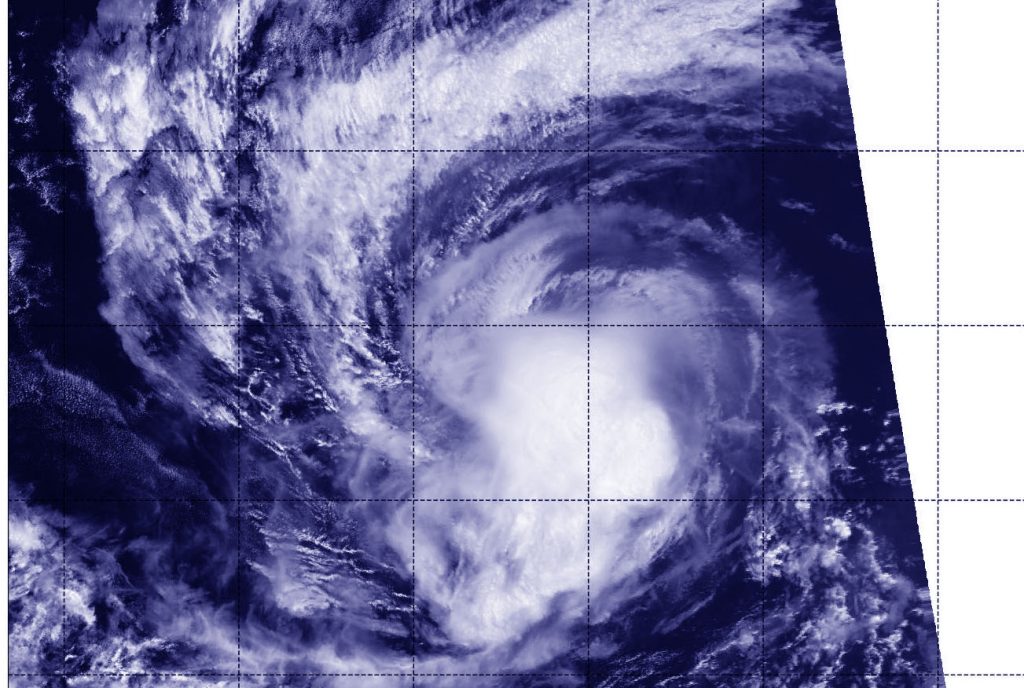
Hurricane Kiko continued to weaken on Sept. 16 at 6:12 p.m. EDT (2212 UTC) when NASA-NOAA’s Suomi NPP satellite passed over the Eastern Pacific Ocean and the VIIRS instrument aboard captured this image of the storm. Credit: NASA/NOAA/NRL
The Visible Infrared Imaging Radiometer Suite (VIIRS) instrument aboard Suomi NPP provided an infrared image of the storm on Sept. 16 at 6:12 p.m. EDT (2212 UTC). The VIIRS image and microwave satellite imagery indicates that the northeasterly wind shear was still affecting Kiko.
In general, wind shear is a measure of how the speed and direction of winds change with altitude. Tropical cyclones are like rotating cylinders of winds. Each level needs to be stacked on top each other vertically in order for the storm to maintain strength or intensify. Wind shear occurs when winds at different levels of the atmosphere push against the rotating cylinder of winds, weakening the rotation by pushing it apart at different levels.
The National Hurricane Center noted that satellite imagery shows an irregular shaped central dense overcast with the anvil clouds being forced to the southwest of center. Anvil clouds form in the upper parts of thunderstorms and the anvils are mostly composed of ice (because they are so high in the atmosphere). They get their anvil shape because rising air in thunderstorms expands and spreads out as the air flattens against the bottom of the stratosphere.
At 5 a.m. EDT (0900 UTC) on Sept. 17, the center of Hurricane Kiko was located near latitude 17.2 degrees north and longitude 124.7 degrees west. That is about 1,035 miles (1,670 km) west-southwest of the southern tip of Baja California, Mexico. Kiko is moving toward the west near 5 mph (7 km/h). A turn to the west-southwest is expected today, followed by a turn to the west to west-northwest by Wednesday.
Maximum sustained winds are near 80 mph (130 kph) with higher gusts. Hurricane-force winds extend outward up to 15 miles (30 km) from the center and tropical-storm-force winds extend outward up to 60 miles (95 km). The estimated minimum central pressure is 985 millibars.
The National Hurricane Center said, “Additional weakening is expected through this evening and Kiko is forecast to become a tropical storm later today. Some slight re-strengthening is possible Wednesday and Thursday.”
Sep. 16, 2019 – NASA Finds Kiko Weakening in the Eastern Pacific
NASA’s Aqua satellite provided forecasters at the National Hurricane Center with infrared data and cloud top temperature information on Hurricane Kiko. Wind shear was affecting the storm and had closed the eye.
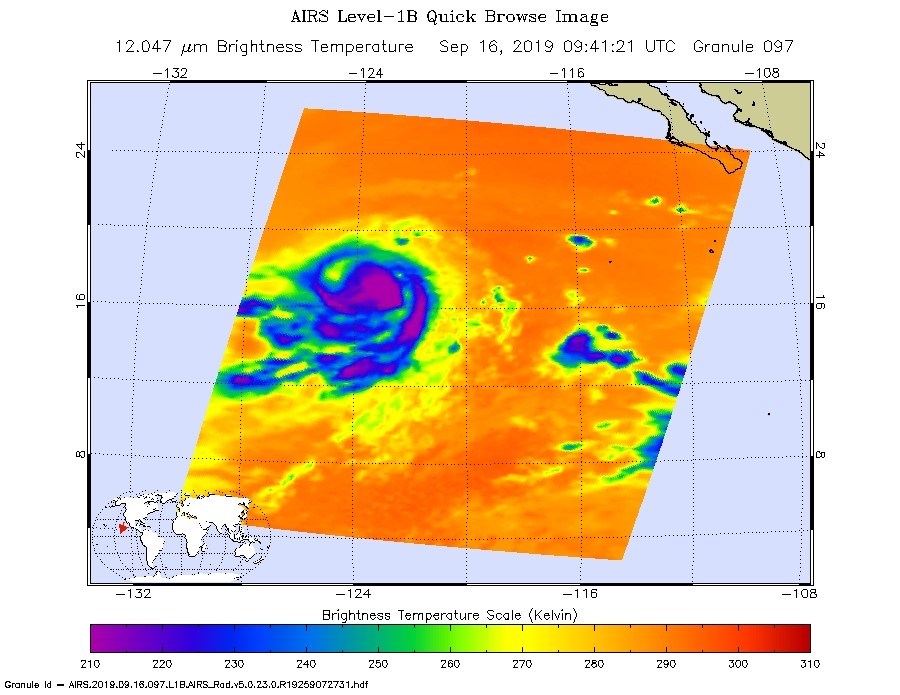
On Sept. 16 at 5:41 a.m. EDT (0941 UTC) the AIRS instrument aboard NASA’s Aqua satellite analyzed cloud top temperatures of Hurricane Kiko in infrared light. AIRS found coldest cloud top temperatures (purple) of strongest thunderstorms were as cold as or colder than minus 63 degrees Fahrenheit (minus 53 degrees Celsius) around the center and in a large bands east and west of center. Credit: NASA JPL/Heidar Thrastarson
On Monday, September 16, 2019, microwave data and satellite imagery continue to indicate that the core of Kiko is being disrupted. Wind shear from the northeast is preventing Kiko from having a closed eyewall circulation. That means that the storm is subject to outside winds and can weaken.
NASA researches tropical cyclones. One of the ways NASA does that is with infrared data that provides temperature information. Cloud top temperatures provide information to forecasters about where the strongest storms are located within a tropical cyclone. Tropical cyclones do not always have uniform strength, and some sides have stronger sides than others. The stronger the storms, the higher they extend into the troposphere, and they have the colder cloud temperatures.
NASA’s Aqua satellite analyzed the storm on Sept. 8 at 11.59 p.m. EDT (Sept. 9 at 0359 UTC) using the Atmospheric Infrared Sounder or AIRS instrument. The AIRS instrument is one of six instruments flying on board NASA’s Aqua satellite, launched on May 4, 2002.
The AIRS infrared data no longer showed an eye in Kiko, indicating that the wind shear from the northeast had filled the center with clouds.
In general, wind shear is a measure of how the speed and direction of winds change with altitude. Tropical cyclones are like rotating cylinders of winds. Each level needs to be stacked on top each other vertically in order for the storm to maintain strength or intensify. Wind shear occurs when winds at different levels of the atmosphere push against the rotating cylinder of winds, weakening the rotation by pushing it apart at different levels.
AIRS found coldest cloud top temperatures as cold as or colder than minus 63 degrees Fahrenheit (minus 53 degrees Celsius) around Kiko’s center and in a large bands east and west of center. NASA research has shown that cloud top temperatures that cold indicate strong storms that have the capability to create heavy rain.
At 11 a.m. EDT (1500 UTC), the center of Hurricane Kiko was located near latitude 17.3 degrees north and longitude 123.7 degrees west. That put the center about 975 miles (1,570 km) west-southwest of the southern tip of Baja California, Mexico. Kiko is moving toward the west near 5 mph (7 kph), and this motion is expected to continue through tonight.
Maximum sustained winds have decreased to near 105 mph (165 kph) with higher gusts. Kiko is a small tropical cyclone. Hurricane-force winds extend outward up to 15 miles (30 km) from the center and tropical-storm-force winds extend outward up to 60 miles (95 km). The estimated minimum central pressure is 971 millibars.
NHC forecasters expect a west-southwestward motion on Sept. 17 followed by a turn back to the west on Wednesday. Gradual weakening is expected during the next couple of days.
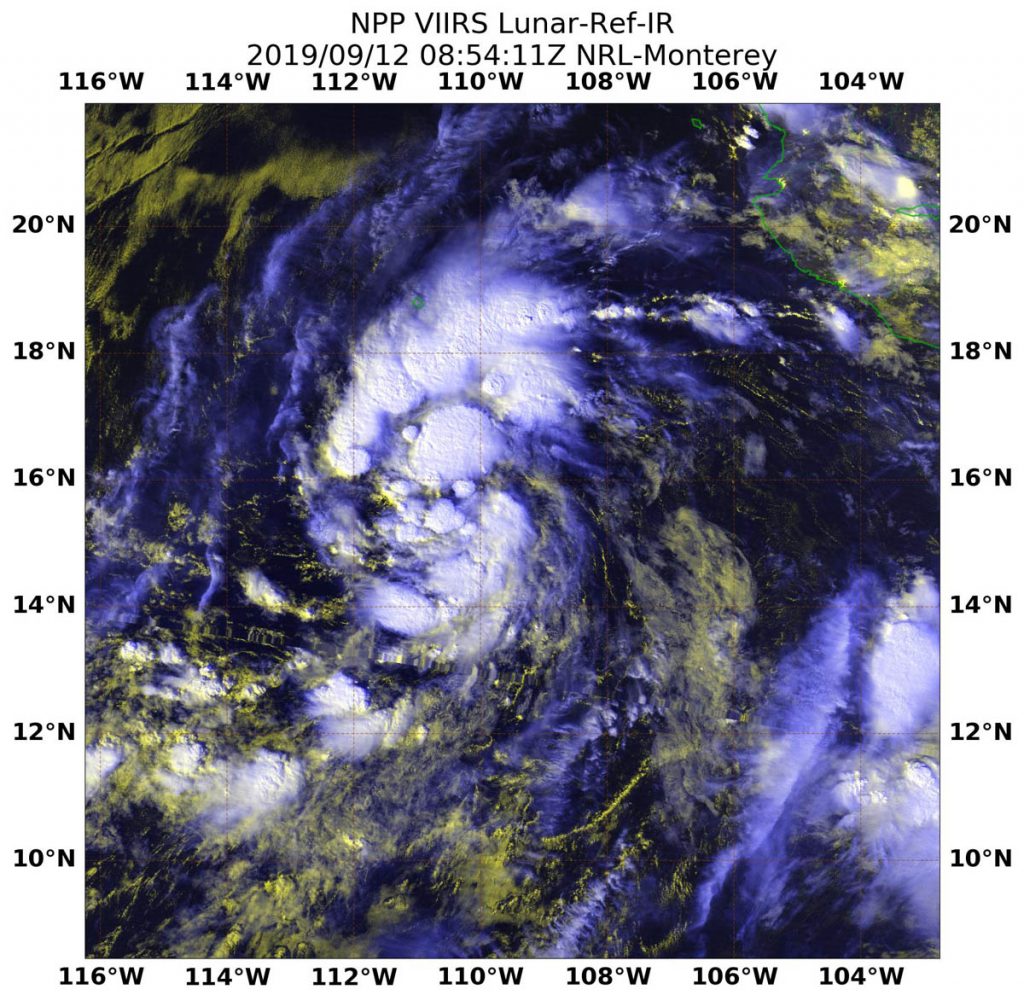
NASA-NOAA’s Suomi NPP satellite passed over the Eastern Pacific Ocean in the early hours of Sept. 12 and grabbed a nighttime look at Tropical Storm Kiko.
NASA-NOAA’s Suomi NPP satellite passed over Tropical Storm Kiko in the Eastern Pacific Ocean and the VIIRS instrument aboard captured this image of the storm on Sept. 12 at 4:54 a.m. EDT (0854 UTC). Credit: NASA/NOAA/NRL
Kiko developed on Sept. 11 as Tropical Depression 13E and strengthened into a tropical storm by 5 p.m. EDT. Once it attained tropical storm status, it was named Kiko.
On Sept. 12 at 4:54 a.m. EDT (0854 UTC), the Visible Infrared Imaging Radiometer Suite (VIIRS) instrument aboard NASA-NOAA’s Suomi NPP provided an infrared image of the strengthening storm. At the time of the overpass the National Hurricane Center (NHC) noted, “There’s a small patch of convection (rising air that formed thunderstorms) near the estimated center, with another larger cluster much farther south. For the most part, however, the circulation consists of a broken low- and mid-level cloud deck with a few embedded showers.” The Suomi NPP image also showed a larger band of thunderstorms had developed north of center.
At 11 a.m. EDT (1500 UTC), the center of Tropical Storm Kiko was located near latitude 16.9 degrees north and longitude 114.4 degrees west. Kiko is far from land and about 505 miles (815 km) southwest of the southern tip of Baja California, Mexico. Kiko was moving toward the west-northwest near 10 mph (17 kph) and this motion is expected to continue through Monday. Maximum sustained winds are near 40 mph (65 km/h) with higher gusts. Estimated minimum central pressure is 1004 millibars.
Some strengthening is forecast during the next 48 hours, and Kiko is expected to approach hurricane strength later this weekend.