Sep. 04, 2019 – NASA Catches the Eye of Typhoon Lingling
Typhoon Lingling continues to strengthen in the Northwestern Pacific Ocean and NASA’s Terra satellite imagery revealed the eye is now visible.
On Sept. 4 at 1:20 a.m. EDT (0520 UTC) the MODIS instrument that flies aboard NASA’s Terra satellite showed powerful thunderstorms circling Typhoon Lingling’s visible eye. Credit: NASA/NRL
On Sept. 4 at 1:20 a.m. EDT (0520 UTC) the Moderate Imaging Spectroradiometer or MODIS instrument that flies aboard NASA’s Terra satellite showed powerful thunderstorms circling Typhoon Lingling’s visible 15 nautical-mile wide eye. The Joint Typhoon Warning Center (JTWC) noted, “Animated enhanced infrared satellite imagery depicts tightly-curved banding wrapping into a ragged eye.” In addition, microwave satellite imagery showed a well-defined microwave eye feature.
At 11 a.m. EDT (1500 UTC), the Joint Typhoon Warning Center or JTWC said that Typhoon Lingling, known locally in the Philippines as Liwayway, had moved away from the Philippines enough that warnings have been dropped.
Lingling was located near 23.0 degrees north latitude and 125.4 degrees east longitude. That is 247 nautical miles southwest of Kadena Air Base, Okinawa, Japan. Lingling was moving to the north-northeast and maximum sustained winds had increased to near 80 knots (75 mph/120.3 kph).
JTWC forecasters said that Lingling is moving north and is expected to intensify to 105 knots (121 mph/194 kph) upon passing between Taiwan and Japan.
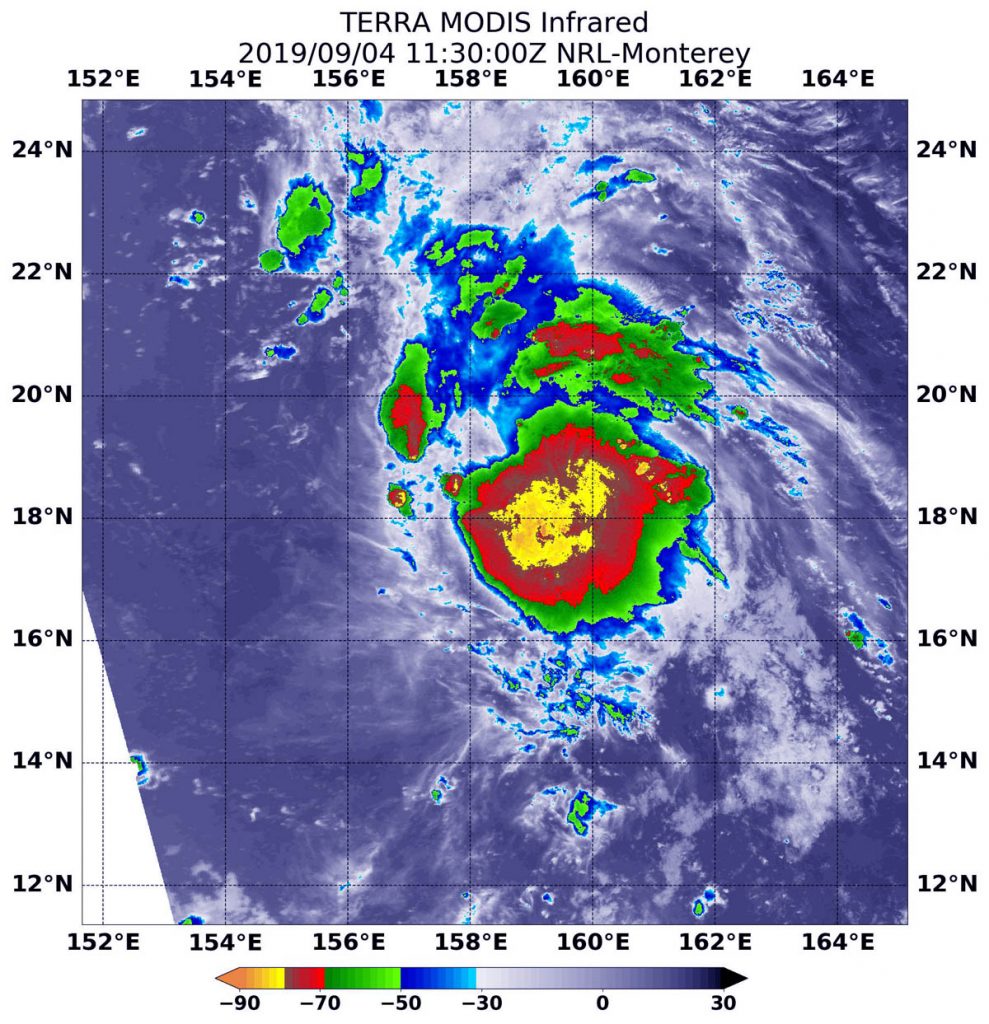
Sep. 04, 2019 – NASA Finds Strongest Storms Off-Center in Tropical Storm 14W
NASA’s Terra satellite provided an infrared view and temperature analysis of Tropical Storm 14W’s cloud tops. Terra satellite showed some powerful thunderstorms in the storm were east of the center.
On Sept. 4 at 7:40 a.m. EDT (1130 UTC ).the MODIS instrument that flies aboard NASA’s Terra satellite showed strong storms (yellow) around 14W’s center where cloud top temperatures were as cold as minus 80 degrees Fahrenheit (minus 62.2 Celsius). Credit: NASA/NRL
On Sept. 4 at 7:40 a.m. EDT (1130 UTC), the Moderate Imaging Spectroradiometer or MODIS instrument that flies aboard NASA’s Terra satellite used infrared light to analyze the strength of storms within the 14W. NASA researches these storms to determine how they rapidly intensify, develop and behave.
The Joint Typhoon Warning Center noted that, “Satellite imagery shows a partially exposed low-level circulation center with an area of deep convection (thunderstorms) offset to the east of the center.” Just as on Sept. 3, the low-level circulation center of the storm remained exposed to outside westerly winds so the strongest thunderstorms continue to be pushed to the eastern side of the storm.
Tropical cyclones are made of up hundreds of thunderstorms, and infrared data can show where the strongest storms are located. They can do that because infrared data provides temperature information, and the strongest thunderstorms that reach highest into the atmosphere have the coldest cloud top temperatures.
MODIS found those strongest storms were around the center of circulation where cloud top temperatures were as cold as minus 80 degrees Fahrenheit (minus 62.2 Celsius). NASA research has found that cloud top temperatures that cold indicate strong storms with the potential to generate heavy rainfall.
The Joint Typhoon Warning Center (JTWC) noted on Sept. 4 at 11 a.m. EDT (1500 UTC), Tropical Storm 14W still had maximum sustained winds near 35 knots (40 mph/65 mph). 14W is far from land areas and is about 1,429 nautical miles southeast of Yokosuka, Japan. 14W is moving to the west.
JTWC said 14W will move west-northwest across the Pacific Ocean and gradually intensify to 90 knots after five days.
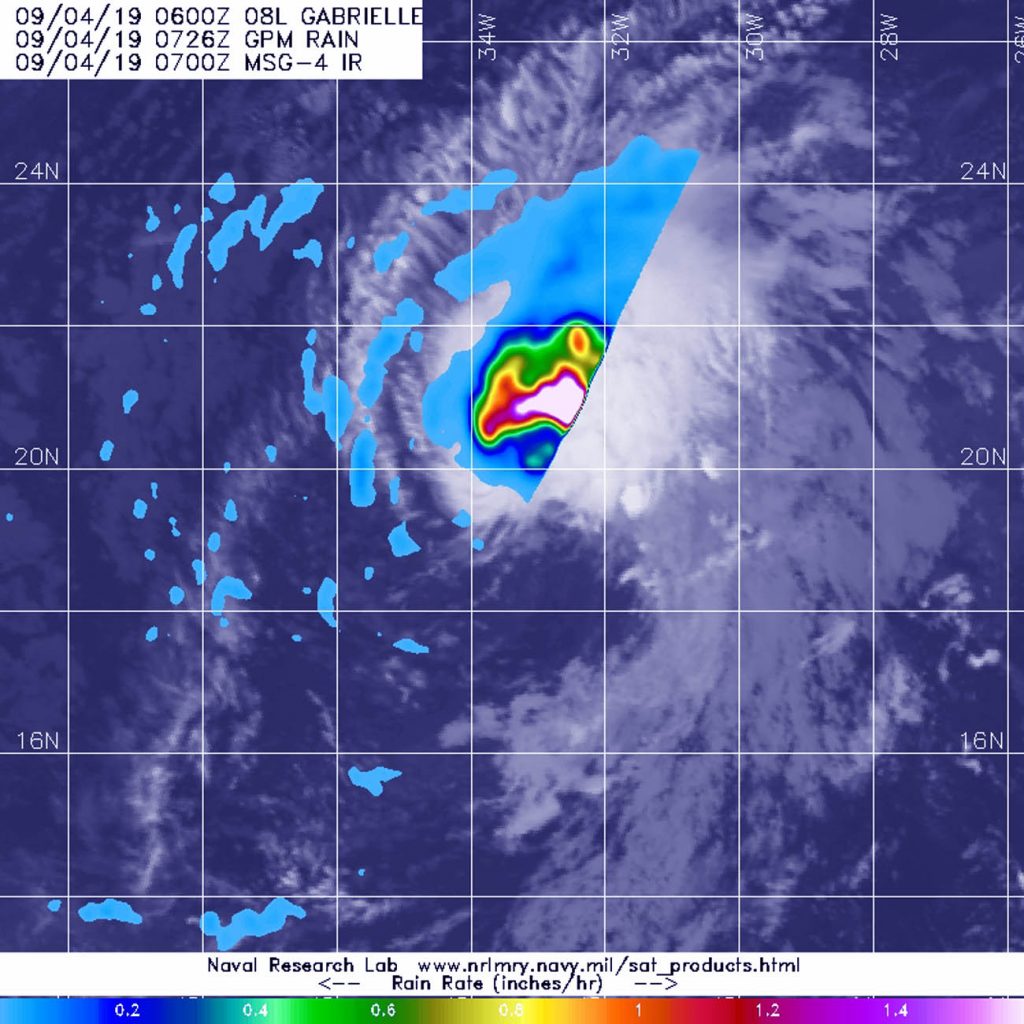
Sep. 04, 2019 – GPM Finds a Band of Heavy Rainfall in Tropical Storm Gabrielle
The Global Precipitation Measurement mission or GPM core satellite provided information about the rate in which rain was falling within the Eastern Atlantic Ocean’s latest tropical storm, Gabrielle.
The GPM core satellite passed over Tropical Storm Gabrielle in the eastern North Atlantic Ocean on Sept. 4 at 3:56 a.m. EDT (0756 UTC). GPM found the heaviest rainfall (pink) north and east of the center where it was falling at a rate of over 40 mm (about 1.6 inch) per hour. Lighter rainfall rates (yellow and blue) were measured around that area. Credit: NASA/JAXA/NRL
Tropical Depression 8 formed around 5 p.m. EDT on Tuesday, Sept. 3. Twelve hours later at 5 a.m. EDT on Sept. 4, the storm intensified into a tropical storm and was renamed Gabrielle.
The GPM or Global Precipitation Measurement mission’s core satellite passed over Tropical Storm Gabrielle in the eastern North Atlantic Ocean on Sept. 4 at 3:56 a.m. EDT (0756 UTC). GPM found the heaviest rainfall north and east of the center where it was falling at a rate of over 40 mm (about 1.6 inch) per hour. The National Hurricane Center said of that area, “A large curved band of thunderstorms has become better defined in the northern semicircle.” Lighter rainfall rates were measured around that area.
GPM is a joint mission between NASA and the Japan Aerospace Exploration Agency, JAXA.
NOAA’s National Hurricane Center noted at 11 a.m. EDT (1500 UTC), the center of Tropical Storm Gabrielle was located near latitude 20.5 degrees north and longitude 33.8 degrees west. That’s about 715 miles (1,150 km) west-northwest of the Cabo Verde Islands. Gabrielle is moving toward the northwest near 9 mph (15 kph), and this motion is expected to continue through Saturday, with an increase in forward speed expected late in the week. Maximum sustained winds have increased to near 50 mph (85 kph) with higher gusts. Little change in strength is forecast during the next few days. The estimated minimum central pressure is 1003 millibars.
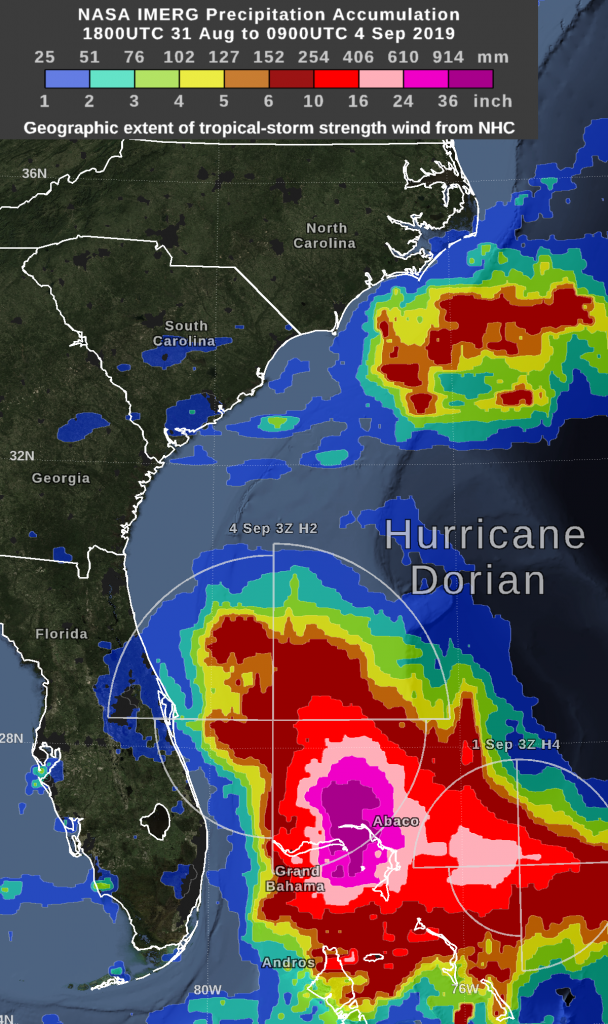
Hurricane Dorian dropped excessive rainfall on the Bahamas and NASA calculated the rainfall the storm generated.
This image shows NASA IMERG estimated rainfall accumulations for the region of the Bahamas affected by Hurricane Dorian from Aug. 31 to Sept. 4. The imagery shows rainfall exceeded 36 inches in an area that included parts of Grand Bahama Island and Abaco Island. Credit: NASA Goddard
“By Wednesday morning, September 4, the rain accumulation from Hurricane Dorian exceeded 36 inches in an area that included parts of Grand Bahama Island and Abaco Island,” said Owen Kelley, researcher at NASA Goddard. “By that time, the Dorian’s center was north of the Bahamas and was moving further north, approximately parallel to Florida’s east coast.”
NASA Estimating Rainfall
NASA has the ability to peer under the clouds of a tropical cyclone and estimate the rainfall rates occurring in a storm or how much rain has fallen. Rainfall imagery was generated using the Integrated Multi-satEllite Retrievals for GPM or IMERG product at NASA’s Goddard Space Flight Center in Greenbelt, Maryland. These near-realtime rain estimates come from the NASA IMERG algorithm, which combines observations from a fleet of satellites in the GPM or Global Precipitation Measurement mission constellation of satellites, and is calibrated with measurements from the GPM Core Observatory as well as rain gauge networks around the world. The measurements are done in near-real time, to provide global estimates of precipitation every 30 minutes.
The storm-total rainfall at a particular location varies with the forward speed of the hurricane, with the size of the hurricane’s wind field, and with how vigorous the updrafts are inside the hurricane.
During the past day, the maximum sustained surface winds speed (Dorian’s intensity) decreased from category 5 to category 2 on the Saffir-Simpson scale. At the same time, the geographic extent of tropical-storm strength winds increased significantly.
Warnings and Watches on Sept. 4
NOAA’s National Hurricane Center (NHC) posted many warnings and watches as Dorian continues to move north along the U.S. East Coast.
A Storm Surge Warning is in effect for Sebastian Inlet, FL to Surf City, NC. A Storm Surge Watch is in effect from north of Surf City, NC to Poquoson, VA, including Hampton Roads, Pamlico and Albemarle Sounds and the Neuse and Pamlico Rivers.
A Hurricane Warning is in effect for Volusia/Brevard County, FL line to Ponte Vedra Beach, FL and from north of the Savannah River to Surf City, NC. A Hurricane Watch is in effect from north of Ponte Vedra Beach, FL to the Savannah River, from north of Surf City, NC to the North Carolina/Virginia border and for the Albemarle and Pamlico Sounds.
A Tropical Storm Warning is in effect from the Sebastian Inlet, FL to the Volusia/Brevard County, FL line and from north of Ponte Vedra Beach, FL to Savannah River. A Tropical Storm Watch is in effect from the North Carolina/Virginia border to Chincoteague, VA and for Chesapeake Bay from Smith Point southward.
NHC: Dorian’s Status on Sept. 4
At 8 EDT (1200 UTC) on Sept. 4, NHC said the center of Hurricane Dorian was located near latitude 29.5 degrees north and longitude 79.6 degrees west. Dorian is about 95 miles (155 km) east-northeast of Daytona Beach, Florida.
Because hurricane-force winds extend outward up to 60 miles (95 km) from the center, and tropical-storm-force winds extend outward up to 175 miles (280 km), Daytona was experiencing those tropical-storm-force winds at 8 a.m. EDT.
Dorian is moving toward the north-northwest near 8 mph (13 kph), and a northwest or north-northwest motion is expected through this morning. Maximum sustained winds are near 105 mph (165 kph) with higher gusts. Some weakening is expected during the next couple of days. However, Dorian is expected to remain a powerful hurricane during the next few days. The minimum central pressure reported by an Air Force Reserve Unit Hurricane Hunter aircraft is 964 millibars.
NOAA’s Forecasts
NHC said, “A turn toward the north is forecast by this evening, followed by a turn toward the north-northeast on Thursday morning. On this track, the core of Hurricane Dorian will move dangerously close to the Florida east coast and the Georgia coast through tonight. The center of Dorian is forecast to move near or over the coast of South Carolina and North Carolina Thursday through Friday morning.”
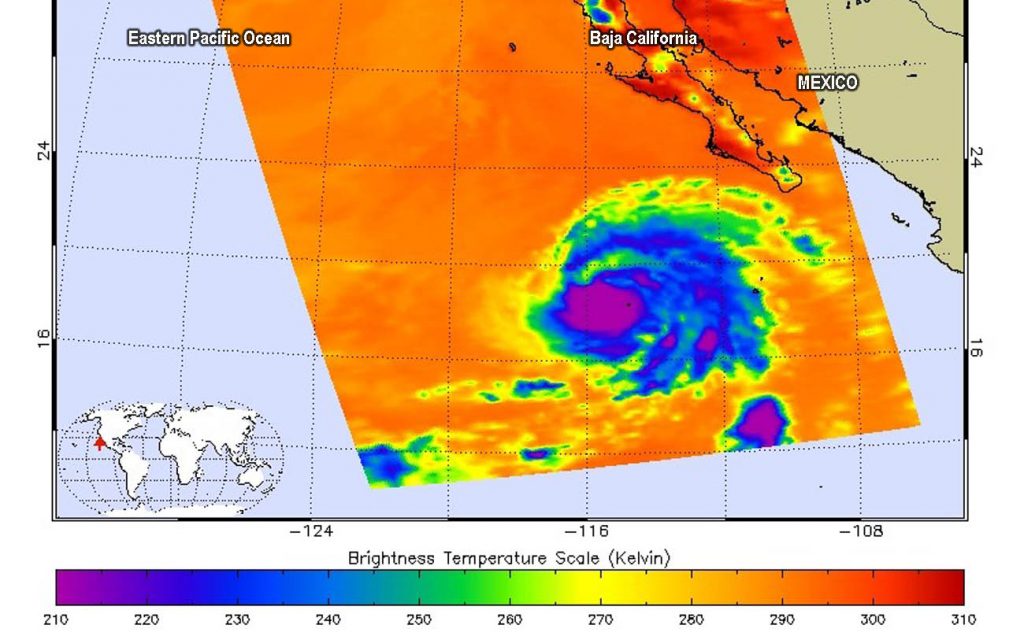
Sep. 04, 2019 – NASA Catches Hurricane Juliette Over Mexico’s Socorro Island
Although Hurricane Juliette is no longer a major hurricane in the Eastern Pacific Ocean, NASA’s Aqua satellite revealed there are still powerful thunderstorms around its center and captured an image of the storm over Socorro Island, Mexico.
On Sept. 3, at 5:05 p.m. EDT (2105 UTC) the AIRS instrument aboard NASA’s Aqua satellite analyzed cloud top temperatures of Hurricane Juliette in infrared light. AIRS found coldest cloud top temperatures (purple) of strongest thunderstorms were as cold as or colder than minus 63 degrees Fahrenheit (minus 53 degrees Celsius) around the center and in fragmented bands of thunderstorms stretching from the north to the southeast. Socorro Island, Mexico is visible as a small black dot in the storm’s eastern quadrant (right). Credit: NASA JPL/Heidar Thrastarson
Aqua provided forecasters at the National Hurricane Center with infrared data and cloud top temperature information that indicate Juliette’s rainmaking capabilities that affected Socorro Island.
Cloud top temperatures provide information to forecasters about where the strongest storms are located within a tropical cyclone. The stronger the storms, the higher they extend into the troposphere with colder cloud temperatures.
NASA’s Aqua satellite analyzed the storm on Sept. 3, at 5:05 p.m. EDT (2105 UTC) using the Atmospheric Infrared Sounder or AIRS instrument. AIRS found coldest cloud top temperatures as cold as or colder than minus 63 degrees Fahrenheit (minus 53 degrees Celsius) around the center and in fragmented bands of thunderstorms stretching from the north to the southeast. NASA research has shown that cloud top temperatures that cold indicate strong storms that have the capability to create heavy rain. That heavy rainfall was experienced by the small number of residents on Socorro Island.
Socorro Island is a small volcanic island in the Revillagigedo Islands. It is about 373 miles (600 km) west of Mexico’s west coast. The island is only 51 square miles or 132 square kilometers. It is the largest of the four islands of the Revillagigedo Archipelago.
On Sept. 3, NOAA’s National Hurricane Center’s (NHC) noted at 5 a.m. EDT (0900 UTC), the center of Hurricane Juliette was located near latitude 19.1 degrees north and, longitude 116.4 degrees west. The center is about 495 miles (795 km) west-southwest of the southern tip of Baja California, Mexico. Juliette is moving toward the west-northwest near 6 mph (9 kph), and this general motion is expected during the next few days. Maximum sustained winds are near 110 mph (175 kph) with higher gusts. The estimated minimum central pressure is 966 millibars.
NHC said that additional slow weakening is forecast during the next several days.
Sep. 04, 2019 – NASA Analyzed Tropical Storm Fernand’s Strength Before Landfall
NASA’s Aqua satellite provided forecasters at the National Hurricane Center with infrared data and cloud top temperature information for Tropical Storm Fernand as it was making landfall in northeastern Mexico. Those temperatures indicated Fernand’s rainmaking capabilities. The infrared data also showed wind shear was affecting the storm.
On Sept. 3, at 5:23 a.m. EDT (0923 UTC) the AIRS instrument aboard NASA’s Aqua satellite analyzed cloud top temperatures of Tropical Storm Fernand in infrared light. AIRS found coldest cloud top temperatures (purple) of strongest thunderstorms were as cold as or colder than minus 63 degrees Fahrenheit (minus 53 degrees Celsius) around the center and in a thick band of thunderstorms over northeastern Mexico. Credit: NASA JPL/Heidar Thrastarson
NASA researches tropical cyclones and infrared data is one of the ways NASA uses. Cloud top temperatures provide information to forecasters about where the strongest storms are located within a tropical cyclone. The stronger the storms, the higher they extend into the troposphere, and they have the colder cloud temperatures.
NASA’s Aqua satellite analyzed the storm on Sept. 3, at 5:23 a.m. EDT (0923 UTC) using the Atmospheric Infrared Sounder or AIRS instrument. AIRS found coldest cloud top temperatures as cold as or colder than minus 63 degrees Fahrenheit (minus 53 degrees Celsius) around the center and in a thick band of thunderstorms over northeastern Mexico. NASA research has shown that cloud top temperatures that cold indicate strong storms that have the capability to create heavy rain.
That heavy rainfall potential is apparent in the warnings posted today. In northeastern Mexico, from Tamaulipas and Central/Southern Nuevo Leon, 6 to 12 inches of rain are possible with isolated 18 inches, highest along the immediate Gulf Coast and in the Sierra Madre Oriental. This rainfall may cause life-threatening flash floods and mudslides. Areas from Northern Nuevo Leon and Southern Coahuila can expect 3 to 6 inches. The south Texas and the lower Texas coast can also expect 2 to 4 inches, with isolated totals to 6 inches. In addition, a tornado or two are possible across far South Texas through this evening.
On Sept. 3, NOAA’s National Hurricane Center’s (NHC) discussion indicated that Fernand has been experiencing moderate easterly to southeasterly vertical wind shear and ingesting dry air in the southeastern semicircle. In general, wind shear is a measure of how the speed and direction of winds change with altitude.
That wind shear was indicated in the AIRS infrared imagery because the southeastern quadrant of Fernand appeared devoid of clouds. That’s an indication that outside winds from the east-southeast were pushing clouds and showers to the west-northwest of the center, where the AIRS imagery showed the bulk of clouds.
On Wednesday, September 4, 2019, a Tropical Storm Warning was in effect from Puerto Altamira to the Mouth of the Rio Grande River.
NHC noted at 8 a.m. EDT (1200 UTC), the center of Tropical Storm Fernand was located near latitude 23.5 North, longitude 97.2 West. Fernand is moving toward the west near 6 mph (9 kph). That puts the center of Fernand about 45 miles (70 km) southeast of La Pesca, Mexico. Maximum sustained winds are near 50 mph (85 kph) with higher gusts. Little change in strength is expected before the center moves onshore. The estimated minimum central pressure is 1000 millibars.
NHC said, “A motion toward the west or west-northwest is expected today, and the center of Fernand is forecast to cross the northeastern coast of Mexico later today or this evening. The cyclone is forecast to move inland over northeastern Mexico by this evening, and then dissipate quickly over the rugged terrain of the Sierra Madre Oriental mountains.”
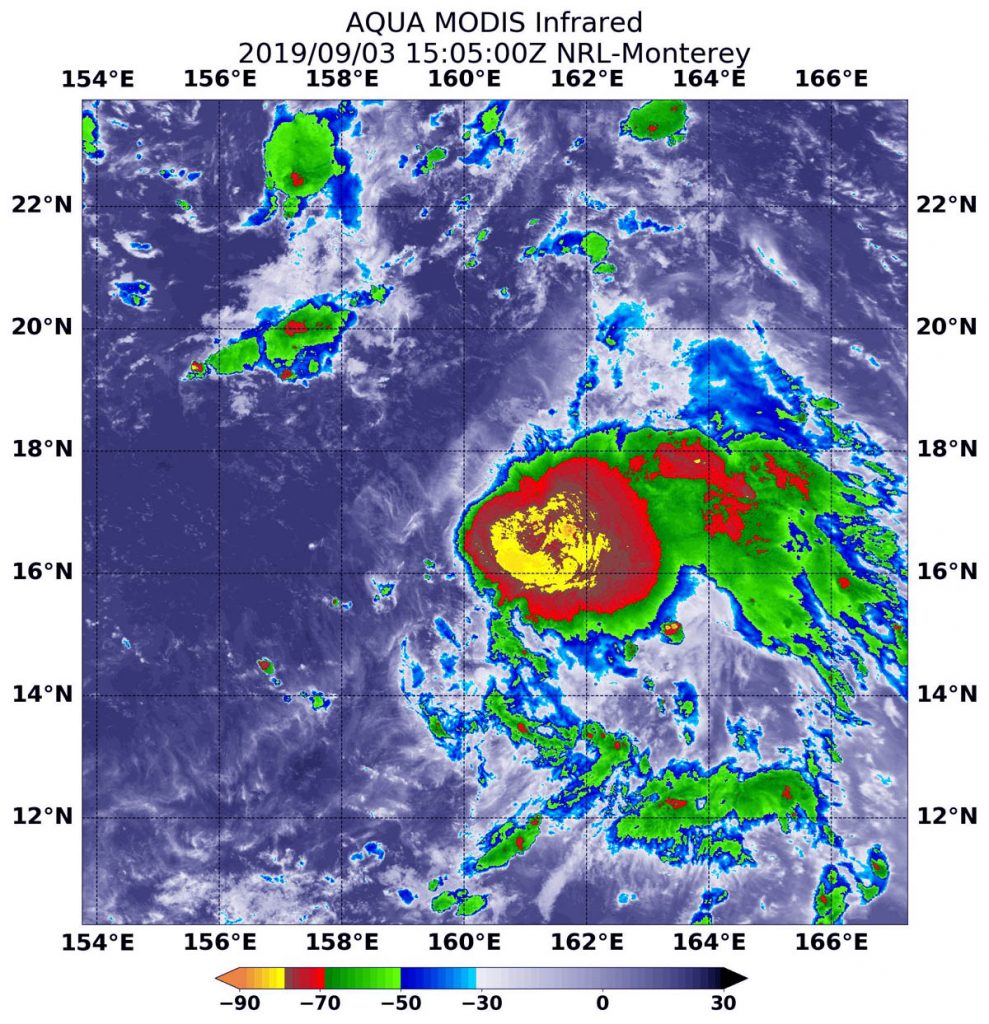
Sep. 03, 2019 – NASA Finds Tropical Storm 14W Strengthening
Tropical Storm 14W formed as a depression a couple of days ago in the Northwestern Pacific Ocean and strengthened into a tropical storm on Sept. 2. Infrared data from NASA’s Aqua satellite shows some powerful thunderstorms fueling further intensification.
On Sept. 3 at 1:05 p.m. EDT (1505 UTC), the MODIS instrument that flies aboard NASA’s Aqua satellite showed strong storms (yellow) around 14W’s center where cloud top temperatures were as cold as minus 80 degrees Fahrenheit (minus 62.2 Celsius). Credit: NASA/NRL
On Sept. 3 at 1:05 p.m. EDT (1505 UTC), the Moderate Imaging Spectroradiometer or MODIS instrument that flies aboard NASA’s Aqua satellite used infrared light to analyze the strength of storms within the 14W. NASA researches these storms to determine how they rapidly intensify, develop and behave. In the data obtained about 14W, the very strong storms found near the center indicate the storm is strengthening.
Tropical cyclones are made of up hundreds of thunderstorms, and infrared data can show where the strongest storms are located. They can do that because infrared data provides temperature information, and the strongest thunderstorms that reach highest into the atmosphere have the coldest cloud top temperatures.
MODIS found those strongest storms were around the center of circulation where cloud top temperatures were as cold as minus 80 degrees Fahrenheit (minus 62.2 Celsius). NASA research has found that cloud top temperatures that cold indicate strong storms with the potential to generate heavy rainfall.
The Joint Typhoon Warning Center (JTWC) noted that, animated enhanced infrared satellite imagery shows that the low-level circulation center of the storm is exposed to outside winds, and that the strongest thunderstorms are being pushed to the eastern side of the storm, because of westerly winds. A microwave image at 6:47 a.m. EDT (1047 UTC) indicates tightly curved shallow banding of thunderstorms wrapping into the center with an isolated area of strong storms over the southeastern quadrant.
On Sept. 3 at 11 a.m. EDT (1500 UTC), Tropical Storm 14W had maximum sustained winds near 35 knots (40 mph/65 mph). 14W is far from land areas and is about 1,566 nautical miles southeast of Yokosuka, Japan. 14W is moving to the west.
JTWC said 14W will move west-northwest across the Pacific Ocean. The JTWC expects the system will gradually intensify to 90 knots after five days and move toward Japan.
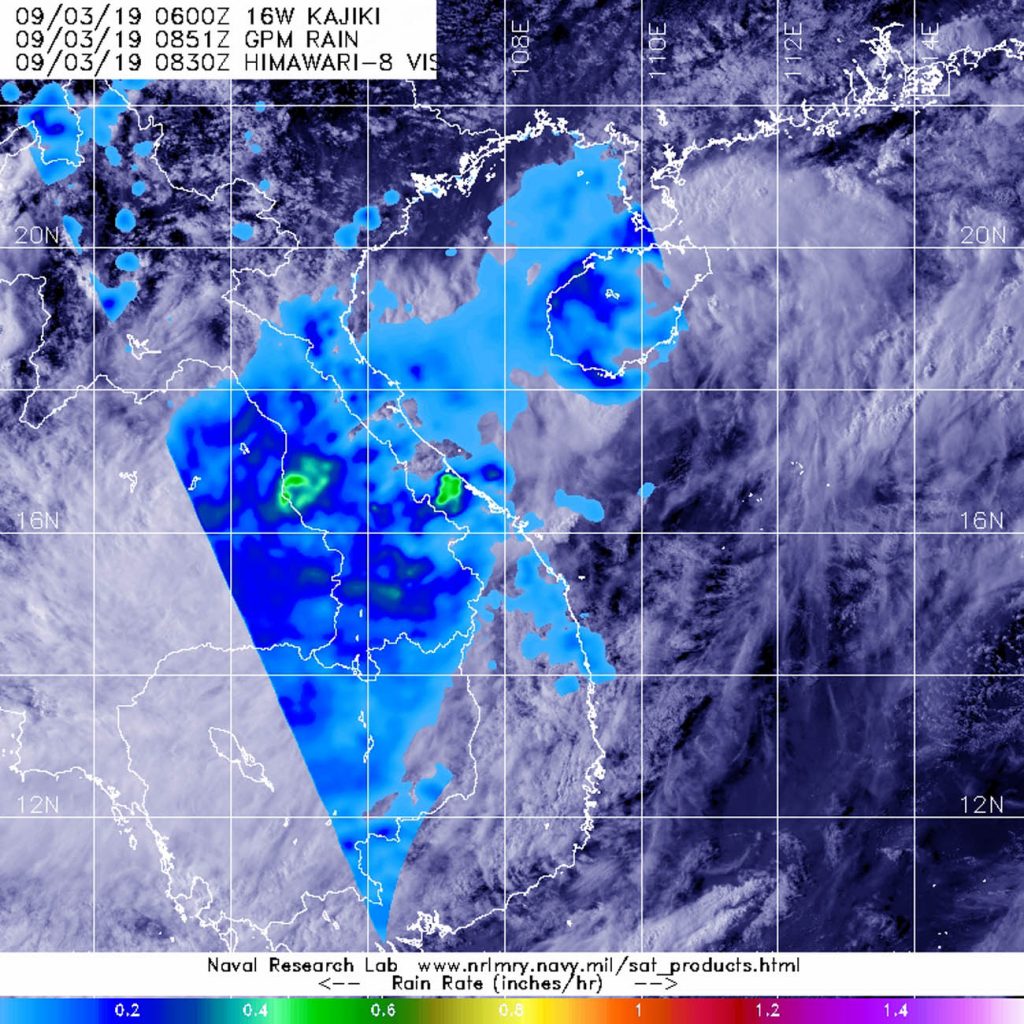
Sep. 03, 2019 – GPM Analyzes Tropical Depression Kajiki’s Rainfall Over Vietnam and Laos
The Global Precipitation Measurement mission or GPM core satellite provided a look at rainfall rates in Tropical Depression Kajiki after it made a quick landfall in Vietnam.
The GPM core satellite passed over Tropical Depression Kajiki in the South China Sea on Sept. 4 at 4:51 a.m. EDT (0851 UTC). GPM found the heaviest rainfall (yellow) in areas over central Vietnam and Laos, where it was falling at a rate of 20 mm (about 0.8 inch) per hour. Lighter rainfall rates (blue) around those areas was between 0.2 and 0.4 inches (5 and 10 mm) per hour. Light rain was also falling over Hainan Island, China (blue). The GPM rain data was overlaid on Japan’s Himawari-8 satellite visible imagery of clouds. Credit: NASA/JAXA/NRL
On Sept. 2, Kajiki formed as Tropical Depression 16W in the South China Sea close to the Vietnam coast. It briefly strengthened to a tropical storm and was renamed Kajiki before weakening back to depression status.
The GPM satellite passed over the South China Sea and analyzed the rain rates throughout the storm on Sept. 3 at 4:51 a.m. EDT (0851 UTC). GPM found the heaviest rainfall in areas over central Vietnam and Laos, where it was falling at a rate of 20 mm (about 0.8 inch) per hour. Lighter rainfall rates around those areas was between 0.2 and 0.4 inches (5 and 10 mm) per hour. Light rain was also falling over Hainan Island, China. GPM is a joint mission between NASA and the Japan Aerospace Exploration Agency, JAXA. NASA researches tropical cyclones and provides data to international partners to use in their forecasting.
At 11 a.m. EDT (1500 UTC), Tropical Depression Kajiki had maximum sustained winds near 30 knots (34.5 mph/55.5 kph). It was centered near 16.3 degrees north latitude and 107.4 degrees east longitude, about 55 nautical miles west-northwest of Da Nang, Vietnam.
The Joint Typhoon Warning Center noted that Kajiki made landfall into Vietnam, but will move back out over water. The system is forecast to dissipate within a day or so.
Sep. 03, 2019 – NASA Infrared Eye Analyzes Typhoon Lingling
The storm that became Typhoon Lingling strengthened very quickly in the Northwestern Pacific Ocean and infrared imagery from NASA revealed the powerful thunderstorms fueling that intensification.
On Sept. 3 at 12:05 p.m. EDT (1405 UTC) the MODIS instrument that flies aboard NASA’s Terra satellite showed areas northeast and southeast of Typhoon Lingling’s center where cloud top temperatures were as cold as minus 80 degrees Fahrenheit (minus 62.2 Celsius). Credit: NASA/NRL
Lingling formed on Sept. 2 as Tropical Depression 15W and strengthened quickly into a tropical storm and then a typhoon. Although Lingling is to the northeast of Luzon, northern Philippines, there are still some warning signals in effect on Sept. 3. Tropical cyclone wind signal #1 is in effect over the Luzon province of Batanes.
On Sept. 3 at 12:05 p.m. EDT (1405 UTC), the Moderate Imaging Spectroradiometer or MODIS instrument that flies aboard NASA’s Terra satellite used infrared light to analyze the strength of storms within the typhoon. NASA researches these storms to determine how they rapidly intensify, develop and behave.
Tropical cyclones are made of up hundreds of thunderstorms, and infrared data can show where the strongest storms are located. They can do that because infrared data provides temperature information, and the strongest thunderstorms that reach highest into the atmosphere have the coldest cloud top temperatures.
MODIS found those strongest storms were northeast and southeast of the center of circulation where cloud top temperatures were as cold as minus 80 degrees Fahrenheit (minus 62.2 Celsius). NASA research has found that cloud top temperatures that cold indicate strong storms with the potential to generate heavy rainfall.
At 11 a.m. EDT (1500 UTC), the Joint Typhoon Warning Center or JTWC said that Typhoon Lingling, known locally in the Philippines as Liwayway was located near 21.4 degrees north latitude and 124.2 degrees east longitude. That is 364 nautical miles southwest of Kadena Air Base, Okinawa, Japan. Lingling was moving to the north and had maximum sustained winds near 65 knots (75 mph/120.3 kph).
JTWC forecasters said that Lingling is moving north and is expected to intensify to 100 knots (115 mph/185 kph) upon passing east of Taiwan. The system will then weaken on approach to the Korean peninsula, but still be at typhoon strength.
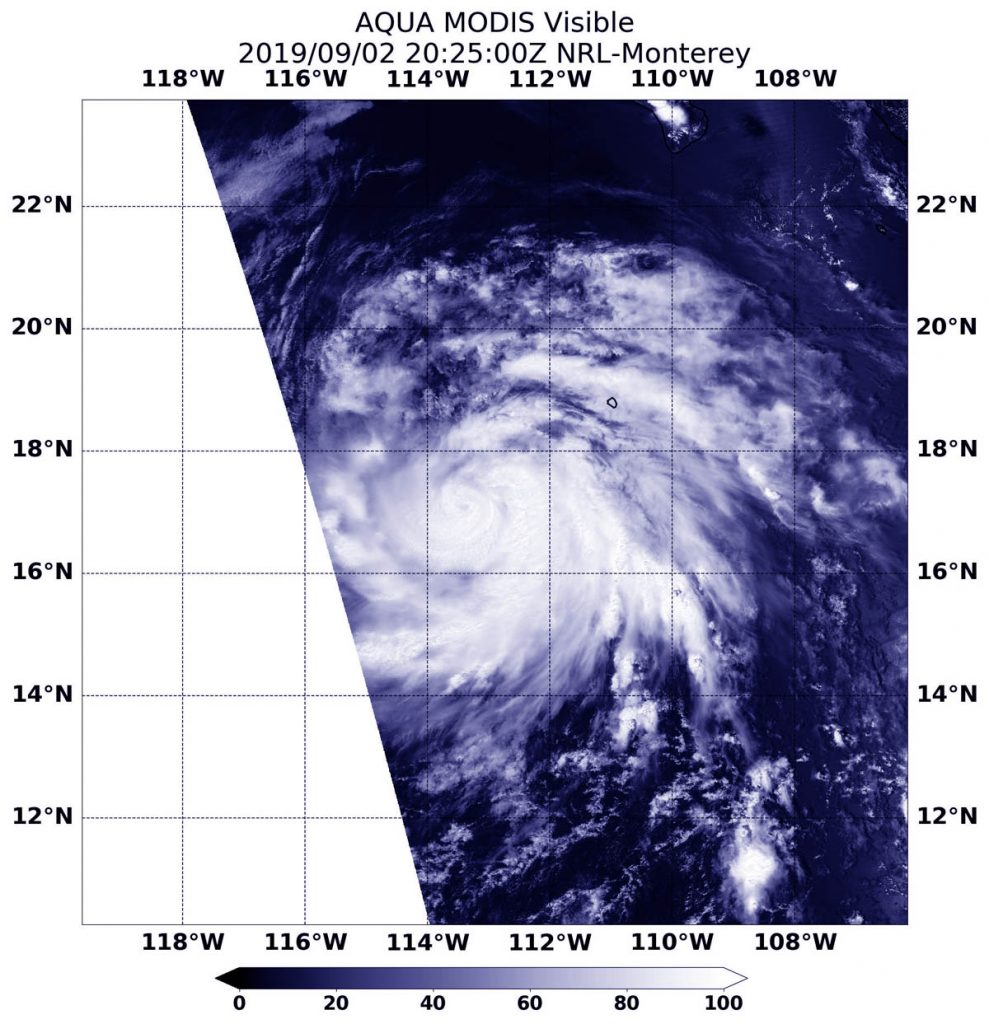
Sep. 03, 2019 – Major Hurricane Juliette’s Emerging Eye Spotted in NASA Satellite Imagery
NASA’s Aqua satellite passed over the Eastern Pacific Ocean and provided an image of Hurricane Juliette as its eye began to emerge. Juliette has grown into a major hurricane, about 450 miles southwest of the southern tip of Baja California, Mexico.
On Sept. 2, 2019 at 4:25 p.m. EDT (2025 UTC) the MODIS instrument aboard NASA’s Aqua satellite provided a visible image of Hurricane Juliette in the Eastern Pacific Ocean as its eye began to show. Credit: NASA/NRL
Juliette developed on Sunday, Sept 1 around 5 a.m. EDT (0900 UTC) as a tropical storm. By 5 p.m. EDT on Sept. 2, the storm had strengthened into a hurricane.
On Sept. 2, 2019 at 4:25 p.m. EDT (2025 UTC) the Moderate Resolution Imaging Spectroradiometer or MODIS instrument aboard NASA’s Aqua satellite provided a visible image of Hurricane Juliette that revealed its emerging eye around a thick tight circle of powerful thunderstorms. Hurricane-force winds extend outward up to 35 miles (55 km) from the center and tropical-storm-force winds extend outward up to 125 miles (205 km).
NASA researches hurricanes to better understand their behavior, and provides data to forecasters at NOAA’s NHC or National Hurricane Center to assist in their forecasting.
On Sept. 3 at 11 a.m. EDT (1500 UTC), NOAA’s National Hurricane Center said the eye of Hurricane Juliette was located near latitude 18.4 degrees north and longitude 115.0 degrees west. That’s about 455 miles (730 km) southwest of the southern tip of Baja California, Mexico. Juliette is moving toward the northwest near 8 mph (13 kph), and a northwest to west-northwest motion is expected through Friday. Maximum sustained winds have increased to near 125 mph (205 kph) with higher gusts. Juliette is a category 3 hurricane on the Saffir-Simpson Hurricane Wind Scale. The estimated minimum central pressure is 953 millibars based on satellite estimates and data from the Mexican Navy station on Clarion Island.
NHC said. “Some strengthening is possible today, with weakening forecast to begin by late Wednesday and continuing through Friday.”