Faxai (was 14W) – Northwestern Pacific Ocean

Sep. 10, 2019 – NASA Finds Faxai Now Extra-tropical in Pacific Ocean

NASA’s Aqua satellite passed over the Northwestern Pacific Ocean from its orbit in space and took an image that showed vertical wind shear was weakening Faxai and the storm had become extra-tropical.

Aqua image of Faxai
On Sept. 10, 2019 at 0310 UTC (Sept. 9 at 11:10 p.m. EDT) the MODIS instrument aboard NASA’s Aqua satellite provided a visible image of extra-tropical storm Faxai that showed wind shear was pushing clouds and storms east of the center and elongating the storm. Credit: NASA/NRL

On Sept. 9, the Joint Typhoon Warning Center or JTWC posted its last advisory on the system as it continues to weaken. At 5 p.m. EDT (2100 UTC), the JTWC stated that Faxai’s center was located near latitude 39.4 degrees north and longitude 147.7 degrees east. That is about 254 nautical miles east-southeast of Misawa, Japan. Faxai was moving to the east-northeast. Maximum sustained winds were near 45 knots (52 mph/83 kph). Faxai had begun its extra-tropical transition as it entered the baroclinic zone over the colder waters.

On Sept. 10, 2019 at 0310 UTC (Sept. 9 at 11:10 p.m. EDT) the Moderate Resolution Imaging Spectroradiometer or MODIS instrument aboard NASA’s Aqua satellite provided a visible image of Tropical Storm Faxai that showed wind shear was pushing clouds and storms east of the center.

In general, wind shear is a measure of how the speed and direction of winds change with altitude. Tropical cyclones are like rotating cylinders of winds. Each level needs to be stacked on top each other vertically in order for the storm to maintain strength or intensify. Wind shear occurs when winds at different levels of the atmosphere push against the rotating cylinder of winds, weakening the rotation by pushing it apart at different levels.

The imagery showed the system continued to rapidly decay and elongate. Faxai had transitioned into an extra-tropical storm and was a strong gale-force cold core low-pressure area with a large wind field. A tropical cyclone becomes extra-tropical when its warm core becomes a cold core, like a typical mid-latitude low-pressure area.

When a storm becomes “extra-tropical”, it means that a tropical cyclone has lost its “tropical” characteristics. The National Hurricane Center defines “extra-tropical” as a transition that implies both poleward displacement (meaning it moves toward the north or south pole) of the cyclone and the conversion of the cyclone’s primary energy source from the release of latent heat of condensation to baroclinic (the temperature contrast between warm and cold air masses) processes. It is important to note that cyclones can become extratropical and still retain winds of hurricane or tropical storm force.

Faxai will continue to track through the Northern Pacific Ocean as an extra-tropical storm for the next several days.

By Rob Gutro
NASA’s Goddard Space Flight Center

Faxai (was 14W) – Northwestern Pacific Ocean

Sep. 09, 2019 – NASA Finds Tropical Storm Faxai’s Heavy Rainmaking Storms Off-Shore from Japan

The big island of Japan received Tropical Storm Faxai and NASA’s Aqua satellite provided forecasters at the Joint Typhoon Warning Center infrared data and cloud top temperature information that revealed the most powerful storms just off-shore when the satellite flew overhead.

AIRS image of Faxai
On Sept. 8 at 11.59 p.m. EDT (Sept. 9 at 0359 UTC) the AIRS instrument aboard NASA’s Aqua satellite analyzed cloud top temperatures of Tropical Storm Faxai in infrared light. AIRS found coldest cloud top temperatures (purple) of strongest thunderstorms were as cold as or colder than minus 63 degrees Fahrenheit (minus 53 degrees Celsius) around the center and in a large band east of center. Credit: NASA JPL/Heidar Thrastarson

NASA researches tropical cyclones and one of the ways NASA does that is with infrared data that provides temperature information. Cloud top temperatures provide information to forecasters about where the strongest storms are located within a tropical cyclone. Tropical cyclones do not always have uniform strength, and some sides have stronger sides than others. The stronger the storms, the higher they extend into the troposphere, and they have the colder cloud temperatures.

NASA’s Aqua satellite analyzed the storm on Sept. 8 at 11:59 p.m. EDT (Sept. 9 at 0359 UTC) using the Atmospheric Infrared Sounder or AIRS instrument. AIRS found coldest cloud top temperatures as cold as or colder than minus 63 degrees Fahrenheit (minus 53 degrees Celsius) around Faxai’s center and in a large band east of center. NASA research has shown that cloud top temperatures that cold indicate strong storms that have the capability to create heavy rain.

Satellite imagery has revealed that Faxai continues to decay as it moves east of Honshu, Japan over the cooler waters of the Pacific Ocean.

Typhoon Faxai made landfall just east of Tokyo on Sept. 8. Japan’s Kyodo News Service reported that 3 people were killed and 700,000 people were left without power.

On Sept. 8 at 11:59 p.m. EDT (Sept. 9 at 0359 UTC) the center of Faxai was located near latitude 38.2 degrees north and longitude 144.5 degrees west. That places the center 289 nautical miles northeast of Yokosuka, Japan. Faxai is moving toward the east-northeast. Maximum sustained winds are near 55 knots.

Faxai is moving northeast and forecasters at the Joint Tropical Storm Warning Center expect Faxai will become extra-tropical.

For updated forecasts from the Japan Meteorological Agency, visit: https://www.jma.go.jp/en/typh/

By Rob Gutro
NASA’s Goddard Space Flight Center  

Faxai (was 14W) – Northwestern Pacific Ocean

Sep. 05, 2019 – Tropical Storm Faxai Gets a Name and NASA Gets an Infrared Picture

Tropical Storm 14W has been moving through the Northwestern Pacific Ocean for several days and has now been renamed Faxai. NASA’s Aqua satellite passed over the newly renamed storm and took the temperature of Faxai’s clouds and storms.

Aqua image of Faxai
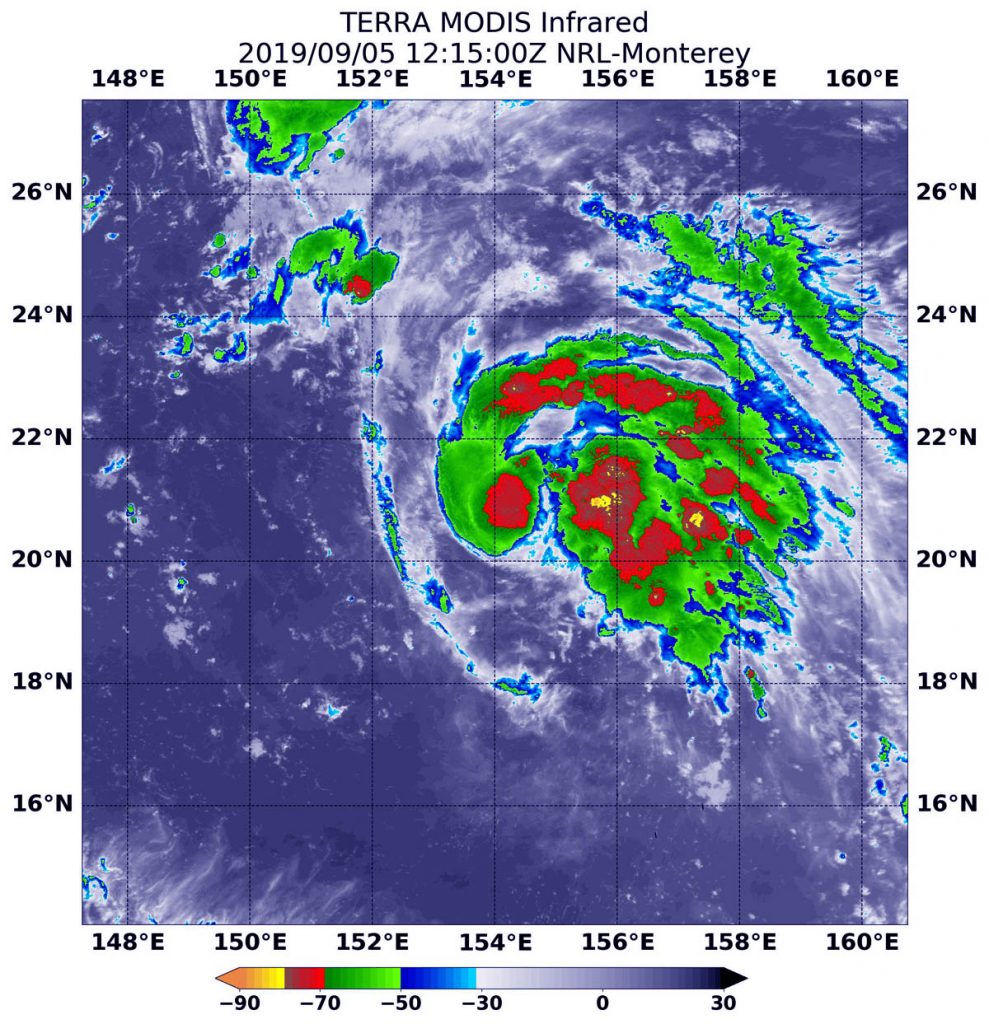
On Sept. 5 at 8:15 a.m. EDT (1215 UTC), the MODIS instrument that flies aboard NASA’s Aqua satellite showed strongest storms around Faxai’s center and in a curved band of thunderstorms from west to north to east. In those areas, cloud top temperatures were as cold as minus 70 degrees Fahrenheit (minus 56.6 Celsius). Credit: NASA/NRL

NASA’s Terra satellite used infrared light to analyze the strength of storms in the remnants of Tropical Storm Faxai. Infrared data provides temperature information, and the strongest thunderstorms that reach high into the atmosphere have the coldest cloud top temperatures.

On Sept. 5 at 8:15 a.m. EDT (1215 UTC), the Moderate Imaging Spectroradiometer or MODIS instrument that flies aboard NASA’s Terra satellite found strongest thunderstorms had cloud top temperatures as cold as or colder than minus 70 degrees Fahrenheit (minus 56.6 Celsius). Those temperatures were in cloud tops of storms around the low-level center of circulation and in a thick band of thunderstorms that wrapped around the storm from west to north to east. Cloud top temperatures that cold indicate strong storms with the potential to generate heavy rainfall.

The imagery also showed the southwestern side was cloud free, and that is because of sinking air, or subsidence, which prevents the development of thunderstorms. It is being caused by an elongated area of low pressure located to the south of the storm and a Tutt Cell to the north. A Tutt Cell is a Tropical Upper Tropospheric Trough (elongated area of low pressure).

On Sept. 5 at 11 a.m. EDT (1500 UTC), Tropical Storm Faxai, formerly known as 14W, was located near 20.8 degrees north latitude and 154.0 degrees east longitude. That is about 742 nautical miles east-southeast of Iwo To island, Japan. Faxai was moving to the north-northwest and had maximum sustained winds 40 knots (46 mph/74 kph).

The Joint Typhoon Warning Center (JTWC) expects Faxai will move west-northwest across the Northwestern Pacific Ocean and turn north after three days. It is expected to make landfall near Tokyo at 80 knots on Sunday, Sept. 8.

By Rob Gutro
NASA’s Goddard Space Flight Center

14W – Northwestern Pacific Ocean

Sep. 04, 2019 – NASA Finds Strongest Storms Off-Center in Tropical Storm 14W  

NASA’s Terra satellite provided an infrared view and temperature analysis of Tropical Storm 14W’s cloud tops. Terra satellite showed some powerful thunderstorms in the storm were east of the center.

Terra image of 14W
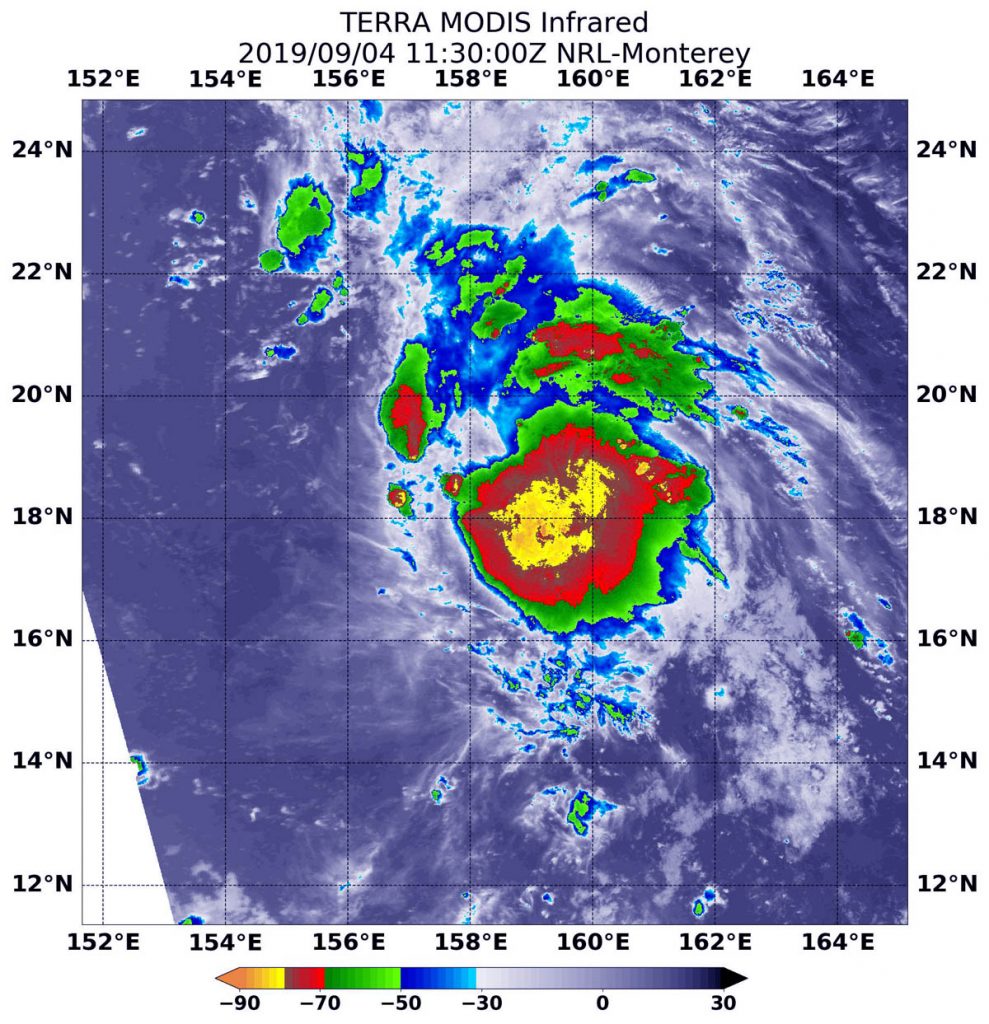
On Sept. 4 at 7:40 a.m. EDT (1130 UTC ).the MODIS instrument that flies aboard NASA’s Terra satellite showed strong storms (yellow) around 14W’s center where cloud top temperatures were as cold as minus 80 degrees Fahrenheit (minus 62.2 Celsius). Credit: NASA/NRL

On Sept. 4 at 7:40 a.m. EDT (1130 UTC), the Moderate Imaging Spectroradiometer or MODIS instrument that flies aboard NASA’s Terra satellite used infrared light to analyze the strength of storms within the 14W. NASA researches these storms to determine how they rapidly intensify, develop and behave.

The Joint Typhoon Warning Center noted that, “Satellite imagery shows a partially exposed low-level circulation center with an area of deep convection (thunderstorms) offset to the east of the center.” Just as on Sept. 3, the low-level circulation center of the storm remained exposed to outside westerly winds so the strongest thunderstorms continue to be pushed to the eastern side of the storm.

Tropical cyclones are made of up hundreds of thunderstorms, and infrared data can show where the strongest storms are located. They can do that because infrared data provides temperature information, and the strongest thunderstorms that reach highest into the atmosphere have the coldest cloud top temperatures.

MODIS found those strongest storms were around the center of circulation where cloud top temperatures were as cold as minus 80 degrees Fahrenheit (minus 62.2 Celsius). NASA research has found that cloud top temperatures that cold indicate strong storms with the potential to generate heavy rainfall.

The Joint Typhoon Warning Center (JTWC) noted on Sept. 4 at 11 a.m. EDT (1500 UTC), Tropical Storm 14W still had maximum sustained winds near 35 knots (40 mph/65 mph). 14W is far from land areas and is about 1,429 nautical miles southeast of Yokosuka, Japan. 14W is moving to the west.

JTWC said 14W will move west-northwest across the Pacific Ocean and gradually intensify to 90 knots after five days.

By Rob Gutro
NASA’s Goddard Space Flight Center

14W – Northwestern Pacific Ocean

Sep. 03, 2019 – NASA Finds Tropical Storm 14W Strengthening

Tropical Storm 14W formed as a depression a couple of days ago in the Northwestern Pacific Ocean and strengthened into a tropical storm on Sept. 2. Infrared data from NASA’s Aqua satellite shows some powerful thunderstorms fueling further intensification.

Aqua image of 14W
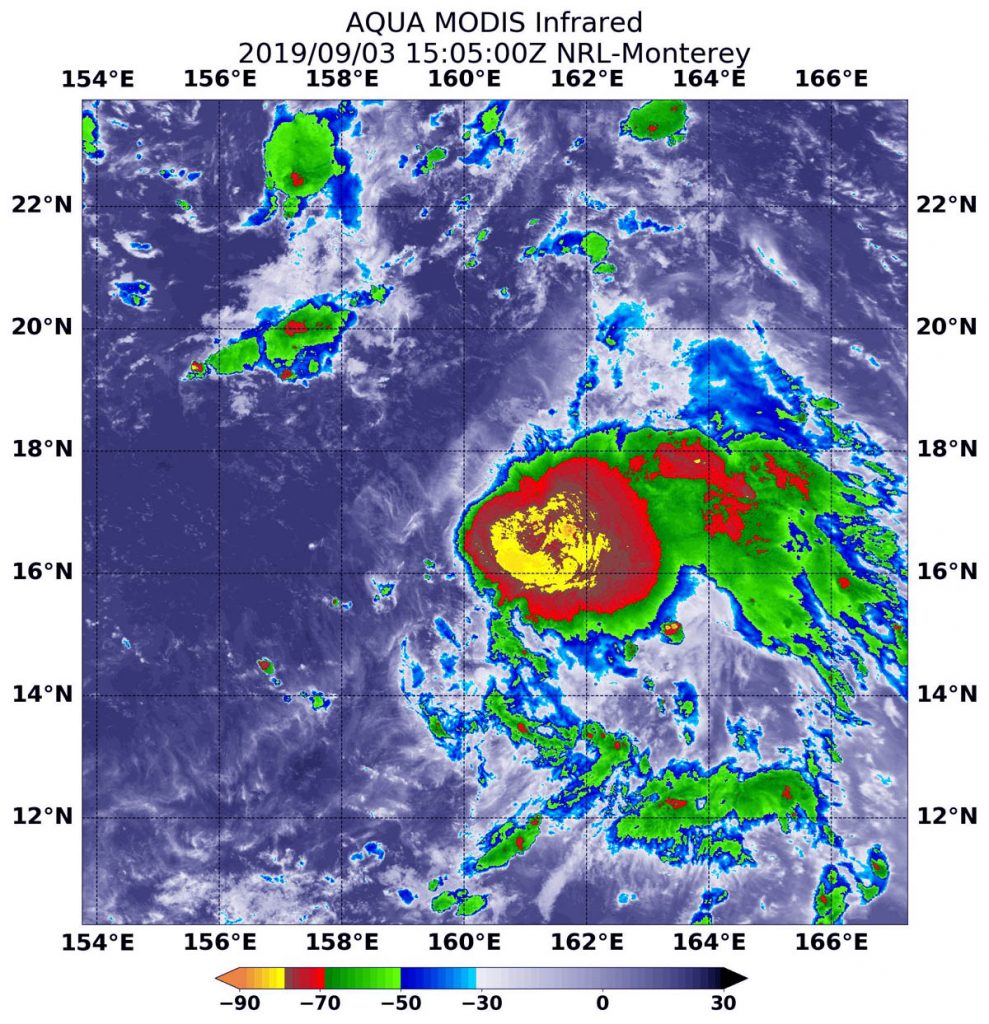
On Sept. 3 at 1:05 p.m. EDT (1505 UTC), the MODIS instrument that flies aboard NASA’s Aqua satellite showed strong storms (yellow) around 14W’s center where cloud top temperatures were as cold as minus 80 degrees Fahrenheit (minus 62.2 Celsius). Credit: NASA/NRL

On Sept. 3 at 1:05 p.m. EDT (1505 UTC), the Moderate Imaging Spectroradiometer or MODIS instrument that flies aboard NASA’s Aqua satellite used infrared light to analyze the strength of storms within the 14W. NASA researches these storms to determine how they rapidly intensify, develop and behave. In the data obtained about 14W, the very strong storms found near the center indicate the storm is strengthening.

Tropical cyclones are made of up hundreds of thunderstorms, and infrared data can show where the strongest storms are located. They can do that because infrared data provides temperature information, and the strongest thunderstorms that reach highest into the atmosphere have the coldest cloud top temperatures.

MODIS found those strongest storms were around the center of circulation where cloud top temperatures were as cold as minus 80 degrees Fahrenheit (minus 62.2 Celsius). NASA research has found that cloud top temperatures that cold indicate strong storms with the potential to generate heavy rainfall.

The Joint Typhoon Warning Center (JTWC) noted that, animated enhanced infrared satellite imagery shows that the low-level circulation center of the storm is exposed to outside winds, and that the strongest thunderstorms are being pushed to the eastern side of the storm, because of westerly winds. A microwave image at 6:47 a.m. EDT (1047 UTC) indicates tightly curved shallow banding of thunderstorms wrapping into the center with an isolated area of strong storms over the southeastern quadrant.

On Sept. 3 at 11 a.m. EDT (1500 UTC), Tropical Storm 14W had maximum sustained winds near 35 knots (40 mph/65 mph). 14W is far from land areas and is about 1,566 nautical miles southeast of Yokosuka, Japan. 14W is moving to the west.

JTWC said 14W will move west-northwest across the Pacific Ocean. The JTWC expects the system will gradually intensify to 90 knots after five days and move toward Japan.

By Rob Gutro
NASA’s Goddard Space Flight Center